Español (pdf)
 Articulo en XML
 Referencias del artículo
 Enviar articulo por email
 Citado por SciELO
  Citado por Google
  Similares en
SciELO
Similares en
SciELO  Similares en Google
 Permalink
Introduction
Investment in exchange-traded funds (ETFs) have strongly increased over the past decade (Blackrock, 2015). While this is a global development, most studies on ETFs focus on developed markets in North America or Europe. Yet, ETFs provide an opportunity to invest in a well-diversified portfolio of assets in emerging markets. Only in a small number of Latin American countries, ETFs track the respective market or index (e.g. in Colombia). Here, an investment in ETFs allows institutional and individual investors to invest in the economy. Since several of these Latin American economies are stable and strongly developing, the interest in these ETFs will likely increase in the future.
In this paper, we focus on Latin American ETFs and provide a detailed description of their level of (in)efficiency and share creation / redemption. We first examine the relation between ETF prices and the value of the underlying portfolio, i.e. the net-asset-value (NAV). We find significant deviations of the market price from its fundamental value and consider those to represent inefficiencies in the market. We explicitly analyze the development of the respective price/NAV ratio over time and document a mean reversion in said ratio. We then suggest a long-short trading strategy for Latin American ETFs that yields significant positive excess returns. Thus, trading on deviations in the price/NAV ratio exploits these inefficiencies.
Based on the analyses of the price/NAV ratio, we turn towards the question of how these deviations are addressed within the market. As ETFs are created to track an underlying index, deviations between prices and NAVs are undesirable. We focus on how the price/ NAV ratio influences the decisions of ETF share creation and redemption. We find that the probability for ETF creation (redemption) is larger when the ETF is trading at a premium (discount), i.e. when the ETF price is above (below) the NAV. This documents a strong link between the share creation and redemption process and ETF inefficiencies.
The finance literature has analyzed deviations between market prices and fundamental prices in ETFs (e.g.Madura and Richie, 2004; Tse and Martinez, 2007)1. Engle and Sakar (2006) provide a comparison between domestic (U.S.) ETFs and international ETFs. In both intraday and end-of-day analysis, they find comparatively smaller and less persistent price/NAV ratios in U.S. ETFs potentially indicating a higher level of efficiency of the U.S.
ETF market (at that time). Aber et al. (2009) examine the price volatility and tracking ability of iShares ETFs; they find that ETFs more often trade at a premium than at a discount and exhibit a comparatively large volatility in daily prices.
In a similar regard, Delcoure and Zhong (2007) document significant deviations in price/ NAV ratios which they attribute to an excessive ETF price volatility. These deviations are generally eliminated within two trading days. In contrast, Fulkerson and Jordan (2013) show deviations in price/NAV ratios to persist for up to five trading days with some mean reversion. Their results also indicate the price/NAV ratio to have some predictive power on future returns. To exploit this information in a portfolio strategy, Petajisto (2013) evaluates ETFs relative to peer groups tracking similar underlying assets. Based on the over-/undervaluation of individual ETFs, he derives an active long-short trading strategy.
Elia (2012) examines the premiums of Asian ETFs traded on the Italian markets, finding results comparable to Delcoure and Zhong (2007). DeFusco et al. (2011) examine the pricing deviations of the three most liquid ETFs (Spider, Diamonds, and Cubes) between 1999 and 2007 and document a predictability of price deviations.
Research related to ETFs in Latin American markets remains scarce. Rodríguez (2014) analyzes a sample of iShares from Brazil, Mexico, and Peru. He finds that although prices and NAV show a close relationship, Latin American ETFs are more likely to trade at a premium than at a discount. In addition, these deviations from net asset value (NAV) tend to persist for more than a day. Sampaio and Melo (2013) focus on arbitrage strategies with ETFs in the Brazilian market. Using a high-frequency time series, they document share-pricing inefficiencies. Charteris et al. (2014) study premiums and discounts of ETFs in a sample of emerging markets (Brazil, India, South Africa and South Korea). The authors find evidence for feedback trading significantly increasing in the presence of lagged premiums; a result directly linked to the ETF share creation and redemption process. In this context, Antoniewicz and Heinrichs (2014) explain the creation and redemption process in detail and explicitly state that the costs of creating and redeeming ETF shares are based on the NAV value (and not the current ETF price). Osterhoff and Overkott (2016) focus on the impact of ETF share creation and redemption on the underlying stocks' return and the efficiency of the closing auction. The authors focus on the authorized partners (AP) incentives for manipulating closing prices.
We contribute to the literature in several ways: First, we are one of the first to specifically analyze the ETF market in Latin America. Considering the stable economic growth of Latin American countries like Chile and Peru and the zero-interest-investment scenario in most developed countries, the interest for Latin American markets is likely to increase. Thus, a particular focus on Latin America provides important insights for investors. Second, we provide a detailed analysis of discrepancies between ETF prices and the NAVs of their underlying portfolios. This documents the level of (in)efficiencies in the respective markets and thereby adds to our understanding of market development and depth. Finally, we contribute to the literature on ETFs' APs. While the liquidity in ETFs is generally assumed as given, it is important to note that APs ensure this liquidity via transactions in the primary market for ETFs. Only a small number of papers has so far focused on APs in ETF markets and analyzed their decisions for share creation and redemption.
The paper is structured as follows: Section 1 provides some background information on ETFs, section 2 provides a short discussion of price inefficiencies from an efficient market vs. behavioral finance point of view. Section 3 presents our data and research methodology. Section 4 presents our results for the development of the price/NAV ratios, the long-short trading strategy, and the ETF share creation and redemption process. Finally, the findings, conclusion, and suggestions for future research are presented.
1. Background on ETFs
An ETF is a marketable security that aims to replicate the performance of a particular benchmark index of stocks, bonds, commodities, currencies or other underlying assets. These index-linked securities thus facilitate the investment in a market and/or index, i.e. they enable investors to trade broadly diversified portfolios of securities in single transactions (Picard and Braun, 2010). ETFs thereby provide a high level of diversification with low trading costs.
ETFs are very similar to index mutual funds because they are passively traded diversified portfolios of securities, but unlike mutual funds, ETFs are traded like individual stocks listed on stock exchanges and their price is influenced by supply and demand (Gastineau, 2011). Moreover, it is allowed to perform transactions such as short-selling, margin trading and stop-loss orders for ETFs (Deville, 2008). Other important advantages are low costs, high liquidity, flexibility and transparency compared to mutual funds (Ba§ and Sarioglu, 2011). When an investor buys shares of a given ETF, he/she is indirectly buying shares of a portfolio that tracks the underlying index: In this sense, ETFs "don't try to beat the market, they try to be the market" (NASDAQ, 2016).
Toronto Index Participation Shares (TIPS) were the first ETFs, launched in 1990 in the Toronto Stock Exchange; later, ETFs were introduced in 1993 in the U.S. to replicate the S&P 500 index (Standard & Poor's Depositary Receipts - SPDR or "Spider" currently the largest ETF by asset under management). In Europe, Deutsche Borse and the London Stock Exchange were the pioneers on the ETF market on 2000 with the XTF and ExtraMARK (Zopounidis etat., 2008). ETFs are now one of the most popular financial instruments in many places around the world: Data from World Federation of Exchanges shows that ETFs listed in 2003 totaled 331, while in 2016 this number increased to 9,528 with a global market capitalization of USD 67.2 trillion at the end of June 2016 (World Federation of Exchanges, 2016). Their arrival to Latin America has been very recent: For example, in Chile, the first ETF arrived in 2009 linked to the Santiago IPSA index, while in Colombia ETFs were launched in 2011 to track the Colcap-20 index.
ETFs can be considered a hybrid between stocks and mutual funds, and thus they have in fact two prices: Their market value (price at which shares can be bought or sold on the exchange) and their NAV. According to the law of one price, security prices should be the same in different markets due to arbitrage activity (Hasbrouck, 1995). In that sense, it could be expected that fluctuations in secondary market prices would follow the same index returns, but, given that the shares are traded on the stock exchange and that markets are not fully efficient, there is usually a difference between the fundamental value of the fund and the market price.
The concept of an ETF builds on successful "index tracking", which means that ETFs follow a specific benchmark index in order to deliver its return as closely as possible, such as a stock index or bond index. In the case of full-replication ETFs, the portfolio of underlying stocks is physically held by the ETF. Consequently, the ETF price should generally equal the price of the underlying portfolio, i.e. the price/NAV ratio should equal 1. Considering transaction costs and bid-ask spreads may explain part of the variation between ETF prices and their NAV (see e.g.Charupat and Miu, 2013). Deviations between the ETF price and its NAV may also be explained by the (generally) higher liquidity of ETFs. This makes it more feasible for institutional investors to trade even a larger volume in the ETF than in local markets. Thus, there may be higher supply or demand in ETF markets than in local markets leading to the price/NAV ratio deviating from 1.
To ensure the successful tracking of an ETF, an adequate liquidity is necessary so that the market can eliminate the deviations via supply and demand. Each ETF has a so-called authorized partner (AP) who ensures the tradabiLity (and thus liquidity) of the ETF. In this context, it is important to note that the total number of shares is not constant for ETFs. New shares may be created at any time and shares may also be redeemed at any time. This creation and redemption of ETF shares is a service provided by the AP. For example, in the case of share creation, the AP acquires the respective underlying assets in the secondary market, transfers these to the ETF Company, and gets the respective newly issued number of shares in return. The opposite occurs in the case of share redemption. Thus, the AP not only manages the total number of shares, but may also impact the respective price/NAV ratio via the transactions in the secondary market, i.e. the AP's creation and redemption decision may have a direct impact on the price/NAV ratio and thus the level of inefficiencies.
In addition, the AP may create or redeem ETF shares for its own account. As the AP is generally a large financial institution, it may use its own money to create or redeem ETF shares whenever these actions are profitable. The AP is the main agent in the primary market for ETFs. Hence, the respective creation or redemption decision does not need to be met by supply and demand in the secondary market for ETFs. ETF shares are always created and redeemed for the value of their underlying assets. Therefore, it is profitable for the AP to create (redeem) ETF shares when the ETF price is significantly above (below) the value of the underlying portfolio. For example, when the ETF trades at a significant premium, the AP would buy the underlying portfolio and trade it in for ETF shares that currently trade at a higher price.
2. Price (in)efficiency: A short review
Classic finance theory assumes investors to be rational markets to be efficient, and actual security prices to reflect their fundamental values (Fama, 1970, 1998). Moreover, the traditional theory states that even if investors are not fully rational, their biases are not systematic. Therefore, such biases wash out in aggregation, and even if a few investors were systematically biased, rational ones would be able to take advantage of the situation and irrational investors should eventually be driven out of the market (Rau, 2010). Nonetheless, over the last decades, research on the markets' actual behav'or has documented evidence against the Efficient Market Hypothesis (EMH).
EMH considers that the current market price of a financial security tends to its fundamental value, calculated by discounting future cash flows. The EMH neither specifies future cash flows nor the adequate discount rate. It rather assumes that markets use them in a correct manner, consistent with a normatively acceptable preference specification, so the price equals the best possible estimate of the present value of its expected cash flows.
Fama (1965) states that in an efficient market, prices will be good estimates of fundamental values, and they correctly reflect the preferences of investors and underlying risk. If all investors are rational and markets are efficient, they will value securities as equivalent to their expected discounted cash flows. If the price is below the fundamental value, investors will increase demand until the price returns to equilibrium. If the price is above the fundamental value, investors will sell (or short-sell) the security. In the case that some investors are "irrational", trading amongst each other and with rational investors will make their misperceptions to cancel each other out (Szyska, 2010).
For some decades, the EMH was accepted by the majority of finance scholars, i.e. individual rationality and market efficiency were taken as a fact. When new information comes to the market, it is assumed to spread quickly and to be correctly incorporated into stock prices. In this case, neither technical analyses nor fundamental analyses are useful to build a profitable investment strategy.
But a growing number of scholars believed stock prices to be predictable to some degree, if psychological and behavioral aspects were taken under consideration. This led to the development of behavioral finance, a term that Shefrin (2002) defines as "the study of how psychology affects financial decision making and financial markets". Many empirical studies started to show evidence of persistent imperfections and regular patterns in financial markets (Shiller, 1981; Ippolito, 1989; Lakonishok et al., 1992), indicating that in many markets prices are different from fundamental values in a systematic way, and that investors are "irrational" and their biases do not cancel each other, sometimes even in the long run. Such facts started to be called "anomalies" because they departed from the traditional assumptions of financial theory.
Behavioral finance points out a group of limitations that may explain why rational arbitrageurs do not (or cannot) take immediate actions that would equal prices to fundamental values: Limits to arbitrage include noise trader risk, fundamental risk (DeLong et al., 1990; Shleifer and Summers, 1990), synchronization risk (Abreu and Brunnermeier, 2002) and implementation costs, along with regulatory and institutional barriers (Shleifer and Vishny, 1997).
Three main theoretical explanations have been proposed by behavioral finance for the observed departure from market efficiency (Shleifer, 2000): The first, investors are not fully rational (Kyle, 1985; Black, 1986); DeLong et al., 1990; Barberis and Thaler, 2003); the second, trader irrationalities do not cancel each other out because they are not random but correlated (Kahneman and Tversky, 1979; Kahneman and Riepe, 1998); and the third, arbitrage is not always risk-free (Goodfellow et al., 2001). In the presence of limits to arbitrage, noise traders could drive prices away even more from its equilibrium level (Lee et al., 1991). Hence, security prices may not immediately revert to their fundamental values.
In subsequent analyses, we examine the level of (in)efficiency in Latin American ETFs by focusing on the relation of market valuation (ETF price) and fundamental valuation (net asset value). By suggesting a simple long-short trading strategy, we test for market efficiency, i.e. if these markets are perfectly efficient, a naive long-short-trading strategy should not generate a positive excess return.
3. Data and methodology
We aim at furthering the understanding of ETFs in Latin American countries and therefore strictly limit our data to those equity ETFs tracking one (or several) countries / indices in this geographical region. We furthermore restrict ourselves to ETFs offered by larger ETF providers like iShares and Global X.
Despite ETFs' popularity in most western countries and their strong growth in recent years, the number of ETFs in Latin American countries is still highly limited. In sample creation, we checked for ETFs with this geographical focus in Bloomberg and could only identify seven ETFs fitting the following criteria: Tracking an index in Latin America, trading at the New York Stock Exchange (NYSE), and following an asset based replication strategy2. These ETFs are: Global X FTSE Andean 40 (Andean), Global X MSCI Argentina (Argentina), iShares MSCI Brazil Capped (Brazil), iShares MSCI Chile Capped (Chile), iShares MSCI Colombia Capped (Colombia), iShares MSCI Mexico Capped (Mexico), and iShares MSCI Peru Capped (Peru).
Table 1 Descriptives of ETFs
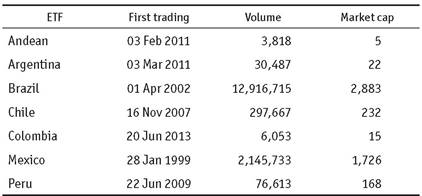
Note: Descriptive information for seven Latin American ETFs in 2015. Volume represents the average daily trading volume in 2015, and market cap shows the average daily market capitalization in million USD in 2015.
Source: Own elaboration base on Bloomberg data.
For these seven ETFs, we collect data from the Bloomberg database for the time period from the respective first trading day up to 25 July 2016. Our data encompasses the daily close price of the ETF, the daily NAV, the daily market capitalization, and the daily volume traded. Table 1 provides an overview of ETF inception dates, average trading volume (in 2015), and average market capitalization in USD (in 2015).
The daily information on each ETF's NAV is taken from Bloomberg. Regarding the NAV calculation, the Bloomberg Trade Book gives the following statement: "To establish the daily NAV, the fund chooses a specific time every day at which to value its underlying assets. For example, for an equity ETF, the NAV is calculated once all the markets being tracked by the ETF's underlying assets have closed" (see https://www.bloombergtradebook.com/blog/challenges-etf-nav-trading/). Moreover, it is mentioned that the respective calculations are always done in the base currency of the fund. The NAV information provided by Bloomberg is the official information presented by the fund administrator.
In our sample of Latin American ETFs trading at the NYSE, the base currency is the US dollar (US-$). The respective NAV information taken from Bloomberg is also in US-$ with conversions from local stock prices (in local currencies) done by the fund administrator or a third-party provider.
We further use the official data provided by Bloomberg to determine the daily number of total shares outstanding for each ETF. Hereto, we divide the daily market capitalization by the daily close price. We check this time series for potential errors and also adjust for minor deviations due to the price information being limited to two decimals. Changes in the number of total shares outstanding for each ETF allow us to clearly identify share creation and redemption events.
The sample encompasses the majority of ETFs in this region, but the respective constituents are highly heterogeneous. For example, they strongly differ in size (measured by market capitalization) and daily trading volume. The ETFs for Mexico and Brazil are very large in capitalization, while the ones focusing on the Andean region and Colombia are fairly small for international standards. Five ETFs are issued by iShares, while two are issued by Global X. While the Mexican ETF has been public since 1999, the Colombian ETF was only initiated in 2013.
After checking for data errors in either time series, we use this information to calculate the respective returns and the price/NAV ratio. The price/NAV ratio is calculated as the ratio of daily ETF close prices over end-of-day NAVs for each ETF. When market valuation equals fundamental value, this ratio equals 1. When market valuation is higher (lower) than fundamental value, the price/NAV ratio is above (below) 1, i.e. the respective ETF trades at a premium (discount).
We consider strong deviations from 1 in the price/NAV ratios as inefficiencies in the Latin American ETF market. If these inefficiencies in the price/NAV ratio contain valuable information, it should be possible to exploit a positive excess return based on trading on the price/NAV ratio. Hereto, two underlying assumptions need to be met: first, the price/NAV ratio is mean reverting (e.g.Gasbarro et at., 2003; Petajisto, 2013), and second, the adjustment in the price/NAV ratio predominantly occurs via changes in ETF prices. Before implementing a long-short trading strategy, we therefore test for these assumptions in our sample.
Regarding the first assumption, we analyze average changes in price/NAV ratios for the long (short) position over time while holding the respective constituents constant. We calculate the price/NAV ratio for the long and the short positions at each trading day t, then hold these two constituents fixed, and calculate the price/NAV ratio on the previous trading day t - 1 and on the following trading day t + 1. Regarding the second condition, we now need to analyze whether this mean reversion is predominantly caused by changes in ETF prices or changes in NAV. We therefore calculate the average change of ETF prices (rETF) and the average change of NAV (rNAV) for ETFs trading at the lowest discount and the highest premium, respectively.
In order to quantify the size of these inefficiencies, we suggest a long-short trading strategy based on price/NAV ratios. Regarding the return expectation of individual ETFs, we generally expect ETFs currently trading at a discount (price < NAV) to experience a price increase in the near future, i.e. a price adjustment in order to initiate a mean reversion of the price/NAV ratio to 1. For ETFs currently trading at a premium (price > NAV), we expect a price decrease in the near future so that the price/NAV ratio reverts to 1.
Our trading strategy therefore focuses on the two ETFs with the daily extreme price/NAV values within the sample of Latin American ETFs. We go long with the ETF with the lowest price/NAV ratio and go short with the ETF with the highest price/NAV ratio. We hold both positions for one trading day, liquidate the long and the short position, and immediately restart our trading strategy3. Thus, we solely trade ETFs at the NYSE and do not make any transactions in the portfolio of stocks (NAV) at local exchanges.
Since we suggest an active trading strategy that requires two individual trades per day, we only start the implementation of our strategy when at least three ETFs are available to us, i.e. the sample period starts on 19 November 2007 when Brazil, Chile, and Mexico are traded. And the sample itself increases with every newly incepted ETF up to 20 June 2013 when Colombia first traded.
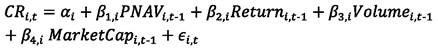
In the analysis of this long/short trading strategy, we address the influence of difference in risk exposure. Hereto, we follow the time-series approach suggested by (Black et at., 1972) in testing the Capital Asset Pricing Model (CAPM) and also utilize Fama-French risk factors (Fama and French, 1993). For the long portfolio, the short portfolio, and the combined long-short trading, we thus calculate the following regressions:

with rit the excess return of ETF i at trading day t over the risk free rate, rtRMRF the market excess return with the value-weighted return of all CRSP firms incorporated in the U.S. and listed on the NYSE, AMEX, or NASDAQ as the market, rtSMB the Fama-French factor for "small minus big" with daily global factor data taken from Kenneth French's webpage, and rt HML the Fama French factor for "high minus low" again with daily global factor data taken from Kenneth French's webpage.
After the documentation and analysis of inefficiencies in Latin American ETF pricing, we then turn to the question of how these inefficiencies may be addressed within the market. As ETFs aim at replicating the underlying portfolio, deviations between the ETF price and the NAV are undesirable. Therefore, the AP's decision for share creation and redemption may be directly influenced by the price/NAV ratio. We analyze the relation of the AP's creation and redemption decision and the respective price/NAV movement for the sample of iShares ETFs4.
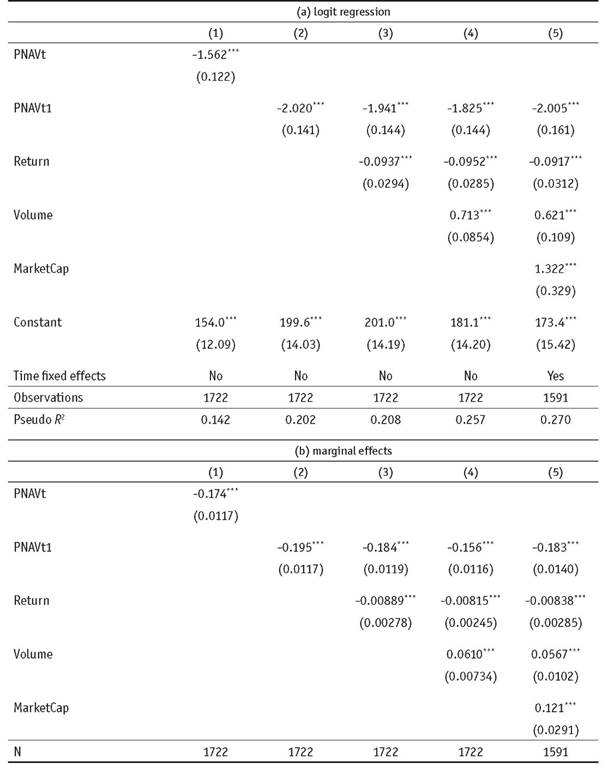
We conduct a two-step analysis: We first analyze creation and redemption events separately in a respective event study for each ETF. For a time window of five trading days before and after the creation (redemption) event, we analyze the development of the price/NAV ratio and the ETF return. Second, we analyze this relation via the following logit regressions for each ETF:
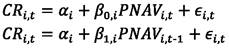 (1)
(1)
 (2)
(2)
 (3)
(3)
 (4)
(4)
with CR being a binary variable taking the value of 1 when shares are created (redeemed) in ETF I at day t, PNAV the price/NAV ratio, Return the ETF gross return over the previous three trading days (Pt-1/Pt-4), Volume the log average volume traded in the ETF between t - 4 and t - 1, Market Cap the ETF market capitalization at t - 1. In regression (5), we additionally control for year-fixed effects.
4. Results
4.1 Development of Price/NAV Ratios
Table 2 Descriptive Statistics for ETFs
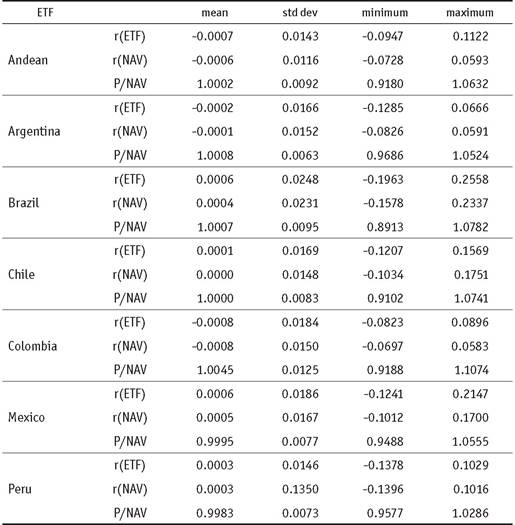
Note: Descriptive statistics for each ETF over the full sample period. r(ETF) indicates the daily return of an individual ETF; r(NAV) is the daily return of net-asset-values; and P/NAV represents the daily ratio of ETF prices to NAV.
Source: Own elaboration.
Table 2 presents descriptive statistics for all ETFs in our sample. The average daily price/ NAV ratio is 1.0042, i.e. the ETF price is on average 0.42% larger than the price of the underlying portfolios (NAV). In our sample, the lowest (highest) price/NAV ratio per ETF is 0.89143 (1.1074), i.e. ETFs trade within a range of 89.14% and 110.74% of the underlying assets (trading at a discount and premium, respectively).
While the ratio's mean and median are close to 1, there are significant deviations in time series. Assuming ETFs trading at a premium (discount) to be overvalued (undervalued), a price correction could occur in the (near) future. Hence, an investment in these ETFs would then generate a negative (positive) excess return.
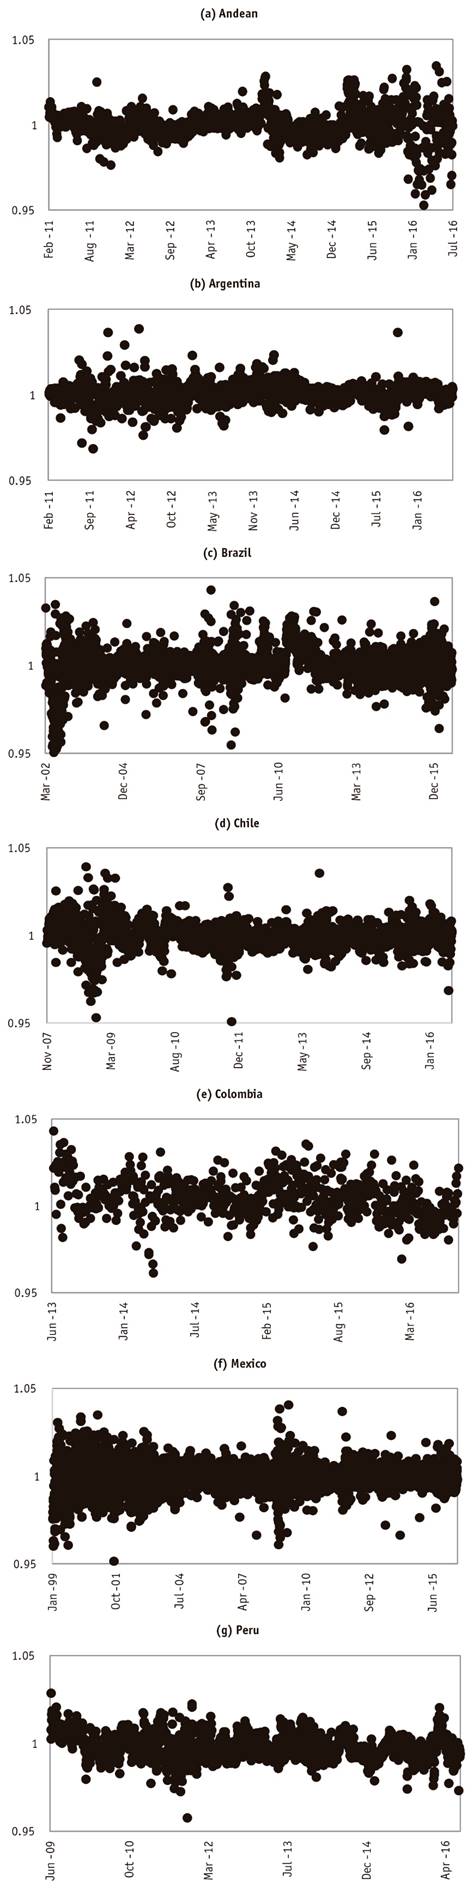
Figure 1 shows the development of the price/NAV ratio for individual ETFs over time. For all ETFs, we see significant |deviations from 1 in the price/NAV ratio. Most notably, the Andean ETF has strong fluctuations in price/NAV ratios in recent months. The same is true for Brazil (most likely due to political turbulences) and also for Colombia (most likely due to its recent inception and thus smaller size). While the time series for Colombia may be explained by its recent initiation, it is interesting to note that Mexico (as the ETF with the longest time series) still shows considerable fluctuations in price/NAV ratios. Finally, we also point out the similarities between Chile and Peru.
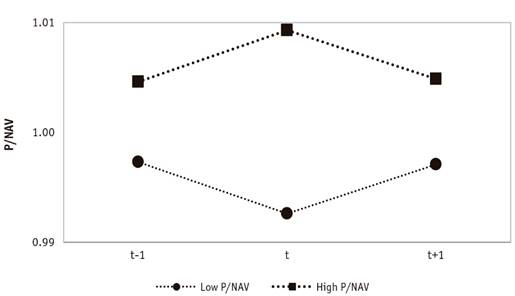
To implement a profitable trading strategy based on the information content of the price/ NAV ratio, two basic assumptions need to be met: first, the ratio needs to be mean reverting, and second, the main adjustment needs to occur in the ETF price (instead of the underlying NAV). Regarding the mean reversion of price/NAV ratios, results in Figure 2 document a mean reversion in price/NAV ratios. For ETFs currently trading at the lowest discount, the average price/NAV ratio that day is 0.9926. One day before (at t - 1), the respective average price/NAV ratio was 0.9973; and one day later (at t + 1), the ratio is back up to 0.9971. Thus, there is a mean reversion in ETFs trading at the lowest discount. A comparable result is evident for ETFs currently trading at the highest premium. On the day that they are selected in our long-short trading strategy, they on average trade at a price/NAV ratio of 1.0093. One day before (at t - 1), the price/NAV ratio was 1.0046, and it is at 1.0048 in t + 1. Hence, we also see a mean reversion for ETFs trading at the highest premium. Consequently, these stronger deviations between ETF price and NAV do not persist in the long run.
Note: ETFs are selected based on the highest and lowest price/NAV at time t. The price/NAV ratio is calculated with the same constituents for the previous trading day t - 1 and the following trading day t + 1. Results are average over the full sample period.
We now turn towards the second assumption (i.e. the adjustment process in the price/ NAV ratio predominantly occurs in ETF prices). Results in Table 3 show the ETF prices as well as the underlying value of assets adapt. In the case of the long position, i.e. trading in ETFs with the lowest discount, the ETF price increases by 0.25% over a single trading day. With an increasing ETF price, the price/NAV ratio is moving closer to 1. In addition, the respective NAVs decrease by 0.21% in a single trading day, and thus lead to a further increase in the price/NAV ratio. Hence, the mean reversion of the price/NAV ratio is driven by changes in both ETF prices and underlying assets5. The respective opposite argument holds for the short position, i.e. trading in ETFs with the highest premium.
Results in Table 3, however, show that the impact of the ETF price movement is larger in absolute terms than the adjustment in NAVs. Consequently, the larger changes in ETF prices represent a larger (ex ante) return potential. Moreover, the changes in ETF prices are exploitable with a single transaction; trading in the NAV (while theoretically possible) would require a replication of the underlying portfolio which comes with a significantly larger number of individual trades. Consequently, we also consider the second assumption for profitable trading to be met.
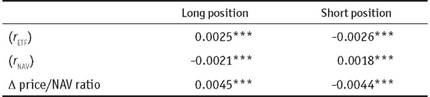
Note: ETFs are assigned based on price/NAV ratio on the previous trading day. Average daily changes in price/NAV ratio (( price/NAV ratio) are dissected into changes in ETF prices (rETF) and changes in NAV (rNAV). ***/**/* denotes statistical significance at the 1% / 5% / 10% level.
4.2. Trading Strategy on Price/NAV Ratios
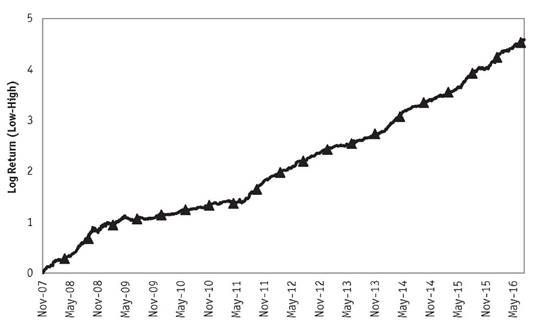
Our daily trading strategy consists of going long with the ETF with the lowest price/NAV ratio and going short with the ETF with the highest price/NAV ratio. Figure 3 shows the cumulative log return of this strategy over the full sample period. We see a strong and significant positive cumulative return of the strategy with some very steep increases (e.g. in 2007/2008) and periods of more moderate growth (e.g. during the financial crisis of late 2008 to mid-2010). In general, results in Figure 3 show that implementing this longshort trading strategy is profitable and that a diversified, strategic investment in Latin American ETFs may lead to significant positive returns6.
We address the risk exposure of the long-short strategy by testing the Capital Asset Pricing Model (CAPM) and Fama-French risk factors. Results in Table 4 show that our trading generates a significant excess return (a) of 0.5% per day. The long and the short position contribute almost equally to this average daily excess return. In addition, the (b) coefficients for the long and the short positions are similar so that they lead to a reduction in overall risk exposure in the long-short strategy. In general, the deviations between ETF prices and NAVs represent mispricing, and assuming a large enough deviation covers possible trading costs, these also represent an arbitrage opportunity.
While we do not control trading costs in our analyses, we provide the interested reader with a short discussion of (potential) trading costs. These would consist of three components: 1) transaction costs at the NYSE. The transaction costs for ETF are between US-$ 0.0020 and US-$ 0.0031 per share, depending on ETF liquidity. This equals an average transaction cost of 1.4 bp. Since we make four trades per day (one long, one short, and liquidating the long and short positions of the previous trading day), transaction costs of 5.6 bp would incur each day; 2) shorting fees. Short selling fees are a compensation for the opportunity cost of money. As we hold the position for a single day, the impact of this opportunity cost is fairly small. Moreover, when we consider the low interest rate environment in the U.S. for most of our sample period, the influence of this short selling fee is most likely negligible. 3) the bid-ask spread. Previous analyses in other ETF markets (see e.g.Kreis and Licht, 2016) have shown the bid-ask spread to have a non-negligible impact on ETF trading. Unfortunately, we do not have this information available to us in a sufficient frequency. Thus, we can only assume the bid-ask spread to lower the excess return.
Table 4 Regression results of the long-short trading strategy
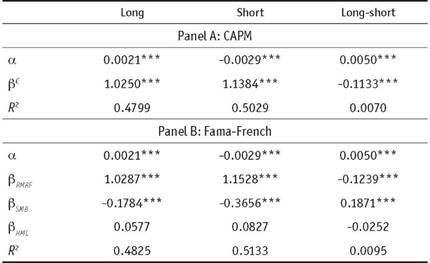
Note: ETFs are assigned based on price/NAV ratio on the previous trading day. ***/**/* denotes statistical significance at the 1% / 5% / 10% level.
Source: Own elaboration.
It is now interesting to analyze how individual ETFs contribute to this overall result. Table 5 shows the distribution of individual ETFs in long and short trading. For the long position (i.e. ETFs trading at the lowest discount), a significant number of trades occur in Peru, Mexico, Chile, and Brazil. Yet, the largest return contribution is achieved by trades in Andean, Chile, and Argentina. While we trade less frequently in these ETFs, the individual trades actually provide a larger return. On the other hand, Peru most often has the lowest discount, but trading on this information seems less profitable. Consequently, the ETFs differ regarding the information content of their price/NAV ratio and (ex ante) return expectation.
A similar reasoning holds for the short position, i.e. ETFs trading at the highest premium. Results in Table 5 show that the largest number of short trades occurs in the Brazilian ETF, yet this one had the lowest overall return contribution and we incur a loss in these trades. On the other hand, we trade less frequently in the Andean ETF, but when we do trade, the daily return is significant at 0.66% per day.
Table 5 Contribution of individual ETFs to overall strategy
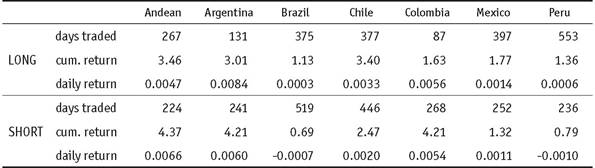
Note: For the sample period 19 November 2007 to 27 July 2016, the number of days traded in the long / short position are counted for each ETF. In addition, the cumulative return of these trades as well as the respective daily return are calculated for the long and short position, respectively.
Source: Own elaboration.
These results show that individual ETFs in Latin America significantly differ in the information content of the price/NAV ratio. For example, the information in the Andean and Argentina ETF seems valuable for investors and allows for a positive gross return. In contrast, trading on the price/NAV ratio leads to a comparatively small return of 0.06% per long trade and an actual loss of -0.1% per short trade. Regarding the Colombian ETF, results should be interpreted with caution as the time series is fairly short.
4.3. ETF creation and redemption
For each ETF, we analyze creation and redemption events separately within a time window of five trading days before and after the event. We first examine the development of the price/NAV ratio together with the ETF return development. Results are presented for the five iShares ETFs in Figures 4 to 8. These figures all follow the same structure: figure a) shows the respective share creation and redemption events. Figure b) analyzes the P/ NAV ratio and ETF return for a time window of ± five trading days around creation events, and figure c) provides the information in the case of a redemption event.
Figure 4 displays results for Brazil. Figure 4(a) shows the respective creation and redemption events over time. We see that creation and redemption events cluster in certain time periods. For example, up to mid 2009, there are hardly any redemption events, but a large number of creation events, while from early 2013 onwards, redemption events occur more often than creation events. When we now turn to Figure 4(b), we see the average development of the price/NAV ratio and the ETF return around creation events (t = 0).
Apparently, the average price/NAV ratio peaks one day prior to the creation event, i.e. at t - 1 and then decreases. Only in the case of Mexico, the ratio peaks at t.
This development is in line with the process of ETF creation. When the AP buys the respective underlying assets (stocks) and hands them in for newly created ETF shares, it thereby increases the demand for the respective stocks. Thus, the NAV should increase, leading to a decrease in the price/NAV ratio. Moreover, this ETF creation at a time of comparatively high price/NAV ratios is strongly advantageous for the AP: the AP acquires the underlying assets for a lower price as the ETF, i.e. the AP trades in a basket of stocks for an ETF share with a higher valuation7.
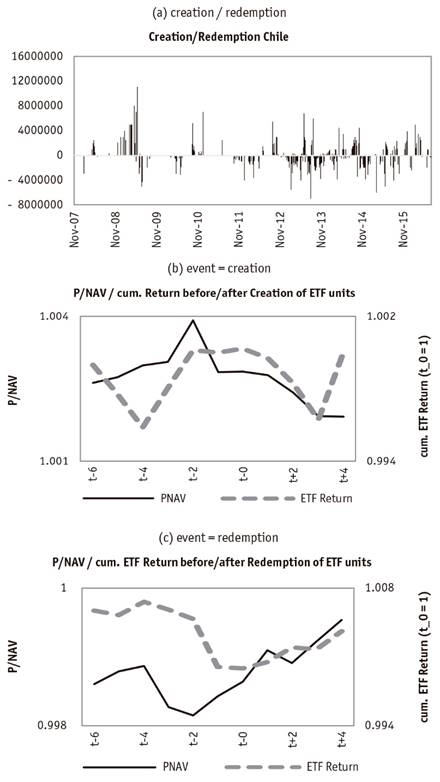
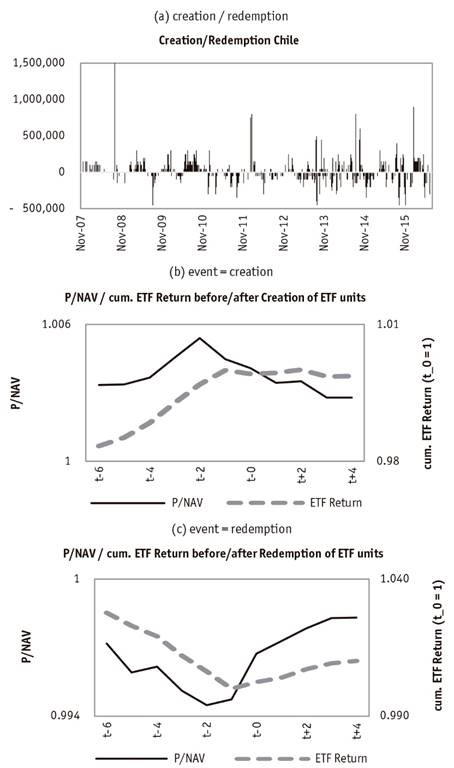
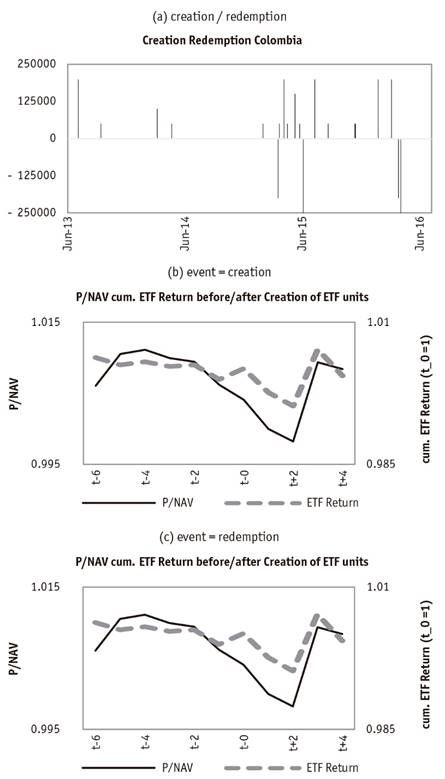
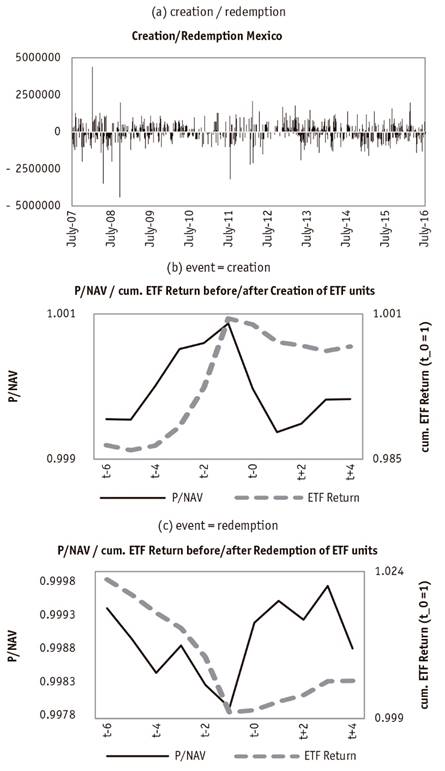
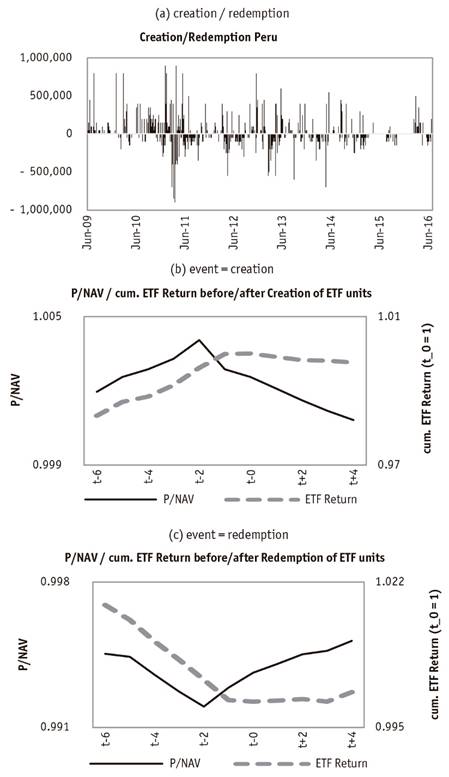
Figure 4(b) also shows the development of the ETF return around creation events. There is a strong positive ETF return between t - 3 and t - 1; this development may be caused by an increased demand for the ETF leading to higher prices and thus higher returns. Following this reasoning, the increased demand for the ETF would also allow the AP to create new shares to ensure the overall liquidity of the ETF and to reduce the mispricing between ETF and the underlying portfolio.
Figures 5 to 8 show results for the ETF of Chile, Colombia, Mexico, and Peru, respectively. Results are qualitatively comparable with the exception of Colombia. Here, we have a very small number of creation and (in particular) redemption events, most likely due to its comparatively short trading period since 2013. The results for Colombia are therefore statistically not robust and unfortunately do not allow insights into the creation and redemption process in this market. The Colombian ETF is subsequently omitted from further analyses.
The results from Figure 4 to Figure 8 suggest that the development of the price/NAV ratio may impact the decision for share creation and redemption. To gain more detailed insights into this relation, we analyze the influence of the price/NAV ratio on the share creation/ redemption decision via logit regressions for each ETF (see Section 4 for specification of regression equations)8.
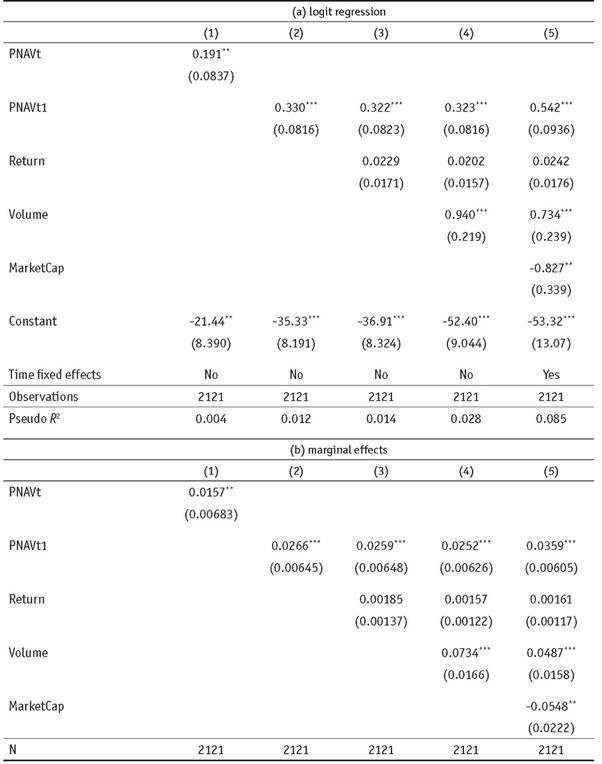
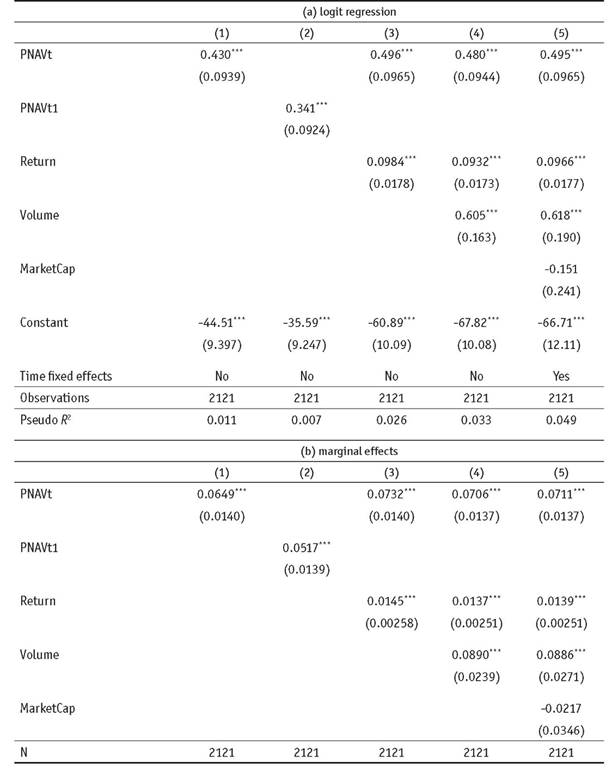
Tables 7 to 10 display results of the logit regression and the marginal effects for creation events; Tables 11 to 14 display results for redemption events. We first turn towards our results for creation events. As results for all four ETFs are comparable, we focus in our interpretation of results for Brazil in Table 7.
Table 6 Probability for share creation and redemption with mean values for independent variables
Note: *** denotes statistical significance at the 1% level. Source: Own elaboration.
Source: Own elaboration.
We first run logit regressions with only the price/NAV ratio over different lags as the independent variable. Results in Table 7 show a positive impact for the price/NAV ratio of t and t - 1 with the larger marginal effect associated with the latter one. Adding the ETF price return over the previous three trading days does not have a significant impact on share creation. In contrast, the log average volume traded over the previous three trading days does have a significant positive impact, while the market capitalization of the ETF has a negative influence in our logit regression.
These results show that an increase in the price/NAV ratio generally increases the probability of ETF shares being created. In this relation, the price/NAV ratio at t - 1 has the largest impact on the creation decision at time t. This is in line with our previous reasoning regarding AP's incentives for share creation and the reduction of market inefficiencies between ETF prices and NAVs.
In addition, the trading volume over the previous trading days also has a positive influence on the probability of share creation, i.e. the more trades occur in the ETF, the more likely it is for the AP to create new shares, most likely to ensure the respective liquidity in the market. For the market capitalization, we find a negative influence. When the market capitalization is already high, the AP may apparently reduce her interventions via share creation.
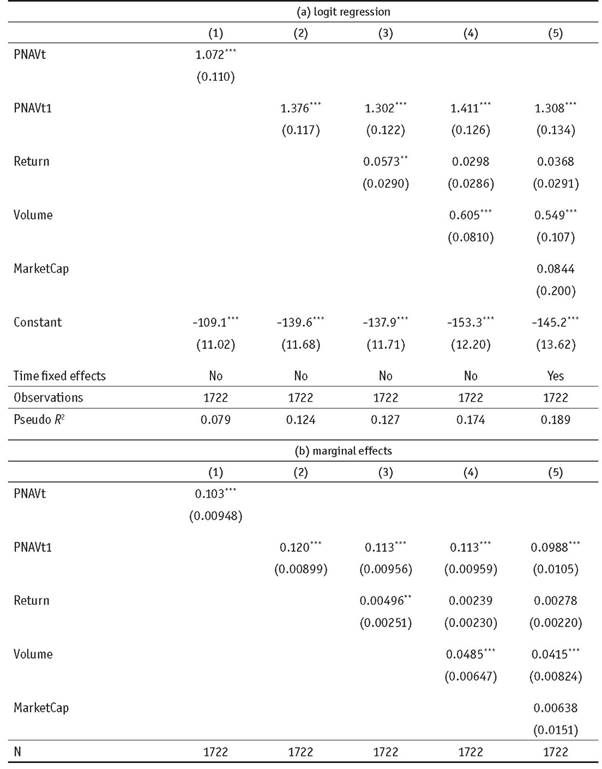
In the case of Mexico (Table 9), we find results comparable to those of Brazil, but here the price/NAV ratio at time t has the largest impact (in comparison to the price/NAV ratio at t - 1 for the remaining ETFs). This may be caused by closer economic ties between Mexico and the United States (e.g. regarding NAFTA) and/or the Mexican ETF having a significantly longer time series. Either reason may lead to a larger number of institutional investors focusing on Mexico, leading to a faster response of the AP to deviations in the price/NAV ratio and thus a faster ETF creation and redemption.
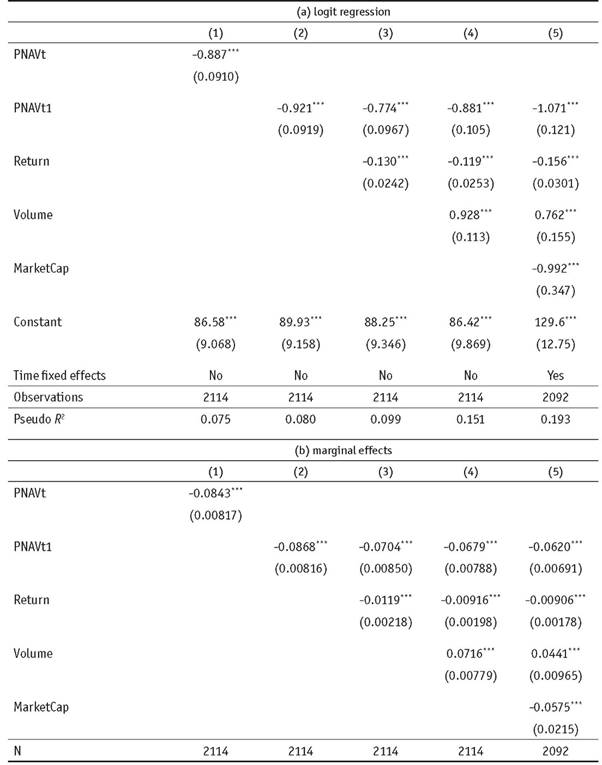
Results for the analyses of redemption events in Tables 11 to 14 find the respective opposite relation of the price/NAV ratio and redemption events. Here, the price/NAV ratio has a significant negative impact on the redemption decision, i.e. the lower the price/NAV ratio, the higher the probability for share redemption. This is in line with our prior reasoning, too. When the ETF price is below its NAV, the AP trades ETF shares in for the value of the NAV, i.e. the AP earns the respective deviation.
It is interesting to note that the market capitalization often has a negative impact on the decision for both creation and redemption. This may be interpreted as the AP reducing the liquidity management via share creation / redemption with an increase in ETF size.
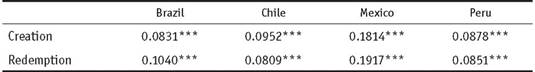
Finally, we provide results for the mean probability of share creation and redemption in Table 6, i.e. the probability assuming all independent variables take on their mean values. Hereto, we utilize the final logit regression equation, set all independent variables to their mean values, and calculate the average probability for share creation and redemption in the respective ETF. The probability for creation and redemption generally lies between 8% and 10.4%. Only in the case of Mexico is the probability for either event significantly higher at 18.14% and 19.17% respectively.
Our results document a significant influence of the price/NAV ratio on the AP's decision for share creation and redemption. This result is in line with the literature on ETFs and perfectly matches the conceptual considerations for an index-tracking asset. This paper is - to the best of our knowledge - one of the first to analyze the AP's decision process empirically and to directly link it to market inefficiencies.
Conclusion
In this paper, we have empirically evaluated the pricing efficiency of a representative group of Latin American ETFs (Global X FTSE Andean 40, Global X MSCI Argentina, iShares MSCI Brazil Capped, iShares MSCI Chile Capped, iShares MSCI Colombia Capped, iShares MSCI Mexico Capped, and iShares MSCI Peru Capped). Based on an analysis of price/NAV ratios, we have quantified these inefficiencies in a trading strategy and further analyzed their impact on share creation and redemption.
Our results document significant delations between ETF prices and underlying assets in all ETFs. These deviations are generally larger than those in more developed financial markets (e.g. U.S.) and they may be exploited in a long-short trading strategy. Thus, the price/NAV ratio contains valuable information for investors. This finding contradicts the assumption of the EMH and actually supports the presence of behavioral "anomalies" like systematic biases.
However, individual market participants like the ETF's AP seem to be aware of these inefficiencies and aim at reducing their impact. This is evident in the AP's decision for share creation and redemption being influenced by the price/NAV ratio. The analyses have shown the probability for ETF creation (redemption) to be larger for ETFs trading at a premium (discount). This documents a strong link between the share creation and redemption process and ETF inefficiencies.
An alternative explanation for the results on share creation and redemption may be seen in the AP trading on the respective arbitrage opportunity for its own account. As ETF shares are always created and redeemed for the value of their underlying assets, it may be profitable for the AP to create (redeem) ETF shares when the ETF price is significantly above (below) the value of the underlying portfolio. Then, the AP would be exploiting an arbitrage opportunity and thereby reduce the inefficiency in the market (by increasing or reducing the respective liquidity in the ETF market). A detailed analysis of APs' profits in share creation and redemption may be part of future research.
This paper is one of the first to empirically analyze Latin American ETFs. Considering the stable economic growth in several Latin American countries like Colombia and the zero-interest-politics in most developed countries, the interest for Latin American ETFs is likely to increase in the future. This paper documents the level of (in)efficiencies in the respective markets and thereby adds to our understanding of market development and depth. Finally, this paper contributes to the literature on ETFs' APs. This paper is - to the best of our knowledge - one of the first to analyze the AP's decision process empirically and to directly link it to market inefficiencies.
Future research on Latin American ETFs is critical. Although our sample encompasses the most representative ETFs in this region, there is a need to an enlargement of the sample in future research. In addition, we need to consider that our key variables (prices and NAVs) were the closing value of each trading day. This information may contain some noise. Therefore, a detailed analysis of intraday data would provide additional insights into the price efficiency and the co-movement of ETF prices and NAVs.