


 English (pdf)
 Article in xml format
 Article references
 Send this article by e-mail
 Cited by SciELO
  Cited by Google
  Similars in
SciELO
Similars in
SciELO  Similars in Google
 Permalink
Introduction
Information systems (IS) are one of the most relevant components in todays' business world. They offer numerous opportunities to those businesses that succeed at taking advantage of their benefits, as they are able to gather, process, distribute and share data opportunely and holistically. In addition, they help bridge the geographic gaps and enable employees to become more efficient, which in turn is reflected in an improvement of the business management and information management processes.
These benefits often create the need for enterprises to rely more on IS for the accomplishment of their daily activities; in consequence, more investment in Information Technology (IT) is encouraged. However, concerns about the world's economic context and progressively global competition exert pressure to reduce them (Derksen & Luftman, 2013); therefore, organizations are required to assess and examine the costs and benefits of this type of technology, in order to secure revenue from the investments made, as positive impact is usually expected by the institution (Gable et ál., 2008).
In addition, the crucial role played by the quality of the IS in the achievement of the business objectives has generated an interest on the part of the academic community in this topic. For example, Medina and Chaparro (2007), studied the main models for the assessment of the impact that IS quality has on businesses' performance. They found that the model proposed by DeLone and McLean in 1992, has been one of the most widely cited. Nevertheless, its application has had an orientation towards the assessment of the impact at the individual level. Similarly, Sabherwal et ál. (2006) and Ferreira and Cherobim (2012) argue that most of the studies on the topic carried out over the past decades have focused on developed countries. Therefore, scholars call for the need to conduct studies beyond those boundaries and include experiences from other countries (Mahmood & Mann, 2000), especially from emerging economies.
In the particular case of Mexico, research on the quality of IS and its influence on organizational performance is still scarce. Therefore, the purpose of this study is to determine the influence of the systems' quality on user satisfaction and perceived benefits, and how these in turn impact on the use of such technologies in small and medium-sized enterprises of the Mexican northeastern region at the organizational level. To achieve that aim, a review of the state of the art related to the dependent and independent variables is first conducted. Then, a research model is examined and tested through the application of the Partial Least Squares (PLS) and Muti-Group Analysis techniques.
After that, survey data are analyzed in order to test the hypotheses. Finally, the main contributions to knowledge are outlined.
Literature Review
Information systems (IS) in an enterprise represent a group of human, hardware and software that is in charge of the organizational information processing through the input, process, storage, output and exploitation of the generated data. Turban et ál. (2013) consider IS highly useful as they provide support for decision making, coordination and control processes; they can also help managers and staff members analyze problems, foresee complex issues and create new products.
In 1992, DeLone and McLean proposed a model to evaluate the level of success and effectiveness of IS. Their motivation to do so was the complex processes involved in identifying and defining IS degree of success (Seddon, 1997). Their results showed that the dimensions of quality are aspects that encourage the use of technology and enhance user satisfaction, two factors that have been identified as positively influencing both individual user's and organization's performance.
The DeLone and McLean (1992) success model is the most widely cited in the IS literature (Gable, 2008; Petter et ál., 2008; Petter et ál., 2013). However, the original model developed in 1992 had to be updated in 2003, as it needed to consider the new technological trends (Rodríguez et ál., 2014): Electronic commerce, virtual reality, singularity, social media, cloud computing, etc. Three main changes were made as part of the model's update. One is the inclusion of service quality as the construct of the model, which is mainly evaluated by SERVQUAL (Gorla et ál., 2010). Another is the replacement of individual and organizational impact variables with the net benefits. And the other was the addition of the intention to use variable, which measures the user's attitude (DeLone & McLean, 2003; Wu & Wang, 2006).
According to Ballantine et ál. (1996) and Seddon (1997), the DeLone and McLean (1992) model makes several contributions to the understanding of IS success. First, it provides a framework for the classification of different success measurements, which have been proposed in the literature. Second, it suggests temporal and causal interdependencies among identified categories. Finally, it offers an appropriate basis for a larger scale empirical and theoretical research project.
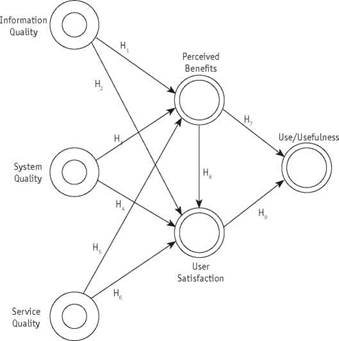
The DeLone and McLean (1992) model is made up of six constructs: Information quality, system quality, service quality, use/usefulness, user satisfaction, and net benefits. In addition, it establishes that the information quality, system quality, and service quality affect the degree of use-perception of usefulness and user satisfaction. It also states that the use and satisfaction are mutually affected and are direct antecedents of the perceived net benefits. Therefore, the model can be applied to any level of analysis that the researcher considers appropriate (Petter et ál., 2008). However, Wu and Wang (2006) argue that the service quality variable should not be considered a determinant element of success, as such construct establishes success rather than being a part of it, and they argue that the perception of usefulness influences user satisfaction and the system's use.
Based on DeLone and McLean (1992) model, the following research model is proposed (figure 1) to determine the applicability in the state of Tamaulipas, Mexico, a country with an emerging economy. Along with the model, the definition and theoretical bases of the variables are presented below.
a) Information Quality
The information quality construct is a critical variable for institutions. Therefore, its definition is an issue that any organization should not overlook. Studies on IS have employed different measurements to assess their effectiveness. DeLone and McLean (2003) use accuracy, opportuneness, completeness, relevance and consistency to assess their IS effectiveness. Bailey and Pearson (1983) employ a series of variables including accuracy, precision, currency, opportuneness, reliability, completeness and conciseness, while Nelson and Todd (2005) have used attributes such as precision, completeness, currency and presentation form.
Wixom and Watson (2001) found that information quality has significant influence on the net benefits perceived by organizations. In an analysis conducted in Mexico, Medina et ál. (2011) argue that this variable positively impacts businesses' competitiveness and productivity; where's Gorla et ál. (2010) show that there is a positive relationship between information quality and organizational impact.
The aforementioned makes evident the argument that a low data quality is reflected in the lack of information quality, which in turn can have a negative impact on the organizational outcomes. In contrast, quality information, in terms of contents, can lead to a high organizational impact, reflected in a global productivity and business processes improvement.
The DeLone and McLean (1992) model suggests a direct relationship between information quality and user satisfaction. In other words, the higher information quality, the more use of the system, the more user satisfaction. In addition to that, various studies have found a significant relationship between both constructs (Rai et ál., 2002; Halawi et ál., 2007). In this sense, Wixom and Watson (2001) and Shin (2003), have found a positive relationship between information quality and user satisfaction. On the other hand, there are studies that do not identify a significant relationship between the information quality and user satisfaction constructs (Marble, 2003).
Based on the reviewed literature, the working hypotheses are now presented:
H 1 : Information quality is positively associated with the IS perceived benefits.
H 2 : Information quality is positively associated with IS user satisfaction.
b) System Quality
In order to assess systems quality, scholars have developed a number of measurements, based mainly on their performance. Swanson (1997) considered that the system quality is based on its trustworthiness, user-friendliness and response promptness. Sabherwal et ál. (2006) define it in terms of reliability, user-friendliness and response timeliness. Gorla et ál. (2010) used two factors, one from a system design point of view (called flexibility) and the other from the final user's perspective (called sophistication). In addition to that, meaningful relationships between system quality and its impact on organizational performance or achieved outcomes have been identified (Gefen, 2000; Wixom & Watson, 2001). Likewise, Bradley et ál. (2006) have demonstrated that system quality is positively associated with the impact on the organization at the operative level in entrepreneurial businesses. Studies have also reported a meaningful relationship between the system quality and user satisfaction constructs (Wixom & Todd, 2005; Sabherwal et ál., 2006).
No doubt, system quality is a central attribute to evaluate the success of an IS, which makes it a valuable element within an organization. The study of it provides invaluable information for executives, developers and users, as an efficient and effective system enables them to achieve their planned objectives. In this context, the following hypotheses are now presented:
H 3 : System quality is positively associated with the IS perceived benefits.
H 4 : System quality enhances IS user satisfaction.
c) Service Quality
The quality service variable has been defined as the degree of difference between the customers' expectations on the service and their perceptions about their performance (Gorla et ál., 2010) and which delivery requires three levels of action (strategic, tactic and operational) constantly (Watson et ál., 1998). Bailey and Pearson (1983) indicate that service quality within the IS should be measured through the technical competence, attitude and the meeting of deadlines as well as the adequacy of timeframes for its development on the part of the systems' staff (informatics). Other measures of service quality have included ability, experience and staff capabilities (Yoon & Guimaraes, 1995). Petter et ál. (2008) evaluate it through the response capability, precision, trustworthiness, technical competence and staff empathy.
With regards to its relation, Gorla et ál. (2010) have found that service quality influences positively and significantly on organizational performance. Regarding service quality and user satisfaction, Halawi et ál. (2007) identified significant relationships between the two variables. In this sense, Chen et ál. (2000) have found a positive correspondence, while Choe (1996) did not find a significant relationship between the constructs.
It is important to recognize that small and medium-sized enterprises are an important part of the Mexican economy; however, in this country, Olliver (2007) detected the strong inequality that exists in the technological levels of the administrative process among micro, small, medium and large companies. In consequence, if a business employs experts in IT with business management skills, kindness and an understanding of specific user needs, making them feel satisfied, generate innovation, improves internal efficiency or high productivity, then, these experts can lead to better outcomes. Therefore, the following hypotheses are outlined:
H 5 : Service quality is positively associated with the perception of the IS benefits.
H 6 : Service quality is positively associated with IS user satisfaction.
d) Perception of Information Systems Benefits
The perception of the benefits of an IS has been defined by Wu and Wang (2006) as the extent to which a user believes that he/she or the organization will benefit from the results of the system. For their part, Gorla et ál. (2010) state that the very benefits received by a business from the use of IS are the perceived benefits at the organizational level. While there is little agreement regarding appropriate ways of evaluating (objectives or perception) the benefits at the organizational level, the assessment based on perceptions has been adopted as an important substitute to determine the success of IS (Wixom & Watson, 2001; McGill & Hobbs, 2003).
Based on the above, it may be explained by the intangible nature of their impact and the fact that they are also influenced by other external variables (Ferreira & Cherobim, 2012). Nevertheless, Wu and Wang (2006) suggest that the perceived IS benefits may influence user satisfaction given that the individual or organizational net benefits can lead to user satisfaction, rather than the other way around.
e) User Satisfaction
User satisfaction is one of the most widely used measurements to assess the success of an information system, and some researchers have used it for a long time now such as Bailey and Pearson (1983) and Ives et ál. (1983). DeLone and McLean (1992) included 33 articles that address the user satisfaction topic in their studies. They concluded that such measurement is widely used to assess IS success, as the instruments are highly reliable.
Some researchers sustain that the system use leads to user satisfaction. Others claim that user satisfaction leads to the system's use (Bokhari, 2005), due to the way of assessing the system use, in which its nature, scope, quality and adequacy are not reflected. In a similar vein, Wu and Wang (2006) propose that user satisfaction influences the system use, as a positive attitude towards the system is reflected in the use of it. The results of the study support this argument given that they found that user satisfaction has a positive and significant effect on the system use variable.
No doubt, user satisfaction has been a widely studied topic by researchers. However, most of these analyses have been conducted in particular contexts. Therefore, there is a consensus in most of the studies reviewed in the literature which state that more studies of the construct are needed, especially in other contexts, given the complexity and multidisciplinary of the concept.
f) Use / Usefulness
The use of information systems plays a central role in determining their effectiveness. The use variable is referred to as the inclusion of information generated by the system in the user's decision-making process (Cheney & Dickson, 1982). On the other hand, effectiveness is assessed by the use made of the information provided by the IS, expressed in terms of user satisfaction and decision-making quality (Serafeimidis, 2002).
The use of IS is considered a practice that reflects expectations about the potential net benefits that can be obtained from such use, providing a behavioral outcome of the information system success (Rai et ál., 2002). However, one of the most serious issues raised is whether the way in which the system is tested will be the same during its actual use and operation (Jeske & Zhang, 2005). If the user considers an information system as unreliable and inaccurate, such mistrust will be reflected in its use (Ives et ál., 1983). Nevertheless, the more satisfied the user is with the system, the more reliable the system becomes (Rai et ál., 2002). This variable has been frequently used by researchers as a benchmark to assess the level of IS success (DeLone & McLean, 1992) and to determine the benefits of technology. However, when used in isolation, it can not thoroughly assess success (DeLone & McLean, 2003). In addition to that, the use of it can precede the user satisfaction in a process sense, but a positive experience with the use of the system leads to satisfaction in a causal way. Similarly, user satisfaction can increase the intention to use and the actual use (DeLone & McLean, 2002).
With respect to the perception of the IS benefits and its influence on the system use variable, Roldan and Leal (2003) mention that an IS does not contribute to performance if it is not being used, and that it will only make a contribution if it is adequate and fully used. Likewise, Tait and Vessey (1988) also emphasize the idea that an IS will only be perceived as successful when its use increases or when its user satisfaction increases with the information he/she receives from it.
Yet, for an appropriate assessment of the system use variable, it needs to be analyzed from a relevant point of view. In other words, it needs to allow the assessment of the impact of the effective system use on user satisfaction or on the perceived benefits of IS, rather than as an average of the time used only. In the section below, the following hypotheses are proposed:
H 7 : The perception of the IS benefits is interrelated with the use/usefulness of the IS.
H 8 : The perception of the IS benefits is interrelated with user satisfaction.
H 9 : User satisfaction is positively associated with the use/usefulness of the IS.
Method
Operationally, the study sets out to analyze the degree of IS success in businesses of the state of Tamaulipas, located in the northeastern region in Mexico. The operationalization of the variables was as follows:
Information quality: Thorough, opportune (on time), useful, relevant, with good appearance and format (adequate design), easy to understand and interpret (self-explanatory design). In addition to that, its reports should be comparable among its different output formats (print-screen) (DeLone & McLean, 1992, 2003; Wixom & Watson, 2001; Nelson et ál., 2005; Petter et ál., 2008; Gorla et ál., 2010; Medina et ál., 2011).
System quality: Designed with useful features, with adequate response time, user-learner friendly, with an appropriate level of integration (Swanson, 1997; Seddon, 1997; Wixom & Watson, 2001; DeLone & McLean, 2003; Sabherwal et ál., 2006; Bradley et ál., 2006; Gorla et ál., 2010).
Service quality: It is measured through aspects related to response capability and the intention is for the variable to assess the extent to which the IT support staff provides users with the elements and adequate information services (Carr, 2002; Bradley et ál., 2006; Medina and Chaparro, 2007; Gorla et ál., 2010).
Perception of IS benefits: Perception in sales increase, market toll, productivity, improvement of processes, operation management capability, or in the lowering of operation and staff costs (Gable et ál., 2008; Gorla et ál., 2010).
User satisfaction: It is evaluated by the way in which the user feels after using the information system (confidence); if he/she perceives it as efficient, effective, and meeting his/her needs (Medina et ál., 2011; Wu & Wang, 2006).
System use/usefulness: The extent to which the user feels that with the help of the system, he/she is performing his or her functions faster, improves his or her job performance, increases his or her productivity, enables him or her to make better decisions and finds it useful for job-related activities, rather than just measuring it through overall use, average use or average time use at a time (Medina & Chaparro, 2007; Wu & Wang, 2006).
The questionnaire was composed of 38 five-point Likert scale items (1. Strongly disagree to 5. Strongly agree). For its application, the records provided by the Mexican Entrepreneurial Information System (SIEM, in Spanish: Sistema de Información Empresarial Mexicano, http://www.siem.gob.mx) were consulted. As of September 2016, in the state of Tamaulipas, 649 businesses met the criterion established by the present study (to have at least 10 employees and belong to the commerce or service sector). Once the businesses were identified, access to them was given by formally requesting authorization from their corresponding Chambers and Associations of Commerce and Service to be able to administer the instrument there.
The field work was conducted through a convenience sampling strategy, leaving out those enterprises that do not have an IS in operation. Data collection took place during the last bimester of 2016 when the participating enterprises were visited. The key informants were either the head manager or accounting manager, as they met the target profile, which includes having access to information related to business management processes and IT knowledge (Ferreira & Cherobim, 2012). They were fully informed of the nature and objectives of the study. The sample for the study was made up of 169 businesses from the commerce and service sector.
Findings
First, an analysis of the descriptive data is provided. Of the businesses that completed the questionnaires (cities of Tamaulipas): 15% are located in Reynosa, 15% in Nuevo Laredo, 15% in Matamoros, 15% in Ciudad Victoria, 14% in Tampico, 9% in Ciudad Mante, 9% in Ciudad Madero and 8% in Altamira. The firms were 62% of Commerce and 38% of Services.
With regards to the time they have been in the market: Less than a year - 4%, from 2 to 5 years - 17%, from 6 to 10 years - 21%, from 11 to 15 years - 17% and 16 years or more - 41%. Regarding the number of employees in the analyzed businesses, from 11 to 30 employees - 64%, from 31 to 50 - 15%, from 51 to 100 - 10% and from 101 to 250 - 11%. With respect to the number of years they have been using IS: Less than a year - 7%, from 2 to 5 - 22%, from 6 to 10 - 27%, from 11 to 15 - 16% and 16 years or more - 28%.
Next, the analysis of the proposed model was carried out with the tool Partial Least Squares (PLS) version 3.2.7 (Ringle et ál., 2015), and the followed process consisted of three stages: Estimation of the measuring model, estimation of the structural model and finally a Multi-Group Analysis (MGA).
To evaluate the measurement model in PLS, one must first examine its two types of validity: The convergent and the discriminant. Initially, a convergent validity analysis was carried out, which is generally determined by examining the loads, the average variance extracted (AVE) and the composite reliability. For individual reliability (loads), it is established that to admit them, their factorial load must be superior to 0.707 (Hair et ál., 2017). The results are shown in Table 1 and it can be inferred they are above the established threshold, in the same way, values were obtained above 0.7 for the composite reliability (pc) and the Cronbach's Alpha (a), meanwhile, the AVE of every construct was higher than 0.5 as suggested in the literature.
Table 1 Individual Reliability of item loading and convergent validity of Coefficients
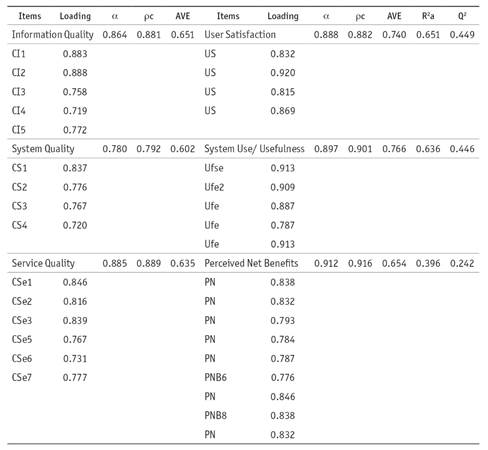
Source: Own elaboration.
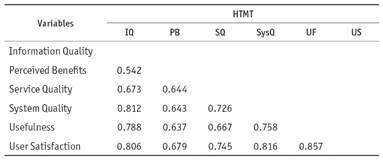
Now, the calculation of the discriminant validity of the proposed constructs in the model was through the Heterotrait Monotrait Ratio (HTMT) method, which is considered more accurate than the Fornell-Larcker test (Henseler et ál., 2015), the results obtained are shown in Table 2 and as it is observed all are within the acceptable threshold (less than 0.85).
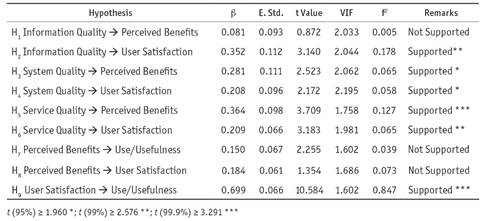
Before proceeding to test the structural model, its approximate adjustment was first verified, for which the Standardized Root Mean Square Residual (SRMR) was applied, which is defined as the discrepancy of the correlation observed and the implicit model, then, lower values to 0.08 are considered adequate (Hu & Bentler, 1998). The result obtained for this indicator was 0.069, which allows establishing that it has an adequate level of adjustment. Once verified that the SRMR index is adequate, we proceeded to calculate the structural model analyzing the variance explained (R2), the standardized path coefficients (β) and their significance, for this we used the Bootstrap technique of 5000 sub-samples; the minimum required for final results (Hair et ál., 2017). The obtained with respect to the analysis of the variance explained (R2) and the predictive relevance of the model (Q2) can be seen in Table 1, while Table 3 shows the values reached for the path coefficients and the effects of each relationship (f2).
Finally, an analysis of multiple groups was carried out to test the possible influence of the sector to which the companies belong in the relationships included in the proposed research model. Therefore, first, the sample was divided into two groups (commerce and services). To then apply the three-step procedure that allows analyzing the measurement invariance of composite models (MICOM) (Henseler et ál., 2016), its establishment will guarantee that the effect of the sector is restricted to the path coefficients of the structural model, and not to the parameters of the measurement model (Felipe et ál., 2017) and as detailed in Table 4, it was possible to reach it completely in both groups, therefore, one can continue with the next step, which is to determine if there are differences between the groups or not.
Table 4 Results of the measurement invariance of the composite model procedure
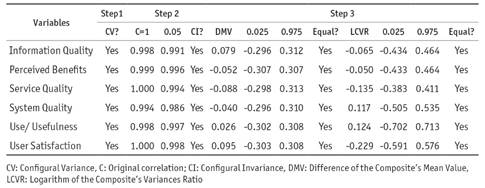
Source: Own elaboration.
For this, the permutation test is first performed where a value of p < 0.10 suggests that the discrepancy between the path coefficients of the group is statistically significant (Hair et ál., 2018). However, in order to provide an additional confidence analysis the non-parametric MGA method was applied for its estimation a p-value lower than 0.05 or higher than 0.95 indicates significant changes (Henseler et ál., 2009), both results are showed in Table 5.
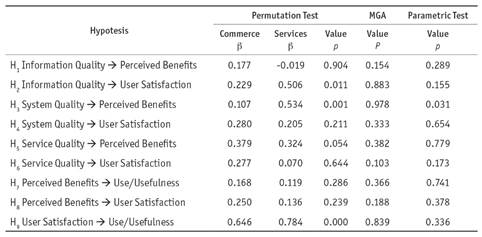
Regarding the analysis of groups performed, Table 5 shows that there are no significant differences between what is perceived by the commerce and service companies, there are only differences between the relationships: System Quality and Perceived Benefits (H3) since their significance (p-Value) is less than or equal to 0.10. However, the other suggested hypotheses can not be supported.
The inferential statistical analysis revealed that six of the nine hypotheses were accepted with a 65% explained variance, which makes evident the model's acceptable predictive power. For the following hypotheses testing, Tables 4 and 5 and Figure 2 are considered: While the Figure 2 shows the explained variance (R2) in the dependent constructs and the trajectory coefficients (p) for the model.
With respect to Information Quality with Perceived Benefits (H1, hypothesis is rejected, as it does not meet the minimum statistical parameters required), the results are dual; on one hand, the users perceive that getting prompt, updated, useful, relevant, accurate, detailed and easy to interpret information does not allow them to obtain tangible benefits such as costs reduction (commercialization, customer relation, suppliers or inventories). In addition to that, such information does not help them become aware of customers' needs, make better selection of suppliers, improve the internal efficiency (meetings, decision-making, coordination of departments or strategic planning), results improvement, capacity building (sales increase, market niches, finance management, expenditure reduction, profitability, productivity and business processes). On the other hand, Information Quality with User Satisfaction (H2 is accepted). They view such information quality as a reliable source for IS user satisfaction in terms of getting information according to their needs, efficient and effective systems, and the support they get to make more informed and timely decisions.

The System Quality with the Perceived Benefits (H3 is accepted). Users perceive that the IS is easy to use, user-friendly, reliable, accessible, easy to adapt to their needs, fast and compatible with other systems operating in the institution, which enables them to lower the costs, get to know their customers' needs, better select their suppliers, improve internal efficiency, improve their results and build capacity. Regarding User Satisfaction (H4 is accepted). Users perceive a psychological-state wellbeing when making use of the institutional IS.
As for the Service Quality offered by the IT staff for the achievement of IS Perceived Benefits (H5 is accepted). Users feel that having staff members committed to problem solving, keep their service promises, meet attention deadlines, are fast, trustworthy and have adequate informatics knowledge. This allows them to generate the aforementioned benefits. Furthermore, H6 (User Satisfaction) was also accepted. In other words, users trust the informatics staff members, who have always been concerned with providing adequate and quality services. Such trust in turn helps them to develop a sense of satisfaction.
The data above help determine the moderator constructs: The user satisfaction variable has an explained variance of 64.5%, which is an important predicting factor, according to Chin (1998). On the other hand, the Perceived Benefits only achieve 38.2%, which suggests that the improvement of IS overall quality is required. Similarly, the proposed correlation between the two variables (H8) is rejected, as the Relation (0.184) does not meet the minimum value, as recommended.
Meanwhile, the findings obtained of the Use-usefulness variable defined as a dependent variable of the moderator ones, allow us to confirm that the Perceived Benefits by the users are not encouraging enough for the information systems' use and usefulness (H7 is rejected). Overall, such variable does not enable them to do their job faster, to improve their job performance, increase their productivity or effectiveness. In general, they do not consider it useful in the model. In contrast, H9 is accepted, with a higher degree of Relation (0.699) in the model and with a high significance (p < 0.001). In other words, the users feel personally satisfied with the use and usefulness this technological tool provides.
Finally, with respect to the groups analysis performed, the results shown in Table 5 indicate that only in the relationship between system quality and perceived benefits is there a significant difference (p < 0.10) between what is perceived by the commerce enterprises and those of services, in this sense, the other suggested hypotheses can not be supported. The difference detected in both economic sectors allows us to deduce that, if the information systems had better quality in their technical performance, their perception would improve and therefore a feeling of greater utility would be generated when using it both, individually and organizationally.
Conclusions
This research analyzes the degree of influence of the IS quality (information, system, and services) on the perceived benefits and satisfaction with the IS use in the context of an emerging economy, and its respective multi-group analysis; particularly, in small and medium-sized enterprises of the commerce and service sectors, in the main cities of the state of Tamaulipas, Mexico.
In the first instance, the Multi-Group Analysis showed that the difference detected in both economic sectors (commerce and service) allows us to conclude that, if the systems had better quality in their technical performance, their perception would improve and therefore a feeling of greater utility would be generated when using it both, individually and organizationally.
The literature consulted suggests that information is an important factor for organizations in Tamaulipas, Mexico. However, the data analysis made in the enterprises consulted, both globally and by groups (commerce-service enterprises) reveals areas of opportunity because no adequate mechanisms have been established so that it can be utilized systematically, not only as a response to an immediate need created by the market to generate a greater added value and clearly obtain all possible benefits such as sales increase, more market niches, process improvement, productivity increase, costs reduction and a better management of the economic, material and human resources. The overall goal is to create a virtuous circle by encouraging its users to use it more effectively and developing a competitive advantage for a considerable period of time. In addition to that, it is necessary to create the conditions, so that information users can develop a sense of satisfaction, which is only achieved through the use of quality information, which in turn leads to a higher level of IS use truly becomes useful, both personally and organizationally.
An encouraging component is the positive perception that IS users have regarding the system quality (useful, reasonable response time, data integration). By having this element, the users believe that it brings them organizational benefits and personal satisfaction; and therefore, they make greater use of it and develop a perception of its practical usefulness. Nevertheless, considering the rapidly changing technological context, the IT staff should be constantly updating their IS and adapting them to the new realities, especially because of the Internet revolution and the massive use of mobile devices since they are no longer the future, but the present. As was evident above, this is temporal, and so a constant and permanent IT and IS innovation approach is needed, especially due to the Internet revolution and the massive use of mobile devices, since they are no longer the future, but the present.
Regarding Service Quality, this is a topic that has been the target of a great deal of criticism. However, this is ultimately an essential element within the IS operational framework. Undoubtedly, the IT staff's willingness to support the users becomes fundamental for the achievement of the organizational objectives and their satisfaction with this tool. Nevertheless, a greater degree of commitment from the staff is required as the users do not view it as a means to achieve a greater level of IS use and do not perceive it quite useful. Therefore, it is imperative to assess all the activities performed and to consider i) users' participation in the acquisition or development of the software, ii) the executives' active participation, iii) adequate planning, iv) effective training, among other factors.
Finally, one of the issues that the business needs to carefully address is the lack of user satisfaction regarding the perceived benefits, situation that occurs in both sectors consulted (Table 5). The main concern has to do with the large amounts of money that is being invested in information technology / information systems and the poor results obtained from that. This is mainly due to the inadequate use that the users make of these technologies or the perception they have of their little or lack of usefulness. If a company spends on an IS that is underused or does not support the business objectives, then it can be considered a bad deal.

