


 English (pdf)
 Article in xml format
 Article references
 Send this article by e-mail
 Cited by SciELO
  Cited by Google
  Similars in
SciELO
Similars in
SciELO  Similars in Google
 Permalink


1. Introduction
The chemistry of carbonates in seawater is being altered by the increase in atmospheric carbon dioxide (CO2) produced by human activities, mainly C O 2 , by the combustion of fossils and changes in land use. As part of the carbon cycle the ocean absorbs from the atmosphere CO2 and this is key in mitigating climate change. However, the accelerated increase in the atmosphere has been causing the increase of dissolved CO2 in the ocean, causing the alteration of the carbon cycle and, consequently, the phenomenon known as ocean acidification (AO). AO alters seawater chemical speciation and biogeochemical cycles. One of the studied effects of AO is the reduction of calcium carbonate saturation states affecting calcifying organisms (Feely, et al., 2004), but it is unknown whether marine organisms will be able to adapt to the increase in CO2 in the ocean (Doney et al., 2008 and citations therein). Therefore, it is imperative to thoroughly investigate and understand the absorption of carbon in the ocean to generate a guide that serves authorities in the design of climate change mitigation and adaptation policies (ONU, 2021).
Coastal environments are important sources of primary and secondary production, provide ecosystem services and provide livelihoods and income to coastal communities (Zea & Espada Gómez-Lor, 2020; Duarte et al., 2013). However, the traditional potentiometric method for the determination of pH use for calibration standards prepared in deionized water and are reported in NBS scale (National Bureau of Standards), standards with ionic strength very different from that of seawater. Currently for AO studies the pH is reported in seawater scale (pHSWS) or in total scale (pHT) which use standards with ionic strength of seawater and consider the influence of its additional ions (Mosley et al., 2004).
In Colombia, little research has been conducted on AO and its effects on marine organisms (Gonzáles-Güeto et al., 2021; Paiba, 2016; Rojas-Higuera & Pabón-Caicedo, 2015). Particularly, there is research that establishes the long-term trend of OA using pH measurements on an NBS scale (Rojas-Higuera & Pabón-Caicedo, 2015), whose results do not meet the recommendations established by Dickson et al. (2007). Knowing that the potentiometric method is the most common and fastest method to determine pH, and that the different scales for measuring pH in seawater have generated confusion (Stoica et al., 2021; Zeebe & Wolf-Gladrow, 2001), it was considered relevant to present in this article a knowledge base about the carbonate system, pH, pH scales and the potentiometric method, with the purpose of helping the uninitiated to understand and interpret the study of OA in Colombia. In fact, in this country a pH decreases of between 0.1020 and 0.1059 is projected by the year 2100 for the intermediate scenarios of greenhouse gas emissions (IDEAM et al., 2017).
The artificial coastal lagoon La Escollera located in Santa Marta, Colombian Caribbean, has been used as an open-air laboratory for the study of physical, chemical, and ecological processes, to understand and model the behavior of coastal ecosystems. These studies are carried out through measurements of physicochemical variables such as pH, temperature, salinity, dissolved oxygen, sea level and light penetration. The intention of this study is to try to understand the variation of the carbonate system associated with the processes of respiration and photosynthesis in the lagoon La Escollera. For this reason, it began with the implementation of a method that allows to obtain values of pHT from the time series of ionic potential and temperature measured in the lagoon.
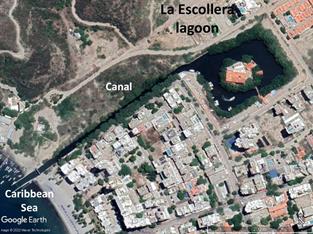
La Escollera, (11°12'32.83'' N, 74°13'31.68 W) is a private marina with an island in the center and a channel connecting it to the sea (Fig. 1). Itis located at the northern end of Gaira Bay, in the El Rodadero sector, Santa Marta (Colombia); it was excavated in the mid-1980s, and around 1985 mangroves were planted on its edge and in the canal. At present, mangroves are well developed and preserved, and their roots being home to a varied fauna and flora (Zea & Espada Gómez-Lor, 2020). The lagoon has a rectangular shape with approximate dimensions of 167*133 m (including the edge of the mangrove), and the channel, which is its only communication with the sea, is 400 m long and 9-13 m wide (Fig.1). The lagoon does not have permanent inflows of fresh water, but it has two drains from the surrounding streets that collect the runoff from the neighborhood and the adjacent hills. Sewage is not discharged directly into the lagoon, but in rainy or tourist seasons there are over spills that reach it (Zea & Espada Gómez-Lor, 2020).
2. Frame of reference
2.1. Carbonate system
CO2 dissolves in seawater by a series of chemical reactions, which can be represented in equilibrium as shown below:
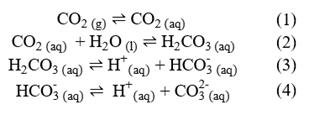
In these chemical equations (g), (l) and (aq) refer to the state of the species, i.e., gas, liquid, or aqueous solution, respectively. Distinguishing between CO2 (aq) and carbonic acid H2CO3 (aq) species is difficult analytically, so they are usually expressed hypothetically as
 , which equals the sum of both concentrations
 (Dickson et al., 2007).
Redefining equations 1, 2 and 3 in terms of

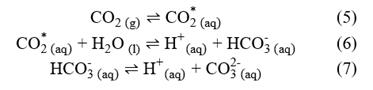
Chemical equilibrium relationships can be written in terms of equilibrium constants as follows:
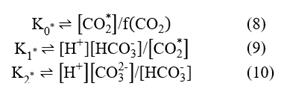
Where f(CO2) is the fugacity of carbon dioxide in the gas phase; and K1*and K2* are the equilibrium constants that are often referred to as the first and second dissociation constants of H2CO3. Stoichiometrically, these equilibrium constants are functions of the temperature, pressure and salinity of the solution and have been defined at different pH scales (Zeebe & Wolf-Gladrow, 2001; Dickson et al., 2007; Millero, 2010). The square brackets represent the total stoichiometric concentrations of substances, denoted as moles per kilogram (mol/kg) of solution. The total stoichiometric concentration of a species is the sum of the concentrations of the free species itself, together with the concentrations of all complexes formed between that species and the ionic components of the medium (for seawater: H2O, Na+, Mg2+, K+, Ca2+, Cl- and SO4 2-) (Dickson et al., 2007).
The carbonate system can be determined quantitatively from Equations 9 and 10, whose unknowns are
 and
and
 . In summary, there are two independent equations and 4 unknowns and, therefore, to solve the system you must at least solve two unknowns or include other equations. It is possible to solve the system by measuring directly two or more of the four variables of the carbonate system; these are: the partial pressure of carbon dioxide p(CO2), dissolved inorganic carbon (DIC or CT), total alkalinity (TA) and pH. The choice of these variables will depend on the materials, and equipment available to each laboratory (Zeebe & Wolf-Gladrow, 2001; Dickson et al., 2007). Next, the sample variable of this study, the pH, is defined.
pH is a measure of the total stoichiometric concentration of hydrogen ions in a solution and is defined as:
The brackets correspond to the total stoichiometric concentration, which in the case of the hydrogen ion implies the sum of the hydrogen ions together with the complexes that are formed between it and the ionic components of the solution. Hydrogen ions are not present in a significant amount in aqueous solutions, as these bind with water to form the hydronium ion (H3O+) (Zeebe & Wolf-Gladrow, 2001). Particularly, in seawater hydrogen ions form complexes with water (H3O+), with the sulfate ion to form the hydrogen sulfate anion (HSO4-), and with the fluoride ion (Dickson et al., 2007). It is also possible that they interact with other ionic compounds that have not yet been identified or that their effects are so small that they can be neglected.
pH makes it possible to study two processes of global importance: 1) Ocean acidification caused by the absorption of carbon dioxide (CO2), and 2) Biogeochemical processes that are related to the production or mineralization of organic matter and therefore to the absorption and release of CO2. It is therefore important to have accurate and traceable measurement methods to determine this variable (Müller & Rehder, 2018; Rérolle et al., 2012).
pH measurements require primary buffer solutions with well-defined and traceable pH values that guarantee the reliability of the measurements (Müller et al., 2018b), since pH scales are established based on these measurements. The NBS pH scale established by IUPAC (International Union of Pure and Applied Chemistry), is defined by a series of standard buffer solutions with an assigned pH value, prepared in water free of impurities. The ionic strength of standard NBS buffer solutions is about 0.1; while the ionic strength of seawater is about 0.7. This difference affects the correct measurement of pH in seawater due to changes in the binding potential between calibration and sample measurement when potentiometric methods are used. Therefore, the NBS pH scale is considered inappropriate for studies of seawater samples (Zeebe & Wolf-Gladrow, 2001; Müller et al., 2018b).
To improve the accuracy of pH measurements of marine samples, standard buffer solutions based on seawater composition have been developed, that is, from standard formulations of synthetic seawater (ASW "artificial sea water") with approximately the same ionic strength and salinity of natural seawater. This ensures that the effective activity is similar between both solutions and therefore the pH measurement is more reliable and accurate (Zeebe & Wolf-Gladrow, 2001; Paulsen & Dickson, 2020). The pH scales established from ASW are the total scale p H T , the free scale p H F and the seawater scale pHsws.
Before defining the scales, it should be remembered that in seawater hydrogen ions form complexes with water (H3O+), the sulfate ion
 , the fluoride ion and other compounds.
Free scale (pHF): it only considers the concentration of hydrogen ions that form complexes with water.
Where [H+]F is the concentration of free hydrogen ions, that is, the concentration of hydrogen ions that only form complexes with water.
Total Scale (pHT): it considers both complexes formed by water and complexes formed with sulfate ions.
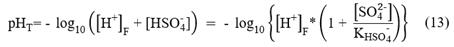
Where, K is the dissociation constant of hydrogen sulfate
 .
.
Seawater scale (pHSWS): it estimates the concentration of hydrated hydrogen ions, complexes formed by sulfate ion and fluoride:

During the determination of pH in seawater it is important to define coherently the first and second carbonic acid dissociation constants (K1*and K2*) according to the chosen pH scale. Otherwise, a serious error will be made in the calculation of the carbonate system (Zeebe & Wolf-Gladrow, 2001; Millero, 2010).
Some of the methods available to measure pH are potentiometric, spectrophotometric and of luminescence. Potentiometrics include glass electrodes and ion-sensitive field-effect transistors (ISFETs) (Rérolle et al., 2012; Müller & Rehder, 2018). Although pH spectrophotometric measurements are more precise and accurate (Müller et al., 2018a), potentiometric measurements offer advantages in terms of portability and easy implementation in field studies. They are also suitable in many investigations in which less precision is required, so it is likely that they will continue to be used in the future (Easley and Byrne, 2012). These methods are appropriate for identifying relative spatial patterns or short-term variations in marine systems, if they meet the standard uncertainty of 0.02 proposed by the Global Ocean Acidification Observation Network (GOA-ON) (Paulsen & Dickson, 2020 and citations therein).
2.2. pH measurement: potentiometric method
2.2.1. Glass electrodes
Glass electrodes for pH measurement consist of an indicator electrode, whose potential is sensitive to the pH of the sample, and a reference electrode, whose potential is known and independent of the sample. These devices measure the potential difference between the indicator and reference electrode according to the Nernst equation (Mettler Toledo AG, 2007; Paulsen & Dickson, 2020), as follows:
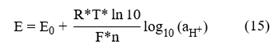
Where R is the universal constant of gases, F is Faraday's constant, T is the temperature (K), n is the charge of the ion, which in the case of the hydrogen ion is +1; E is the measured potential difference in the solution; E0 is a function of the binding potential EJ. Internal potentials and a series of unknown constants such as those linked to the construction of the electrode, being thus different in each manufactured equipment; and
 is the activity of the hydrogen ions (Faculty of Exact and Natural Sciences, 2003; Mettler Toledo AG, 2007; Bier, 2018; Paulsen & Dickson, 2020).
The Nernst equation states that the measured potential (E) depends on
 , which is dimensionless. However, to calculate the carbonate system in seawater, the total stoichiometric concentration of hydrogen ions expressed in moles/kilograms of solution is needed ([H+]). [H+] is related to
by means of the activity coefficient
, which is dimensionless. However, to calculate the carbonate system in seawater, the total stoichiometric concentration of hydrogen ions expressed in moles/kilograms of solution is needed ([H+]). [H+] is related to
by means of the activity coefficient
 (Paulsen and Dickson, 2020) from the expression
=
[H+].
is a function of salinity and solution composition, therefore, to approximate
to [H+] and ignore
(Paulsen and Dickson, 2020) from the expression
=
[H+].
is a function of salinity and solution composition, therefore, to approximate
to [H+] and ignore
 , it must be ensured that the composition of the sample and the composition of the standard buffer are similar. In addition, this condition also minimizes the effect on the electrode potential difference (E) caused by the binding potential (EJ). Ideally, EJ should be very small and constant (Paulsen and Dickson, 2020).
pH can be determined by the Nernst equation if the electrode exhibits nernstsian behavior. That is, the electrode exhibits a linear relationship between the electrode potential and the pH. The slope of this linear relationship is called the Nernst slope
 and is used as a factor to convert the measured potential (E) into pH (Paulsen and Dickson, 2020). The nernstian behavior varies with the time of use of the electrode, and thus it is important to verify it constantly by means of calibration. Dickson et al. (2007) recommend discarding the electrode when it presents on a slope greater than 0.3 % of the theoretical Nernst slope.
The potentiometric method requires buffer solutions for calibration; the widely accepted primary standard for seawater is the TRIS buffer prepared in ASW, which has been shown to be reproducible and stable over a one-year period (Nemzer & Dickson, 2005). The pHT of the TRIS buffer (0.04 mol/kg-H2O TRIS + 0.04 mol/kg-H2O TRIS-HCl) was characterized by DelValls and Dickson (1998) in the salinity range of 20 to 40 and temperature range of 273.15 K to 318.15 K, as follows:
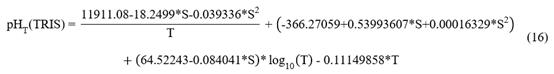
Where S is the salinity, T is the temperature (K) and pHT(TRIS) it is the pHT of the TRIS buffer.
3. Materials and methods
3.1. In situ recording of temperature, potential, pH, salinity, and dissolved oxygen
Temperature, ion potential (EX) and pHNBS lagoon temperature were measured in situ with a HOBO® MX2501 submersible electronic logger (Onset Computer Corporation, Bourne, MA, USA). The logger was calibrated with standard buffer solutions (for NBS scale) of pH 4.01, 7.00 and 10.00, provided by the equipment manufacturer (HOBO MX 2501 does not allow to be calibrated in standard solutions of other scales), to verify that the electrode had a nernstian behavior. Salinity was measured with a HOBO U2400-C conductivity logger and dissolved oxygen with a HOBO® U26-001 logger. Salinity was used to correct oxygen values. Each logger was placed inside protective PVC housings with holes, which favor the circulation of water and partially prevent fouling. They were each tied to 3/4" PVC pipes, and a floating foam was inserted into the top of the pipe. Each PVC pipe with the logger and housing was inserted into a 3/8" iron rod buried on the outer side of a pier on the southeast side of the lagoon (11°12'32.8'' N, 74°13'30.2''W). Thanks to the float, the system pivots on the rod and the sensors always remained at the same level (about 0.4 m deep). For more details of the installation of the equipment, consult Zea & Espada Gómez-Lor (2020). The loggers took measurements every 30 minutes; they were retrieved approximately every two weeks, when they were taken to the laboratory for washing, measuring reference standards (dirty, to detect drifts and other problems), downloading and processing the data, and reprogramming for a new deployment, about 3 to 4 hours later. Each measurement period was called "implementation."
3.2. Calculation of pH t From potential measured in situ
To obtain pH T in situ values, the expression of Bates & Guggenheim (1960) was used, in which the pH T of the sample X is related to that of the TRIS buffer through its potentials (all variables must be determined at the same temperature), such as follows:
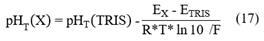
Where R, ln10 and F are known constants. pHT(TRIS) it is the pHT of the TRIS buffer; pHT(X) it is the pHT of the sample; EX is the potential measured in the sample and ETRIS is the potential measured in the TRIS buffer. With the HOBO MX2501 sensor, the values of EX and T were measured in situ at La Escollera lagoon. pHT(TRIS) is known in the temperature range of 273.15 to 318.15 K (characterized by DelValls and Dickson, 1998; see Equation 16), and therefore, it is possible to estimate its value at in situ temperatures.
The potential ETRIS was determined experimentally by measuring it in the laboratory with the HOBO MX2501, and its variation in response to temperature changes. A standard TRIS solution of 0.04 mol/kg-H2O TRIS + 0.04 mol/kg H2O TRIS·HCl, prepared in ASW at a salinity of 35, corresponding to lot T27 bottle 001 (SCRIPPS Institution of Oceanography, La Jolla, CA, USA, co2crms@ucsd.edu), was employed. ETRIS was measured in the temperature range of 288.95 to 304.00 K (15.80-30.85 °C). The procedure was as follows: a thermostatic bath was used with recirculation connected to a 100 mL double-walled borosilicate glass. The thermostatic bath was brought to an initial temperature above 304.00 K (approximately 304.30 K); then, the TRIS buffer was added to the borosilicate glass beaker until the glass electrode and temperature sensor of the HOBO MX2501 were completely submerged. When taking the aliquot of the TRIS buffer solution, a syringe that is connected to a Tygon® conductive tube was used. Subsequently, the borosilicate glass cup was covered, together with the sensor end of the HOBO MX2501 logger, with Kimwipes® fiber-free paper. When the top temperature recorded by the HOBO MX2501 in the TRIS buffer was constant, cooling was started, and the values of ETRIS were written down each time the solution decreased approximately 0.2 ºC. The recording of the experiment data was done manually from the display the HOBOmobile® APP on a cell phone screen, in the status mode of the logger. However, as the recording intervals can be programmed in the logger (HOBO, 2018), it is recommended to schedule the storage of the data in an interval that depends on the rate of temperature change of the thermostatic bath. It is important that measurements of EX and ETRIS are made with the same electrode, as it is known that these have different response times (Mosley et al., 2004), which can be attributed to differences in the manufacturing process. Specifically, it is important to periodically repeat the ETRIS experiment due to the wear of the electrode. The laboratory equipment and reagents were provided by the Environmental and Marine Quality Laboratories Unit (LABCAM) of the Instituto de Investigaciones Marinas y Costeras "José Benito Vives de Andréis" (INVEMAR).
With the experimental data, the parameters of the linear regression equation between ETRIS and T were calculated, to enter ETRIS as a function of the temperature in situ in Equation 17. For some of the temperatures that were higher than the experimental interval (the maximum temperature recorded for the study period was 32.43 °C), the value of was extrapolated. In addition, for the calculations of Equation 17, it was assumed that the lagoon has a constant salinity of 35, which is that of the TRIS solution. However, previous work has shown that the use of the salinity 35 buffer for samples with salinities between 33 and 37, or differences in 10 salinity units, produce errors in pHT of 0.005 units (pHT Dickson et al., 2017 and citations therein) or 0.028 units (Easley & Birne, 2012). To qualitatively evaluate the importance of this error in this study, the behavior of salinity was analyzed for the study period, to contrast the magnitudes of the errors mentioned in relation to the natural variation of pH in La Escollera.
4. Results
4.1. Estimation of ETRIS as a function of temperature
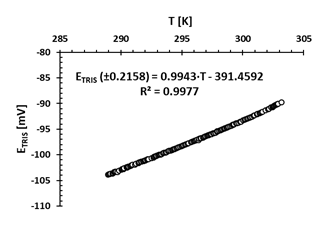
Fig. 2 shows that the (ETRIS) potential changes linearly with temperature, with a coefficient of determination (R2) of 0.9977. This result is expected in an electrode with nernstisian behavior. As the temperature increases the potential also increases and linearly.
Source: the authors.
Figure 2 E TRIS potential variation (mV) in the TRIS buffer prepared in ASW at a salinity of 35 against changes in temperature T (K), measured in the laboratory with the electronic logger HOBO MX2501. The linear regression equation is included (R2 is the coefficient of determination)
pHT(X) Calculated and differences with pHNBS(X)
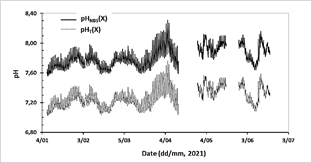
Once the expression to estimate ETRIS as a function of temperature was obtained, the pHT(X) of implementations 11-19 was calculated. The spreadsheet with the algorithm for calculating pHT(X), from the temperature in situ, ETRIS, and the potential (EX) measured in the lagoon can be found in Appendix B. Table 1 shows the maximum, minimum and average difference between pHNBS(X) and pHT(X) (∆pH = pHNBS - pHT(X)). It was found that on average the maximum difference is 0.58 pH units, the minimum difference is 0.51 pH units, and the average difference is 0.53 pH units. Note that implementation 17 was not used to calculate the average, as the sensor was not calibrated prior to deployment, which is why values were far removed from the other implementations. The values pHT(X) and pHNBS(X) presented a correlation coefficient of 0.9950 (excluding implementation 17) which shows that the expression used to calibrate the scale provides pHT values that vary concomitantly with pHNBS, which can also be seen in Fig. 3.
Table 1 Difference between pHT(X) calculated and pHNBS(X) delivered from the potentiometric measurements in situ by the HOBO MX25z01 logger in the artificial lagoon La Escollera. pHT(X) was calculated from Equation 17 by replacing EX, temperature (both measured in situ), and ETRIS as a function of temperature (obtained experimentally in the laboratory). ∆pH = pHNBS (X) - pHT (X).
| Implementation Number | Maximum ΔpH | Minimum ΔpH | Mean ΔpH |
|---|---|---|---|
| 11 | 0,55 | 0,51 | 0,53 |
| 12 | 0,56 | 0,52 | 0,54 |
| 13 | 0,56 | 0,51 | 0,53 |
| 14 | 0,57 | 0,52 | 0,54 |
| 15 | 0,58 | 0,53 | 0,55 |
| 16 | 0,57 | 0,54 | 0,55 |
| 17† | 0,26 | 0,17 | 0,21 |
| 18 | 0,58 | 0,55 | 0,56 |
| 19 | 0,58 | 0,55 | 0,57 |
| Mean* | 0,53 | ||
| Total mean | 0,55 |
† Sensor not calibrated; it operated with the previous calibration.
* Calculation of the mean without implementation
Source: the authors.
Source: the authors.
Figure 3 Time series of pHT(X) calculated and pHNBS (X) delivered by the HOBO MX2501 logger in the artificial lagoon La Escollera. Includes deployments where conversion between the two scales was achieved (January 7 to June 19, 2021). The temperature range of the lagoon during the implementations was from 297.83 to 305.58 K (24.68 to 32.43 °C), so the values greater than 304.00 K (30.85 °C) were extrapolated, which was the experimental limit (8 % of the data).
4.3. Salinity
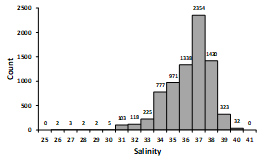
In the calculation proposed in this study, it was assumed that the lagoon has a constant salinity of 35. However, Fig. 4 shows that the lagoon during the period used for the calculations had salinities of 25.1 to 39.2 and that 71 % of the measurements were found in the salinity range of 33 to 37.
4.4. Daily and seasonal variation in pH, temperature, and oxygen
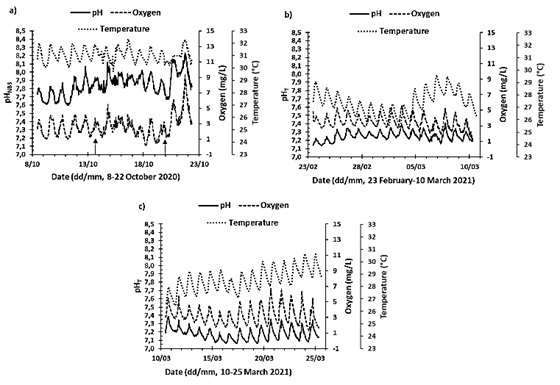
The time series of all measured variables are presented in Appendix A (with two sets of implementations for two different electrodes, "Original" and "Spare 1"; the experiments presented here correspond to "Spare 1"). This contribution presents as an example implementation 6, 13 and 14 (Fig. 5); implementation 6 corresponded to the rainy season (May to November) while implementations 13 and 14 to the dry season and coastal upwelling (December to April) (see Zea & Espada Gómez-Lor, 2020). For implementation 6 pHNBS is presented because for the electrode the experiment with temperature had not been carried out; for the other deployments pHT is shown. pH, dissolved oxygen and temperature in the lagoon exhibited a systematic pattern of variation over 24 hours in response to solar radiation (Fig. 5). As for the temperature, it began to increase at sunrise, reaching the maximum in the afternoon hours between 15:30 and 17:30. At night, when the sun went down, the temperature in the lagoon began to decrease, reaching the lowest temperatures in the early morning hours between 7:00 and 7:30. The lagoon presented daily temperature variations in the studied series between 0.76 and 2.36 °C. Additionally, the temperature was also influenced by the local and regional climatic seasons, since during implementations 13 and 14 (dry season), the maximum and minimum temperature recorded was 30.7 °C and 25.4 °C respectively. In implementation 6 (rainy season) the temperature in the lagoon was higher, showing a maximum temperature of 32.3 °C and a minimum of 29.7 °C. In addition to daily variations and seasonal differences, others were also observed that can be attributed to local and regional climatic conditions of shorter temporal scale, or moments of transition. For example, during implementation 13 the temperature varied approximately 4.25 °C over the period of 4 to 8 days (Fig. 5b).
Source: the authors.
Figure 5 Time series of temperature (°C), dissolved oxygen concentration (DO mg/L), and pH, measured in the artificial lagoon La Escollera during implementations 6, 13 and 14 (approximately fortnightly). For implementation 6 (October 8-22, 2020) the pH is presented in NBS scale, while for the others it is presented in Total scale, since for the first the ETRIS experiment with temperature had not been carried out. Arrows in a) represent heavy rainfall during the day, regardless of intensity or duration.
Regarding the concentration of dissolved oxygen (DO), it was evident that it is affected by the processes of primary production and remineralization. Because the highest concentrations were observed in the afternoon hours between 15:30 and 18:00, when the photosynthesis process is maximum. While the lowest concentrations occurred in the early morning hours between 6:00 and 9:00, when photosynthesis just begins, and respiration of organisms continues. The daily variations in DO concentration for the series studied were 0.82 to 6.62 mg/L (overall up to 9.24 mg/L, Fig. 5). In the period of one year analyzed (from July 29, 2020, to July 1, 2021) the average DO concentration was 3.01 mg/L (See Appendix A).
Regarding pH, it was observed that its daily variation was closely related to the variations of the DO concentration, because the pH also increased in the afternoon hours, reaching the maximum values between 16:00 and 19:00, the lowest in the morning hours between 4:00 and 8:00 and with daily variations for the studied series of 0.03 to 0.49 units of pH. For the rainy season (implementation 6, Fig 5a) there were general pH differences of 0.64 units, while for the dry season these were up to 0.33 units.
5. Discussion
5.1. Calculation of pHT
The linear relationship between temperature and potential (ETRIS) measured in the TRIS buffer solution prepared in ASW at salinity of 35 had a coefficient of determination (R2) of 0.9977 in the temperature range of 15.80 to 30.85 °C. This result is consistent with that obtained by Seiter and DeGrandpre (2001) who recorded an average R2 of 0.9995 in 4 electrodes in which ETRIS vs T was evaluated in the temperature range of 15 to 29 °C. Therefore, it is conjectured that the expression found can be used to calculate ETRIS as a function of temperature with an error of ± 0.2158 mV.
The relationship between the pHNBS and the pHT had a correlation coefficient of 0.9950, which indicates that the two variables are highly related, giving the expected result. Both the expression used by the electrode to measure pHNBS and the one proposed in this study to calculate the pHT are derived from the Nernst equation. The relationship between the pH scales can also be seen in Fig. 3, where it is observed that the pH series in total scale and the pH series in NBS scale present the same pattern during the day-night cycle and even during seasonal variations. This proposed method was validated in a separate (unpublished) work by calculating pHT with the help of the CO2sys program from values of dissolved inorganic carbon and total alkalinity, measured directly in discrete samples taken during the operation of the “Spare 1” electrode. It was found that the differences between pHT CO2sys calculated and pHT calculated in the present work were from 0.1034 to 0.1638 pH units, which shows that the calibration methodology proposed here is appropriate for studies in coastal environments where there are daily and seasonal pH variations greater than 0.18 units.
Millero (1986) proposed a series of expressions to convert pHNBS to pHT, in which first pHNBS is converted into
 , where
 is the coefficient of apparent activity of the hydronium ion), and then the pHSWS is converted to pHT, through equations that relate the equilibrium constants and the concentrations of the species taken into account in each scale. However, Dickson & Millero (1987) found that applying the interconversion proposed by Millero (1986) is not recommended because it adds uncertainty to the data since
it is not reproducible. However, to study the pH variations between different coastal zones it is pertinent to take all measurements to the same pH scale, therefore Carstensen & Duarte (2019) used the Millero (1986) ratio to convert series of pHNBS to pHT, claiming that the error introduced is negligible compared to the seasonal and annual variations presented in coastal environments. Since they found that in these, they can present pHT values from 6.4 to 8.8; values according to those found in this study that were from 7.02 to 7.76. The possible causes of this variability will be discussed below.
is the coefficient of apparent activity of the hydronium ion), and then the pHSWS is converted to pHT, through equations that relate the equilibrium constants and the concentrations of the species taken into account in each scale. However, Dickson & Millero (1987) found that applying the interconversion proposed by Millero (1986) is not recommended because it adds uncertainty to the data since
it is not reproducible. However, to study the pH variations between different coastal zones it is pertinent to take all measurements to the same pH scale, therefore Carstensen & Duarte (2019) used the Millero (1986) ratio to convert series of pHNBS to pHT, claiming that the error introduced is negligible compared to the seasonal and annual variations presented in coastal environments. Since they found that in these, they can present pHT values from 6.4 to 8.8; values according to those found in this study that were from 7.02 to 7.76. The possible causes of this variability will be discussed below.
Aßmann et al. (2011) compared pHT spectrophotometric values and pHNBS potentiometric values during the 1-day period at in situ temperature, finding that p H T is lower than pHNBS that in an average of 0.27 pH units. Lewis & Wallace (1998), from the conversion expressions of Millero (1986), determined that, at a salinity of 35, temperature of 20 ºC and pressure at 1 atm, the difference between pHNBS and pHT is 0.13 units of pH, p H T being less than pHT. In this study it was found that on average the difference between pHNBS and pHT was 0.51 to 0.58 pH units (∆pH), without implementation 17 (Table 1). Although these investigations were carried out with different methodologies so it would be inappropriate to compare them with each other quantitatively, they were found qualitatively equivalent. In fact, in these studies pHT is lower than pHNBS which is consistent with the definition of the scale of pHT (Equation 13), because when including the ion
 , the concentrations of ions increase, causing pHT to be lower compared to pHNBS.
McLaughlin et al. (2017) estimated the differences between spectrophotometrically measured p H T values and potentiometrically measured pHNBS values over a 2-year period at in situ temperature. This estimate found differences from -0.509 to +0.479, where 92 % of the measurements were within ±0.2 pH units. That is, most of the measurements showed an absolute difference of 0.2 pH units, a value close to that reported by Aßmann et al. (2011). This result is consistent since in both studies the spectrophotometric method is used to measure pHT and the potentiometric method to measure pHNBS. Although the results of McLaughlin et al. (2017) showed that the difference between pHT and pHNBS measured in situ can be as large as 0.509 units of pH. It should be borne in mind that in potentiometric methods it is expected that the electrodes present ∆pH differences, because as mentioned above the characteristics of each equipment differ by the response time and the wear of the equipment due to its use.
The calculation proposal made in this study assumes that the salinity in the lagoon is constant with a value of 35. However, Easley & Byrne (2012) argued that not considering the effect of salinity change can cause large relative errors in pH measurement. Whereas Dickson et al. (2007 and citations therein), reported that in the salinity range of 33 to 37 the error of using a buffer with salinity of 35 was 0.005 pH units. Also, Easley & Byrne (2012) found that calibrating to the constant salinity of 35 can produce errors of 0.028 pH units in a 10-unit change in salinity. While these errors are important for pH measurements in the open ocean, where variations range from 0.024 to 0.096 pH units, they can be considered not significant for nearshore locations and estuaries where pH can vary daily between from 0.121 to 1.430 pH units (Hofmann et at., 2011). And in this study the daily variations were 0.1 to 0.5 pH units and the total variation up to 0.64 pH units. In this research it was found that 71 % of salinity values during the period of interest were in the range of 33 to 37, and 29 % in the ranges of 25 to 33 and 37 to 40 (Fig. 4). Thus, it is expected that because of salinity, 71 % of the pHT calculated values have an error of 0.005 pH units and 29 % present an error of approximately 0.028 pH units.
Calibration is a key factor in obtaining accurate measurements when using potentiometric methods to determine pHT. Therefore, the calibration method chosen by each laboratory depends on the tools available. For laboratories that have spectrophotometers, the calibration proposed by McLaughlin et al. (2017) seems to be the simplest compared to the proposal developed by Martell and Byrne (2020), since the procedure is less laborious, because it does not require serial dilutions or titrations. However, this method should be used to study variations greater than 0.2 pH units such as those presented in coastal places. In addition to the fact that the proposed method of Martell and Byrne (2020) meets the objective proposed by the GOA-ON, calibration is performed at the temperature of 25 °C, which makes it difficult to apply in situ where the temperature varies constantly. For laboratories that do not have a spectrophotometer, it is possible to calibrate electrodes using ASW-prepared buffer solutions and bracketing calibration (Dickson et al., 2017). In case the electrodes do not allow calibration with customized buffer solutions (as is the case with the HOBO MX2501), it is recommended to perform calibration with standard NBS scale buffer solutions to confirm the nernstian behavior of the electrode. Carrying out the experiment proposed here of the behavior of the electrode potential with the temperature in TRIS solution, is a simple and easy to apply methodology.
5.2. Daily and seasonal variations
The temperature in the lagoon La Escollera presented daily variations related to the day-night cycle. In the day the temperature increased due to solar radiation and during the night it decreased because of the heat loss associated with radiation and convection into the environment. It was also found that the temperature was higher in October 2020, during the rainy season (Fig. 5a), compared to the months of February and March 2021, during the dry season (Fig.s 5b and 5c). This occurred as a result of the trade winds that blow from December to April, favoring the coastal upwelling of cold waters that enter the lagoon with the tides, and the removal of heat, behavior described by Zea & Espada Gómez-Lor (2020).
The daily DO fluctuations observed in marine ecosystems such as La Escollera lagoon are known to be caused by primary production and remineralization. Net primary production includes both photosynthesis and respiration of autotrophic organisms, and remineralization refers to the oxidation of organic matter (respiration) by heterotrophic organisms (Vopel et al., 2020; Lee et al., 2021; McLaughlin et al., 2021)). During the day high concentrations of DO are reached due to the photosynthesis of phytoplankton in the water column and by seagrasses, macroalgae or microalgae, at the bottom, if any. At night, oxygen decreases as photosynthesis stops while respiration of autotrophs and heterotrophs continues (Vopel et al., 2020). On average, in the artificial lagoon La Escollera in the period of one year (July 2020 to June 2021) the concentration of DO was 3.01 mg/L, value below the admissible level for the preservation of flora and fauna of 4.0 mg/L (Decreto 1594 de 1984). The low DO values in the early morning and the morning occur because remineralization (consumer of O2, McLaughlin et al., 2021) is greater in general than primary production, due to the accumulation of organic matter in the muddy bottom, especially from leaf litter of the mangrove that surrounds the lagoon; therefore, the lagoon seems to be a net emitter of CO2.
Daily pH variations are attributed to the processes of primary production, respiration and remineralization, as are observed daily fluctuations in DO concentration (Vopel et al., 2020; Vargas et al., 2021). pH variations can be explained through chemical equilibrium as follows: during the day, CO2 consumption by the process of photosynthesis causes the carbonate system to become destabilized. This again seeks chemical equilibrium by adjusting to the new condition, shifting the reaction towards the formation of CO2 from the products, H+ and
 , i.e., the chemical equilibrium shifts to the left of Equation 6, causing the increase in pH during the day due to the decrease of H+. On the contrary, at night the respiration of autotrophic and heterotrophic organisms produce CO2, and its increase affects the balance of the carbonate system, so, to neutralize this disturbance, CO2 dissociates into H+ and
. (Equation 6), in this way the concentration of the species H+ and
is increased, causing the pH to decrease in the course of the night.
, i.e., the chemical equilibrium shifts to the left of Equation 6, causing the increase in pH during the day due to the decrease of H+. On the contrary, at night the respiration of autotrophic and heterotrophic organisms produce CO2, and its increase affects the balance of the carbonate system, so, to neutralize this disturbance, CO2 dissociates into H+ and
. (Equation 6), in this way the concentration of the species H+ and
is increased, causing the pH to decrease in the course of the night.
The pH daily and overall oscillations obtained in the artificial lagoon La Escollera, from 0.03 to 0.64 pH units, are greater than the variations observed in the open ocean, which are from 0.024 to 0.096, with a rate of decrease in oceanic pH of -0.0017 pH units/year (Hofmann et at., 2011). This confirms that in coastal environments the natural variation caused by the processes of primary production, remineralization, and regional and local environmental effects, have a greater impact on pH variation compared to ocean acidification. However, the effect of ocean acidification in coastal environments should not be underestimated, as this can be combined with natural variations, pushing marine species to the limits of their physiological tolerances (Hofmann et at., 2011). Additionally, Carstensen and Duarte (2019) found that the input of organic matter is the main cause of pH variability in coastal systems, due to increased respiration rate because of eutrophication. This may be evident in this study, because after a rainy-day pH level increased due to primary production by the nutrients brought by runoff (Fig. 5a); however, more studies are needed to confirm this.
6. Conclusions
In studies on the variability of the carbonate system in marine environments where pH is the master variable, it is important to determine its measurement accurately and reliably. In potentiometric measurements the main source of error is calibration in low ionic strength buffer solutions. Therefore, in order to recover measurements of potential made with electrodes calibrated in standard NBS solutions, this study proposes a total scale pH calculation methodology suitable for laboratories that do not have advanced equipment such as spectrophotometers, with which pH variations greater than 0.18 units can be evaluated, such as those that occur in coastal environments. In this study it was found that the average difference between the pHNBS and the pHT determined with the potentiometric method with the HOBO MX2501 sensor was 0.53 units. Additionally, in evaluating of the effect of salinity found that in La Escollera, the effect of calibrating with TRIS butter with a salinity of 35 would not place a significant error because the lagoon presents greater variations in pH than those of the open ocean. Regarding daily and seasonal variations, it was found that La Escollera during the studied implementations showed daily variations in pH between 0.03 to 0.49 units (overall 0.64 units), DO from 0.84 to 6.65 mg/L (overall up to 9.24 mg/L), and temperature from 0.76 to 2.36 ° C (overall 4,25 °C). From a first qualitative analysis of these fluctuations, it was found that variations in pH during the day-night cycle are closely associated with those of dissolved oxygen, because of consumption and production of CO2 during the processes of primary production and remineralization. These high-frequency variations are of greater magnitude than those occurring in the open ocean and raise questions about the actual effect of OA on coastal ecosystems.

