


 English (pdf)
 Article in xml format
 Article references
 Send this article by e-mail
 Cited by SciELO
  Cited by Google
  Similars in
SciELO
Similars in
SciELO  Similars in Google
 Permalink
Dengue is the most widespread arbovirus world-wide, and it is endemic in over 100 countries (1). Dengue virus includes four antigenically related serotypes, DENV1-4. It was reintroduced in the Americas in the late 1980's and early 1990's, causing outbreaks in Bolivia, Brazil, Ecuador, Perú and Paraguay (2).
Given that the surveillance system has been considered as one of the problems involved in controlling the disease (3), optimizing its efficiency would make it possible to implement control measures in a timely manner.
In Paraguay, outbreaks of DENV-1 reappeared from 1988-1989 (4), causing an epidemic mainly in the states of Asunción, Central, Alto Paraná and Amambay (5). DENV-3 was detected in 2002 and a significant outbreak occurred in 2007, thereby continuing the circulation of DENV-1, DENV-2 and DENV-3 (6). Also during 2007, hemorrhagic dengue appeared for the first time in the country (7). One of the last and largest epidemics occurred in 2011 (8).
Knowledge about the environment is important since dengue is a vector disease in which the disease-transmitting mosquito travels short distances. Consideration for socioeconomic variables is also important to improve surveillance systems because in each local scenario they influence the distribution of the disease (1,9).
Regarding the epidemics of this infectious disease, epidemiological efforts aim at preventing new infections while clinical professionals engage in treating diagnosed cases. Once an epidemic is controlled, the performance of surveillance systems can be evaluated using general (10) or specific guidelines for the early detection of outbreaks (11) in order to detect possible deficiencies that should be addressed when planning for similar future contingencies.
In a globalized world, health surveillance systems functions may change, and this should be reflected in the guidelines and in collection and evaluation methods (12,13).
The attributes of a good surveillance system are simplicity, flexibility, data quality, acceptability, sensitivity, positive predictive value, representativeness, timeliness, and stability (10,14). Bias and noise in data from surveillance systems can occur due to a number of problems, which are endogenous to the system itself, as explained by Thomas, et al. (15).
Usually, epidemiological surveillance systems are evaluated after epidemics occur, as there is lack of rapid evaluation methods to identify whether cases fall within expectations during the event. Fortunately, a method based on Benford's law or Newcomb-Benford law was already proposed and successfully tested during the influenza A (H1N1) pandemic (16). In our case, we used the method to evaluate two characteristics of surveillance systems: data quality and system sensitivity, in order to support the Paraguayan authorities in improving their epidemiological surveillance system for dengue between 2009 and 2011 by checking how well the data fit with an objective evaluation tool such as Benford's law.
Materials and methods
Background
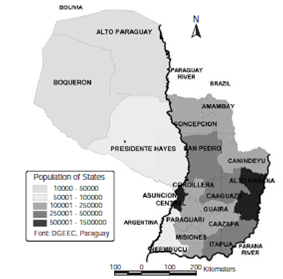
Paraguay has over 6 million inhabitants; it has 17 states besides the capital, where political and economic powers are concentrated (figure 1). The Paraguay River divides the country geographically; the eastern region is more densely populated than the western region, which borders Bolivia and Argentina. Although it has no coasts, the Paraguay and Paraná rivers provide the country with a route to the Atlantic Ocean, which serves to export a variety of products, mainly soy and beef (figure 1).
The dengue surveillance system in Paraguay is part of the Estrategia de Gestión Integrada, EGI, and is organized so that any suspected febrile syndrome (17) generates a notification with a unique febrile case detection number (http://www.mspbs.gov.py/dengue/). When these cases occur, the Unidad Epidemiológica Regional, UER of the corresponding sanitary district (a total of 18, one in each state and in the capital) must be notified. The UER then reports to the national level.
Source of data
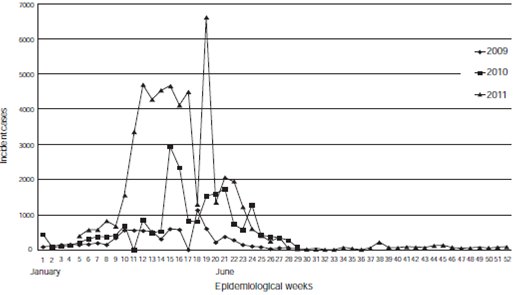
The study used official data related to suspect dengue cases for the period 2009-2011, obtained from the Ministerio de Salud Pública y Bienestar Social web site (http://www.mspbs.gov.py/). The analysis included information from weeks 1 to 29 for the year 2009, weeks 1 to 10 and 12 to 29 for 2010 and weeks 5 to 52 for 2011. The weeks that were not included corresponded to periods during which there were no reports. A suspected case was defined as a case of non-specific acute febrile syndrome notified from an area with endemic circulation of dengue virus (2,18) (figure 2).
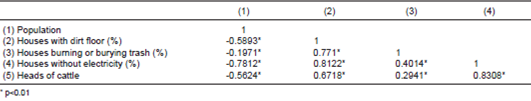
National socioeconomic data were obtained from the 2002 census conducted by the Dirección General de Estadística, Encuestas y Censos (http://www.dgeec.gov.py/), in order to evaluate whether the performance was uniform at different times and country regions. We took into account earlier findings reported in the literature indicating that certain social and geographic conditions were associated with the presence of the disease (18-20). The data included population, percentage of households with dirt floors and other better types, percentage of households that burn or bury garbage and percentage of households without electricity. We also collected data on the number of heads of cattle registered with the Ministerio de Agricultura y Ganadería (http://www.mag.gov.py/) since land use practices such as intensive livestock farming could be associated with the occurrence of arbovirus infections outbreaks (21).
Evaluation using Benford's law
Benford's law states that for a determined set of numbers, those whose first digit is 1 will appear more frequently than those beginning with other digits. This principle has been verified as a normal distribution pattern in nature, and there is a satisfactory mathematical explanation for it (22) indicating that it applies to dimensionless quantities and, therefore, that numerical values do not depend on measurement units. This distribution is common in the analysis of a health event, i.e., data can be counted and analyzed according to individual units (such as cases of an illness) or based on average values for thousands or hundreds of thousands of persons (such as rates). Although algebraically the process is not complex, we do not develop it herein. Nevertheless, the information that we consulted enabled us to conclude that the "distribution of distributions" of a sampling of natural count data does fit with Benford's Law.
Formally, this can be expressed as P(d1)=log [1+(1=d1)], d1=1, 2, . . . , 9, where for a series of numbers, P(d1) is the probability that a digit will be the first number (22). Numerous researchers have applied the law to different kinds of data (22,23) since Benford's original paper (24) was first published. For instance, population numbers, death rates, lengths of rivers and non-fraudulant financial and electoral data have been found to fit the distribution (22,23). The scientific literature provides some explanations for Benford's law (25,26), for instance, the good fit of the Newcomb-Benford law to empirical data responds to the fact that the frequency with which objects occur in 'nature' is inverse to their size. Very small objects occur much more frequently than small ones, which in turn occur more frequently than large ones, and so on. This can be applied to epidemiological surveillance systems, in which few cases are reported more frequently than many cases and epidemic curves are distributed across multiple orders of magnitude (ones, tens, hundreds, etc.) (27).
Using a similar logic, when measured values are known, the second digit can be evaluated to assess subtler differences resulting from a posteriori changes, and small changes alone may be sufficient to achieve a target distribution. The second digit is useful mainly when data have many zeros, thereby enabling more observations to be included in the analysis (16). In this case, the expected occurrence of each digit results from the following equation:

where P(d 2) is the probability of a digit being the second number (23,28).
For the present evaluation, we performed an overall analysis using weekly data reported by the 18 UERs in Paraguay. We analyzed the data from each year and stratified them in six regions: North (Amambay, Concepción, and San Pedro); West-Central (Central, Cordillera, and Paraguarí); East-Central (Alto Paraná, Caaguazú, Caazapá, Canindeyú, and Guaira); South (Itapúa, Misiones, and ñeembucú); Chaco (Alto Paraguay, Boquerón, and Presidente Hayes), and the Metropolitan Region (Asunción), as well as in the four seasons and the quartiles for the other variables previously mentioned.
Statistical analysis
We used χ2 and log-likelihood ratio tests to assess the fit of the reported number of dengue cases to Benford's law. We also calculated correlations between variables to explore the potential co-variation and redundancy of information among the variables analyzed. The analyses were conducted with the Stata 11(r) statistical software (Stata Corporation, USA) using the digdis module developed by Ben Jann (ETH Zurich).
Results
figure 2 shows dengue cases reported by epidemiological week. Two notable results are the periods during which there were no reports, and reports with zero cases. An overall evaluation of the surveillance system performance based on the first digit (figure 3) showed that it did not fit Benford's law (χ2 log-likelihood, p<0.001), since it appeared many more times than was expected (37.4% vs. 30.1%), and the digits 4 (7.5% vs. 9.7%), 6 (6.1% vs. 6.7%), and 8 (4.3% vs. 5.1%) appeared less than expected (p>0.05, Pearson´s χ2 test). Nevertheless, when we evaluated the second digit we observed that it fit the distribution expected for these digits (figure 3).
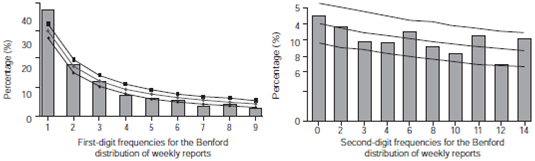
Figure 3 First- and second-digit frequencies for the Benford distribution of weekly reports. The upper and lower lines represent, respectively, the upper and lower limits of the confidence interval for the estimation of the expected mean of number of cases under de Benford's law assumption (middle line).
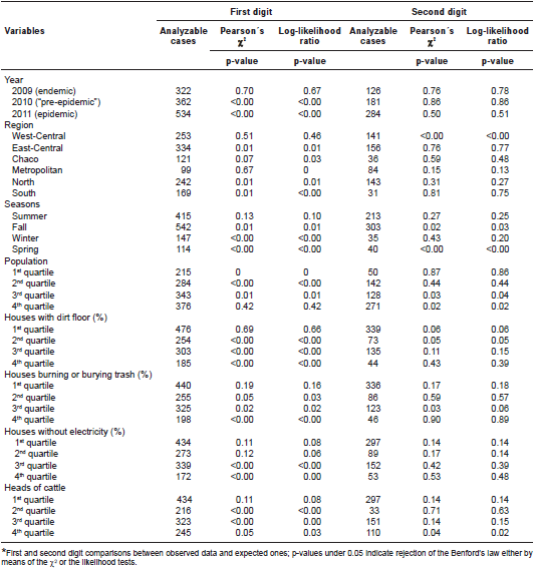
Table 1 summarizes the stratified analysis, which showed that the behavior of the first digit fitted Benford's law for 2009 in the west-central region during summer and in those states with more population, better housing conditions and fewer heads of cattle. The behavior of the second digit also fitted Benford's law, except for certain categories, such as autumn and spring seasons, the third and fourth population quartiles, the first and second quartiles of households with dirt floors, the third quartile of burning garbage and the highest quartile of heads of cattle. On the other hand, population variables were negatively correlated with variables reflecting poor housing conditions (table 2), and these latter variables were strongly correlated with each other.
Table 1 Fit of the Paraguayan epidemiological dengue surveillance data with Benford´s law (first and second digits), according to variables under study*
Discussion
It is important to note that the behavior of the first digit did not fit Benford's law, with the following exceptions: The west-central region, summer months, the more densely populated states with fewer households with dirt floors and fewer households burning or burying garbage, households with better access to electricity and places with fewer heads of cattle. These data suggest that epidemiological surveillance performed better in the states of Central, Cordillera and Paraguarí (west-central). However, given the high number of zeros, it was necessary to take into account the second digit, with which we observed a better fit with Benford's law. The analysis with the second digit was also useful to evaluate the problem of differences in the number of cases due to significant reporting irregularities.
In general, the strong association among variables related to housing conditions indicates precarious services in the immediate surroundings, which may also be related to a higher vector density in the periphery of urban centers, where poor sanitation is often more frequent and the microclimate contributes to the increase in mosquito populations (29-31).
It is worth noting that we observed a better fit during summer months both with the first and second digits. Using the second digit to analyze housing and environment conditions at state level improved the possibility of identifying those states with more notification problems.
These findings suggest that dengue epidemiological surveillance in Paraguay has generally performed well, especially in more urbanized states with less heads of cattle, during summer months and during periods with a low occurrence of dengue, which may be explained by the fact that dengue outbreaks generally occur during hot months, when the environmental conditions are ideal for vector proliferation, i.e., high temperatures and moderate to high relative humidity. Besides, Aedes aegypti is an urban mosquito that makes use of available infrastructure for its reproduction (32,33).
The analysis took into account the geographic distribution and housing conditions in the localities, and we obtained information pertaining to the behavior of the disease and its distribution in the region. It is a well-known fact that the quality of the data provided by an epidemiological surveillance system is crucial to make appropriate and timely decisions (15). The case definition of dengue used by a surveillance system should be carefully studied, given the evidence found in Brazil that suggests that under-reporting is directly related to the quality of the data (15,34,35).
Some authors have not found any particular patterns associated with unfavorable socioeconomic conditions (9,33,36), while the work by Barcellos, et al. (37) in Porto Alegre associated dengue cases with favorable socioeconomic conditions.
The relationship of these variables to dengue may be due to unclear socioeconomic segmentation in the city and the location of sectors with better conditions near those with poor conditions (38,39). Significant population mobility may also explain the mosquito's unexpected spatial distribution pattern (38).
Nevertheless, it is accepted that the proliferation of the vector increases when conditions are favorable to its reproduction (20,38,40), including socioeconomic conditions (39).
The method developed by Buckeridge, et al. is the only one known to us that also evaluates certain characteristics of surveillance systems. This method uses algorithms that require the processing of a large number of data and analysis by statisticians and experts (41), and, therefore, its widespread application in contexts such as Latin America would be difficult. On the other hand, the method we propose has the advantage of requiring little data while providing robust results.
However, as a mathematical law, the results should be considered to reflect only what is expected, i.e., that cases that do not conform to the expected behavior, indicate, in principle, "abnormality", but only with regard to the desired results under the law. In other words, the law is applicable to the occurrence of unexpected frequencies during an epidemic, which is an indication of a system's poor performance or an uncommon situation with respect to the epidemiological phenomenon analyzed.
In fact, as a mathematical model, Benford's law only constitutes an approach to explain an expected model of the frequency of the number of cases of a disease. However, the fact that the disease being analyzed does not fit the law implies the need for a deeper perspective, either because the surveillance system is incorrectly reporting the figures related to the epidemic or, given the nature of the phenomenon, it is not plausible for it to fit the law.
The lack of fit of the data to Benford's law is also apparent during the initial phase of an epidemic when there are reporting problems, as well as in other circumstances (16). Consequently, this type of surveillance systems evaluation applies ideally when notifications are increasing in order to make the needed real-time corrections and fits.
A limitation of the present study is the use of secondary data, which may reflect under-reporting due to difficulties in accessing health services. In addition, asymptomatic cases are frequent and affect the quality of the data whose spatial reach at state level is also a limiting factor. If more disaggregated data were available, problems could be detected for smaller areas and the difficulties for obtaining better quality data could be investigated.
Furthermore, the socioeconomic information came from the last census (2002) because it provided disaggregated data for the variables included in the study. Nevertheless, a recent study (42) did not find large changes in socioeconomic conditions since the last census.
Another limitation is that results are not the same for all types of data or under all circumstances (26). Therefore, unlike our first study (16), the present work focused on dengue and incorporated variables that addressed the conditions present in the region. In other studies, the authors used this methodology to evaluate data of social interest, such as responses to surveys, and found different fits in terms of Benford's law (43). They also considered the lack of fit to the law as a red flag, and given the "generalizability" (44) of the technique, they recommended complementing it with additional a posteriori analyses.
Therefore, the way the process is conducted (16) in a given system should be considered to make timely adjustments to plans and redirect resources.
The present study made it possible to identify states where there was a fit with Benford's law and, therefore, we deemed it successful in terms of contributing to prioritizing actions and improving resources distribution (45). In addition, this is the first epidemiological study to incorporate the use of the second digit, and confirm its potential usefulness when the surveillance system reports a high number of zeros.
In conclusion, our findings may be useful to the ongoing epidemiological surveillance of dengue, as it was possible to identify when the system performed best, i.e., when a possible increase in incidences was expected, such as during summer months. We suggested keeping the system functioning at the same level during all seasons (46).
Surveillance systems should continue to investigate, innovate and incorporate new technologies that enable rapid estimations and that have demonstrated their ability to respond to disease activity in a more timely manner (13,47).
On the other hand, those who have searched for accessible techniques that quickly provide information in real-time (48), the so-called epidemic intelligence, indicate that few tools have been designed to enable using numbers in absolute terms in the field of public health because the conditions needed to develop them for traditional health surveillance indicators do not always exist (49).
In this sense, research is necessary in order to quickly improve quality and obtain alerts regarding the performance of case notification. This is important since surveillance data is crucial to address issues related to control and prevention activities, such as identifying at-risk groups and monitoring the effectiveness of interventions (46).
To be effective, surveillance systems should respond to the evaluation system and its various established procedures (50). We consider the comparison of the observed distribution of digits with those expected by Benford's law to be a technological development, which is relatively easy to implement at the operational level, and detects problems in the notification system, as already mentioned. Thereafter, health authorities will need to monitor more closely zones with performances that differ from what was expected.
Finally, we were able to recommend a process with well-defined steps, which combines internal and external evaluations that would help in the implementation of necessary measures.
Moreover, the method could contribute to the prevention of neglected diseases by using cost-effective public health interventions (51). Benford's law allows for an objective evaluation of surveillance systems data quality, which is one of the characteristics included in the Centers for Disease Control and Prevention (CDC) guidelines (10) to ensure better disease surveillance.

