


Services on Demand
Journal
Article
 English (pdf)
 Article in xml format
 Article references
 Send this article by e-mail
Indicators
-
 Cited by SciELO
 -
 Access statistics
Related links
-
 Cited by Google
 -
 Similars in
SciELO
Similars in
SciELO -
 Similars in Google
Share

 Permalink
Ensayos sobre POLÍTICA ECONÓMICA
Print version ISSN 0120-4483
Ens. polit. econ. vol.25 no.55 Bogotá July/Dec. 2007
Política fiscal a través del ciclo económico: la experiencia colombiana
Fiscal Policy Throughout the Business Cycle: The Colombian Experience
Ignacio Lozano Jorge Toro
Trabajo presentado en la XXIV Reunión de bancos centrales y ministerios de finanzas, organizado por el Departamento de Investigaciones del Banco Interamericano de Desarrollo, octubre 19 y 20 de 2006, Washington, D. C.
Los autores le agradecen a Alex Guarín por su valiosa contribución en el trabajo de asistencia. Las opiniones son responsabilidad exclusiva de los autores y su contenido no compromete al Banco de la República ni a su Junta Directiva.
Los autores son, en su orden, investigador de la Unidad de Investigaciones Económicas y subgerente de Estudios Económicos del Banco de la República, Colombia.
Correos electrónicos :ilozanes@banrep.gov.co;jtorocor@banrep.gov.co.
Documento recibido el 19 de julio de 2007; versión final aceptada el 24 de octubre de 2007.
This paper was presented at the XXIV Meeting of the Latin American Network of Central Banks and Finance Ministries, IADB Research Department, October 19 and 20 of 2006, Washington, D.C.
The authors wish to thank Alex Guarín for his valuable technical assistance. The opinions contained are those of the authors and do not represent those of the Banco de la República or its Board of Directors.
In order, the authors are, researcher of the Economic Research Department and head of the Economics Studies Department, Banco de la República (the central bank of Colombia).
E-mails: ilozanes@banrep.gov.co; jtorocor@banrep.gov.co.
Document received 19 July 2007; final version accepted 24 October 2007.
En este trabajo se analiza la relación entre el ciclo económico y las finanzas públicas en Colombia. La evidencia internacional muestra que los movimientos cíclicos del producto influyen sistemáticamente sobre los resultados de las finanzas públicas. Por consiguiente, la distinción entre el componente cíclico y el permanente (estructural) del balance fiscales relevante, ya que permite a las autoridades fiscales determinar en qué proporción el resultado fiscal de un año particular refleja sus propias acciones discrecionales. Nuestras estimaciones muestran que el componente cíclico del balance fiscal del Gobierno central de Colombia ha sido relativamente pequeño en los últimos años (alrededor del 10% del déficit total). Idealmente, los gobiernos deberían llevar a cabo políticas fiscales contracíclicas para moderar las fluctuaciones del producto. Sin embargo, en las economías emergentes las políticas fiscales contrací-clicas son inhibidas por factores internos y externos. Usando un modelo estándar en su forma reducida, cercanamente relacionado con la restricción presupuestaria del Gobierno, se encuentra que la política fiscal en Colombia fue procíclica durante los últimos 45 años, de manera que por cada punto porcentual de aumento en la brecha del producto, el superávit primario (como proporción del PIB) cayó aproximadamente en una quinta parte.
Clasificación JEL: E62, E32, E63, H62, H61.
Palabras clave: política fiscal, ciclo económico, estabilización, déficit, presupuesto.
This paper reviews the close relationship between business cycle and public finances in Colombia. The international evidence shows that cyclical move-ments in output systematically affect the balance of public finances. Therefore, the assessment of cyclical and structural components of the budget balance becomes an important tool in the analysis of fiscal policy, because it may allow fiscal authorities to determine the extent to which the fiscal stance in a particular year reflects their discretionary actions. Our findings indicate that the cyclical component of the central government balance in Colombia has been fairly small in recent times (for about 10% of the overall defi cit). Governments are not usually neutral during the business cycle. Ideally, they ought to practice a countercyclical fiscal policy to moderate the magnitude of output fluctuations. However, in emerging economies, countercyclical fiscal poli-cies are inhibited by domestic and external factors. Using a standard reduced form model closely connected to the government budget constraint, we fi nd that fiscal policy in Colombia has been procyclical over the last 45 years or so, with the primary sur-plus falling (and the defi cit rising) as a share of GDP by approximately 1/5th of a percentage point when the output gap increases by one percentage point.
JEL Classification: E62, E32, E63, H62, H61.
Keywords: Fiscal Policy, Business Cycle, Stabilization, Deficit, Budget.
I. INTRODUCTION
This paper reviews the close relationship between business cycle and public finances in a small emerging economy as Colombia. The international evidence shows that cyclical movements in output systematically affect the balance of public finances. Therefore, the assessment of cyclical and structural components of the budget balance becomes an important tool in the analysis of fiscal policy, because it may allow fiscal authorities to determine the extent to which the fiscal stance in a particular year reflects their discretionary actions. In the fi rst part of this paper, we describe the method used to re-specify and re-estimate the elasticities that allow the calculation of both the cyclical and the structural elements of the fiscal balance for the Colombian central government. The methodology, which has not been employed in previous papers for this country, has been adapted to the structural characteristics of our economy in order to obtain more representative conclusions.
On the other side, governments are not usually neutral during the business cycle. In principle, they ought to practice a countercyclical fiscal policy to moderate the magnitude of output fluctuations. From a macroeconomic point of view, output volatility is undesirable, since introducing uncertainty on investment plans may have a negative effect on economic growth in the long term. Therefore, a key role of a sound fiscal policy should be the contribution to the stabilization of output fluctuations. In order to accomplish this role, in times of recession, governments ought to pursue an expansionary fiscal policy to stimulate aggregate demand and production. The resulting fiscal deficit from these actions could be financed by issuing new debt, which is expected to decrease during the recovery phase. Alternatively, in booming times, the fiscal stance must be restricted to avoid economic overheating and prevent a rise of both inflation and interest rates. Using a standard reduced form model closely connected to the government budget constraint, this paper also evaluates the fiscal policy stance in Colombia through the last 45 years. Applying more common techniques (fiscal impulses), previous studies for Colombia have evaluated the fiscal policy stance for shorter periods (see Lozano and Aristizábal, 2003; Cárdenas, Mejía and Olivera, 2006).
One of the most important fiscal mechanisms traditionally used to smooth the business cycle is the use of automatic stabilizers. Fiscal automatic stabilizers are defi ned as a group of public revenues and expenditures associated to the real business cycle. These stabilizers reduce the magnitude of economic cycles by stimulating economic activity in periods of recession, or by discouraging it in times of rapid growth. The nature of taxes and expenditures to act as economic stabilizers are such that they react automatically to changes in economic activity. Fiscal policy may foster or hinder the use of automatic stabilizers. The effectiveness of these selfregulatory tools are determined among others factors, by both the level of economic openness as well as the tax-expenditure framework. Evidence shows that automatic stabilizers work fairly well in developed countries where fiscal policies have in general a counter-cyclical or acyclical characteristic (Gali, 1994; Perotti, 1999; Silgoner et al., 2003; Perotti, 2004).
A second fiscal way of reducing the size of economic cycles is to rely on a discretionary fiscal policy. This approach states that government spending does not only reveal the endogenous component related to automatic stabilizers, but also the autonomous component involved in discretionary policy measures. Regarding this, a number of empirical studies have found that discretionary fiscal poli-cies in developing countries tend to be procyclical (Gavin and Perotti, 1997; Talvi and Végh, 2000; Kaminsky, Reinhart, and Végh, 2004; Calderón, Duncan and Schmidt-Hebbel, 2004; Alesina and Tabellini, 2005). In other words, fiscal policies in these countries often widen the size of economic cycles, creating destabilizing effects and harming long term economic growth. Credit restriction, mainly during the recessions of the cycle, has been identifi ed as an important factor that explains such behavior. In addition, the quality of institutions, the presence of fiscal rules, corruption, and the so called voracity effect, are also factors that make fiscal policies to become pro-cyclical.
The paper is organized as follows. After this introduction, we offer a retrospective review of business cycles and public finances in Colombia. In section three, we describe the methodology and estimate the structural and cyclical components of fiscal accounts. Then, the Colombian fiscal stance through the real cycle is assessed in section four. In section fi ve, we examine the fiscal stance during the years 2005 and 2006. The paper ends up with the main conclusions.
II. BUSINESS CYCLES AND PUBLIC FINANCES IN COLOMBIA: A RETROSPECTIVE OVERVIEW
Cyclical adjustment of fiscal accounts starts with the decomposition of output into a trend or potential component, and a deviation from trend, usually called the cycli-cal component. Potential output is defi ned as that level of production that might be attained with full usage of production factors. Sometimes, potential output is also defi ned as that level of production that guarantees a stable inflation in the long run.1 For Colombian GDP, quarterly data available since 1977, potential output as cal-culated by the Banco de la República is obtained by using a Hodrick and Prescott (1997) fi lter with priors (HPF). The results are shown in Graph 1, panel A. Panel B presents yearly fiscal balances for central government and the consolidated public sector for the same period.
According to this evidence, the Colombian economy has shown at least two complete real business cycles during the last thirty years (Graph 1 panel A,). A close look at these cycles is useful for understanding the relationship between economic activity and public finances. The first cycle started with an expansionary phase in 1978 which lasted about four years. High rates of GDP growth during this period were the result of a coffee boom that stimulated aggregate demand. Between 1978 an 1982 the average annual economic growth rate was 5.1%, one point above its potential level (the output-gap is displayed on the right scale of panel A). Thereafter, between 1982 and 1985, Colombian economy entered a low growth phase. This slowdown growth-period was common for all Latin American Countries (LAC) and was linked to the decline of external prices of commodities, the slowing down of world demand and the well-known debt crises in Latin America. The annual economic growth rate in Colombia during this period was, on average, 2.3%, 0.9 points below potential level.
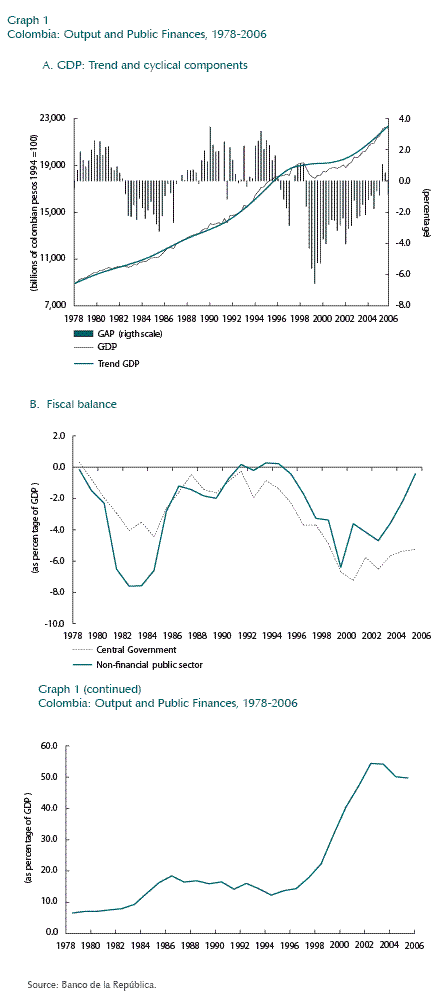
The consolidated fiscal deficit (which refers to the non financial public sector [NFPS]) reached 7.6% of GDP in 1982 and again in 1983 (Graph 1, panel B). Nearly 50% of this defi cit was a result of the fiscal imbalance of the central government. Three years later, in 1986, the NFPS defi cit was reduced to only 1.2% of GDP, thanks to an effective.
The second real business cycle started by the end of the eighties. The expansionary phase of this cycle spanned all the way to the mid-nineties. This period, nonethe-less, had a larger volatility than previous phases. In fact, although the economy was expanding at good pace, there were quarters of null or even negative growth. A diversity of market reforms happened during this period, aimed at increasing economic efficiency.2 Capital inflows to the fi nancial and oil sectors, encouraged by these reforms, together with an expansionary fiscal policy, were key determinants of this growth phase. Between 1987 and 1995 the Colombian growth rate averaged, 4.6%, about 0.4 points above its trend.
By the end of the nineties, the Colombian economy entered deep economic crises. The previous expansionary cycle of domestic consumption, fostered by large capital inflows and ample credit, began to die down by 1996. Like many other emerging economies, Colombia was severely hit by the international fi nancial crisis from 1997. Spreads in the foreign capital market started to rise in November that year, as a clear symptom of restricted access to international capital markets. In 1999 economic growth plummeted to -4.2%, the fi rst negative growth rate of the last fi fty years. Throughout this period, domestic real interest rates were relatively high and policymakers faced the perils of political instability and a sharp fi nancial crisis, all at once. By 2000 the economy initiated a slow recovery, but the output gap remained highly negative.
In 1999, the consolidated fiscal sector reached a deficit of 6.4% of the GDP, due entirely to the fiscal imbalance of the central government. The deterioration of the fiscal position of the central government was partly a result of the severe economic slump, but also reflected the inclusion of particular budget operations on accrual basis, that became important in Colombia since then3. Even though the size of the fiscal deficit at the end of the nineties was smaller than the one observed during the early eighties, its correction proved to be more diffi cult due to its almost exclusive central government origin. In fact, the narrow margin of maneuvering of the central government expenditure policy because of the rigid institutional framework prevented a more decisive fiscal adjustment, despite recurrent attempts of structural reforms by different administrations. As a result of this persistent government deficit, the government debt reached a critical level of 54% of GDP in 2002. During the last few years, the government debt has been declining as a result of economic recovery, tax reforms and appreciation of the exchange rate (Graph 1, pane C).
During the years 2005 and 2006, the Colombian economy returned to growth rates between 5% and 7%, somewhat above Latin America average. Recovery of economic growth was possible for both external and domestic reasons. Among the first, the favorable international economic environment gave rise to an important increase in exports, high commodity prices and capital inflows, mainly foreign direct investment. As far as domestic reasons behind economic recovery, they were related to an increase in consumers and investors confi dence, as a result of improvements in public security and macroeconomic stability. In addition, monetary policy played a key role, through low interest rates and ample liquidity conditions. Although the consolidated fiscal balance in Colombia improved markedly along 2004-2006, the central government fiscal position continued to be highly imbalanced.
III. TRENDS AND CYCLES OF COLOMBIAN FISCAL ACCOUNTS
A. AN OVERVIEW OF THE METHODOLOGY
Even before presenting an empirical analysis, the description of the section above sheds little doubt that economic cycles in Colombia have influenced fiscal policy and vice versa. For a more formal analysis, it is convenient to begin by reviewing briefly some methodological tools that allow identifying the cyclical and trend components of the fiscal position throughout time. A fi rst concept to explain is the cyclically-ad-justed fiscal balance, which is computed to show the underlying fiscal position when cyclical or automatic movements are removed (see Girouard and André, 2005). In this section, the cyclically fiscal stance of the central government in Colombia since 1990 will be calculated.
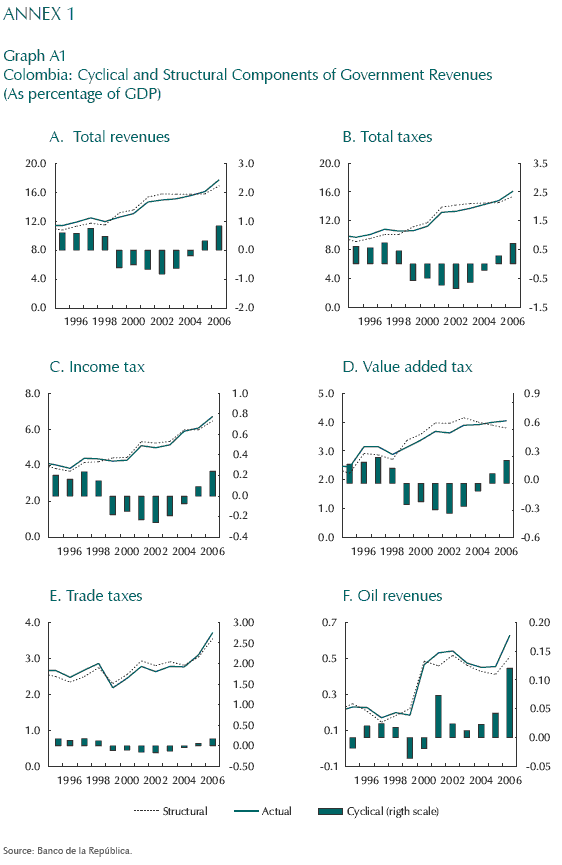
Three different types of taxes are explicitly singled out for the cyclical adjustment process, namely: income tax; value added tax; and trade tax.4 These taxes that amount to 15% of GDP are collected by the central government and represent 90% of its total tax revenue. Given that the total tax burden in Colombia (including local and provincial taxes) is 18% of the GDP, this exercise becomes a good approxima-tion of the cyclical behavior of the total tax system. Moreover, the oil net revenue (profits), which is an additional and important source of government revenues, is also cyclically adjusted. By data restriction, the social security contributions could not be cyclically adjusted, as usually recommended.
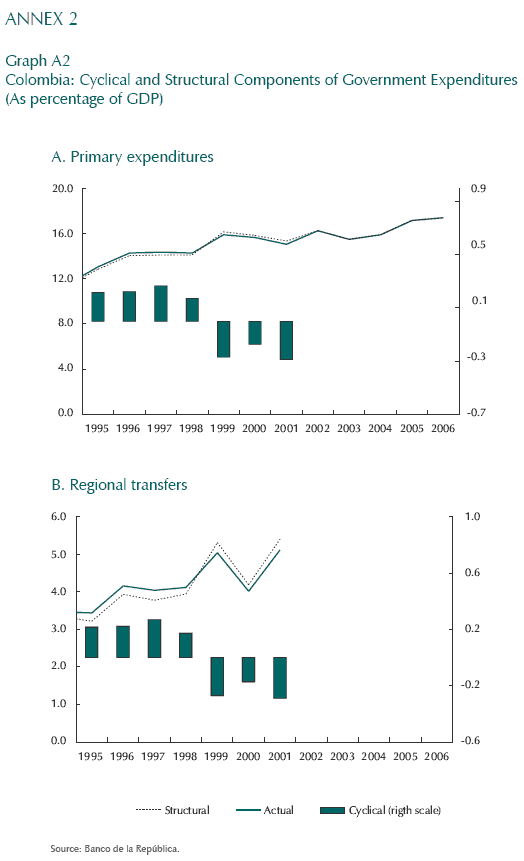
Regarding expenditures, the sole item of public primary spending treated as cyclically sensitive, is territorial transfers from the central to local governments. Under the regime of territorial transfers in place between 1994 and 2001 (Law 60/1993), these transfers accounted for an annual growing percentage of central government current revenues, which are highly influenced by output behavior. Lastly, an additional effort is made to calcúlate the cyclical component of interest payments on government debt. By computing the cyclical component of the items mentioned, it is possible to obtain both the cyclically adjusted primary balance and the cyclically adjusted overall balanced. More formally, the methodology employed can be summarized as follows:
Tax Revenue. For a period t, the actual tax revenue ( Tta) has two components: one structural (TtS) , and one cyclical (TtC) . Consequently Tta = Tts + Ttc, hence:

The structural component can be estimated using the actual output (Yta) and the potential output (Ytp), as:
where  represents tax elasticity with respect to output. According to Blanchard and Perotti (1999), the tax-output elasticity can be calculated as:
where  denotes the elasticity of taxes of type i to their tax base
  means the elasticity of the tax base to GDP, and
  These tax-output elasticities are estimated for the period 1970-2005. Since there were at least fi fteen tax reforms during this period, it is necessary to introduce dummies to control the effect of such reforms on estimated output elasticities.
Oil net Revenues. The total profi ts obtained by the national petroleum company (Ecopetrol) in period t(TPta) are translated in t + 1 period to the central government, as additional source of non-tax revenue. One fraction Α of actual profi ts arises from domestic sales of gasoline and other products (we cali them domestic profits DPta), while the other fraction (1 Α) results from external sales of petroleum (EPta). Therefore, TPta = Α DPta + (1 Α )EPta. The structural component of the domestic fraction (DPts) is computed by using potential output, while the structural component of the external fraction (EPts) is calculated by means of long-term exter-nal price of oil.5 In line with (2), then:
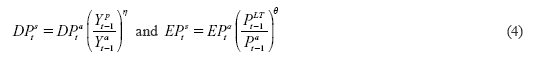
where η represents the elasticity of the domestic profits to GDP and θ denotes the elasticity of the external profi ts to oil external prices.
Expenditures. As mentioned, the only item of primary public spending treated as cyclically sensitive is territorial transfers from the central government to local gov-ernments, which are mostly used to finance expenditure on education and health. The structural part of this item (TRts) is obtained by using potential output as in equation (2).
B. ELASTICITIES
The outcomes on output-tax elasticities, making a distinction between income-tax, valué added-tax, and trade-tax, are showed in Table 1. The fi rst column refers to revenue elasticity with respect to the tax base, the second one denotes the tax base elasticity with respect to GDP
 and the third column shows a compound result by combining them
 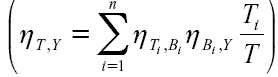 The table also shows the other revenue and expenditure elasticities described above. The general pattern that emerges from these estimations is one of relatively high response of tax revenues to output, in a range that goes from 1.18 for income-tax to 2.06 for the valué added-tax. Looking at the estimation by components, it can be noted that income and VAT elasticities, to their tax bases, turn out to be larger than their corresponding tax base elasticities to GDP; and conversely, for trade taxes. Computing equation (3), the ag-gregate tax elasticity with respect output turns out to be 1.47.6
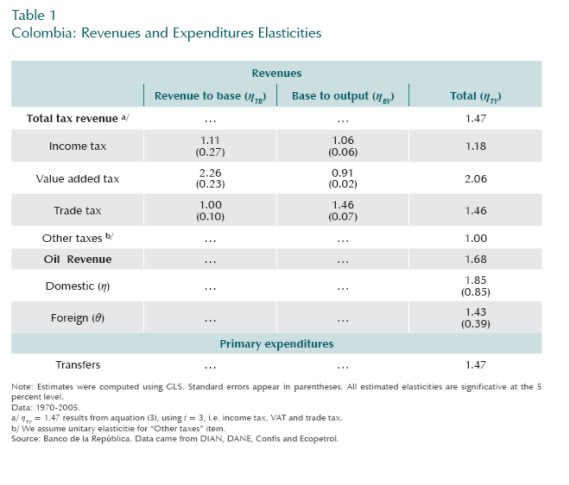
These results are quite different to others that have been obtained by several empirical studies for Colombia. For instance, Lozano and Aristizábal (2003) found an aggregate output elasticity of 0.91 for central government tax-revenues and 1.24 for general government tax-revenues. Using different techniques, Rincón et al. (2004) and Salazar and Prada (2003), also found similar results (0.96 and 1.03, respectively) for aggregate tax-revenues of the central government. Our results differ from others probably for two methodological reasons: no previous studies calculated the GDP-tax elasticities based on individual taxes like equation (3), and none controlled the estimation results by the effects of tax reforms.7 Hence, our results can be seen as a truly new fi nding for the Colombian case.
C. ACTUAL AND CYCLICALLY-ADJUSTMENT BUDGET BALANCE IN COLOMBIA
Cyclically adjusted budget balances for the Colombian central government are pre-sented in Graph 2 annexes 1 and 2 also illustrate revenue and expenditure items that were cyclically adjusted. A basic feature that emerges from Graph 2 is that the cyclical component of both overall and primary balances has been fairly small during the last ten years (see grey areas of panels B and C).8 For instance, along the deep recession and recovery (1999-2003), the cyclical defi cit attained, on average, -0.5% of the GDP which explained only 8% of the actual overall defi cit (on average, -6.4% of the GDP). More recently in 2006, when the economic growth rate was above its potential level (panel A), the cyclical component amounted to +0.8% of the GDP. For this year, if the output had grown at its potential level, the overall defi cit would have been -5.3% of the GDP (the structural level) instead of -4.5% of the GDP (the current level). These results provide clear evidence that the fiscal defi cit of the central Government in Colombia has a structural character.
The structural character of the government fiscal deficit has been widely recognized in the past by analysts and policymakers.9 Public authorities have also pointed out the structural character of the government defi cit as a motivation for proposing recurrent fiscal reforms, in particular since the end of the nineties. An overview of them gives a good idea of different central government initiatives to balance its budget.
About the revenue, new taxes were created since 1998 (bank debit-tax and personal/ corporative wealth-tax), while tax bases and tariffs of the most important taxes were augmented. Nonetheless, some of these taxes were transitory, due in 2007.10 As far as tax system administration goes, the 2003 reform unifi ed tax identification docu-mentation required to conduct transactions. The national tax offi ce has made efforts to raise the number of taxpayers to about two million. As a result, between 1998 and 2005 tax revenue increased from 10.6% to 14.9% of the GDP. In 2006, an additional tax reform was approved in order to compensate for the expiration of transitory taxes, thus maintaining the national tax burden at 15.8% of GDP.
Fiscal reforms on the expenditure side focused on structural adjustment in pensions, decentralization and reforms to the State. Government expenditures have also been reduced through more effi cient liability management. Concerning pensions, the recent reforms of 2003 and 2005, substantially reduced financial imbalances. Nonetheless, the parameters of the pay-as-you-go system and other special pension regimes still lead to imbalances between present values of contributions and benefits. For this, since 2004, the central government is making direct transfers to the pension public system, which are expected to peak at 5% of GDP in 2010 versus 4% in 2005 and 0.2% in 1994.
Regarding decentralization, one of the main changes introduced by the 1991 Political Constitution was a decisive orientation of public finances towards decentralization.
Nevertheless, since fiscal responsibilities between central and local governments were not clearly defined, decentralization turned into an additional source of expenditure and fiscal imbalance. Following the Constitutional mandate that determined regional transfers as an increasing percentage of the central Governments current revenues, the amount of transfers from the central Government to the regions increased nearly 3% of the GDP during the nineties. By closely linking regional transfers to income, this formula introduced an important element of pro-cyclicality on government expenditures, thus reducing the effectiveness of tax reforms as a means of fiscal adjustment. Trying to correct this situation, the 2001 transfer reform, transitorily detached them from the central Government income and established a fixed growth rule: CPI+2% from 2002 to 2005 and CPI+2.5% from 2006 to 2008, moderating, at least temporarily, the rate of growth of regional transfers.
Concerning State reforms, in April 2003 the Government announced a State Reform Program that would eliminate 40,000 public employment positions, including 30,000 through retirement during 2002-2006, and 10,000 through reduced vacancies and separations. According to the World Bank (2004), by September 2004 the Government had dispense with 17,599 positions (or about 4% of the 443,017 national Government employees and 25% of the 160,000 employees in the executive branch). Gross savings from these employment reductions amounted to COP$466 billion, with once and for all severance costs of COP$308 billion. This and other efforts for public employment reduction have been among the instruments with which the Colombian Government has tried to correct fiscal imbalance and increase public sector efficiency.
In spite of above mentioned measures, efforts for fiscal adjustment have not been enough to reduce the structural deficit of the central Government in Colombia. Consequently, fiscal authorities face challenges on new fronts. As Graph 2 reveals, since 2003 the structural overall deficit has been placed between 5% and 5.5% of the GDP, where an important fraction of it arises from interest payments. Interest pay ment s on government debt have increased up to 4% of GDP over the last three years, whereas by the mid nineties they were only 1.3% of GDP. The increasing burden of interest costs has been a result of a larger indebtedness, which reached 50% of the GDP in 2005.
As evidenced so far, the majority of the restrictive fiscal reforms took place between 1998 and 2002, precisely the phase of lowest economic growth. By contrast, the fiscal stance was expansionary during the first half of the nineties, when economy reached rates of growth above 5%. From this preliminary proof fiscal policy in Colombia has arguably played a procyclical role. In the next section this issue will be explored in more detail.
IV. THE COLOMBIAN FISCAL STANCE THROUGHOUT THE REAL CYCLE
A large number of empirical studies have found that the fiscal stance in industrial countries tends to be either acyclical or countercyclical, which is consistent with the stabilizing role of fiscal policy (Gali, 1994; Perotti, 1999; Silgoner et al., 2003 and Perotti, 2004. In contrast, other studies for developing countries low and middle-income countries or for emerging economies like Colombia, have usually concluded that their fiscal policies have a procyclical character, which amplifi es economic cycles and is a source of instability (Manesse, 2006; Alesina and Tabellini, 2005: Calderón, Duncan and Schmidt-Hebbel, 2004; Kaminsky, Reinhart, and Végh, 2004; Braun, 2001; Talvi and Végh, 2000; Gavin and Perotti, 1997; and Alberola and Montero, 2005).
Among the reasons that explain procyclical policies are: weak institutions, corruption, asymmetric information, fiscal rules, borrowing constraints, and the so called voracity effect.11 Gavin et al. (1996) tested some of these causes for Latin American countries in the nineties, finding valuable conclusions. In particular, they found that the fragility of Latin America´s relationships with international financial markets plays a special role in hindering towards countercyclical policies. This happens because during economic downturns, these countries often face a loss of market confi dence, which intensifi es borrowing constraints. The other factors mentioned above have also been tested for the region.
In this section the Colombian fiscal policy is examined through the cycle; to assess, for the Colombian case, the validity of empirical results obtained for other emerging economies. Using a reduced form model as a traditional approach discussed by Manesse op. cit., equation (5) is estimated. This is a linear regression closely connected to the government budget constraint. In particular, this equation relates the primary (or overall) surplus, S, in percent of GDP (or potential output) to the output gap (or the rate of GDP growth), Gap, controlling for the debt-GDP ratio, Debt, and the lagged dependent variable.12
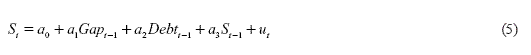
where u is an i.i.d. disturbance. In principle, the use of primary balance instead of total balance is justifi ed by the fact that the intertemporal government budget constraint depends on primary surplus. In addition, the use of primary balance is a reasonable choice, since primary expenditure is more likely to be under discretionary government control. Nonetheless, the inclusion of interest payments (i.e. using total balance rather than primary balance as dependent variable) could also be relevant, because it makes possible to identify the role of interest payments throughout the cycle.
On equation (5), Alesina and Tabellini (2005), and also Manesse op. cit, agree that a1 < 0 is evidence of a procyclical policy. That means that primary balance-to-GDP ratio falls when actual output increases relatively to potential output.13 Regarding the relationship between Debt and primary surplus, which was fi rstly used by Bohn (1988) to test gover nment solvency (sustainability), it is required that a2 > 0. If a2 > 0, the government tries to increase the primary balance in order to react to the existing stock of public debt and comply with the budget constraint. Such a result could be seen as a sign of a Ricardian fiscal regime (Afonso, 2005). Literature has emphasized that sustainability of public finances would require not only that a2 to be positive but also such coefficient to be sufficiently positive.14
Table 2 summarizes the statistics of the data set used to estimate equation (5). It is clear that for the last fi fty years, the poorest fiscal results (total/primary ratio and debt coefficient) were presented during the deep recession of 1999-2002, while the best results were obtained during the first half of the seventies.
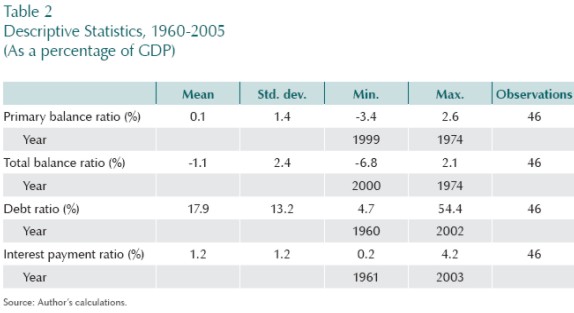
Table 3 shows the estimated results of equation (5) for both primary and total balances of the Colombian central government. The coeffi cient of the (lagged) output gap, a1, is signifi cant and negative in both cases, which implies that fiscal policy in Colombia has been procyclical in the past 45 years or so, with the primary surplus falling (and the defi cit rising) as a share of GDP by approximately 1/5th of a percentage point, when the output gap improved by one percentage point. The coeffi cient a1 falls from 1/5 (for primary balance equation) to 1/10 (for total balance equation), which means that interest payments smooth or compensate the procyclicality degree of the fiscal policy. This role of interest payments is not sur prising because in bad times, as fi nancial markets become more restricted, the spread on public bonds rises, and debt service increases, thus acting as a kind of automatic stabilizing de-vice. In good times, the opposite takes place.
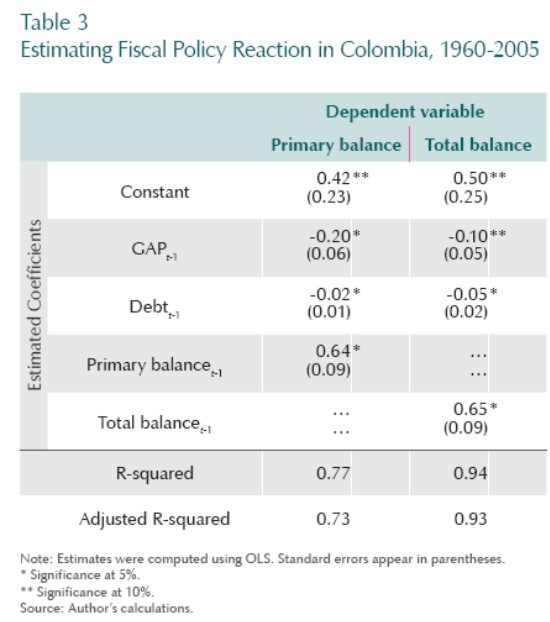
Concerning the coefficients of the (lagged) debt, a2, they are significant and negative in both cases. As said above, if a2 is positive, the government tries to increase the primary balance in order to react to the existing stock of public debt and comply with the budget constraint. The results here obtained do not provide evidence that the Colombian central government behaves that way. On the contrary, the outcome suggests problems to sustain the government fiscal stance.
Our results confirm the outcomes of previous studies in Colombia that also detected a procyclical fiscal behavior. For instance, Lozano and Aristizábal (2003), using various fiscal impulse defi nitions, found out that fiscal policy was procyclical between 1991 and 2002. For a longer period (1981-2005) and also using a fiscal impulse technique, Cárdenas et al. (2006) obtained the same procyclical results, although for some observations (six years) fiscal policy was deemed countercyclical.
V. THE FISCAL STANCE IN 2005-2006 AND PROSPECTS
As a result of economic recovery, high international oil prices, tax reforms and public under-spending at the local and regional levels, the NFPS defi cit narrowed from 2.9% of GDP in 2003 and 1.7% of GDP in 2004 to 0.7% and 1.5% of GDP in 2005 and 2006 respectively. If quasifiscal operations are included, these recent outcomes are even better, namely, a combined public deficit of 0% and 0.9% of GDP in 2005 and 2006 respectively. These results turned out to be much better than expected.
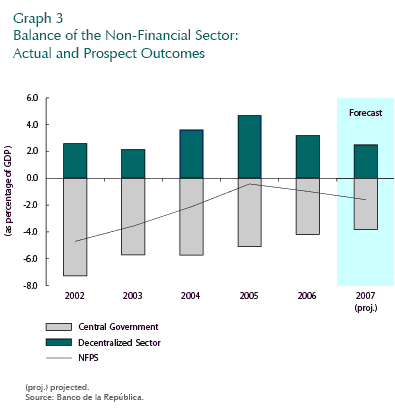
Central government level, has also shown steady improvement. From a defi cit of 5.8% of GDP in 2004, the central Government defi cit diminished to 5.2% and 4.6% of GDP in 2005 and 2006, respectively. Although these defi cits are still large, they have mostly been offset by a surplus of the decentralized public sector (Graph 3). On this regard, Ecopetrol, the State-owned oil company, attained a satisfactory operat-ing surplus (1% of GDP in 2005 and 1.2% of GDP in 2006 in cash basis), mainly as a result of high oil prices. In addition, the social security system accumulated important resources due to increased contributions from other parts of the public sector, that led to a social security surplus of 2.3% and 1.2% of GDP in 2005 and 2006 respectively. The surplus of the decentralized public sector in 2005 and 2006 could have been larger if regional authorities had not started to execute their devel-opment plans, thus reducing their respective surplus from the peak of 1.1% of GDP attained in 2004.
The higher NFPS-primary surplus resulting from the fiscal improvement just described, helped reduce gross public debt below 50% of GDP by 2006. Additionally, the structure of public debt was improved as a result of net repayments of foreign debt made by the government in 2005 and 2006, while issuing domestic currency securities at fixed interest rates and longer maturities.
There is no doubt that in the years 2005 and 2006, the government made progress working on structural reforms and adjusting public finances. Even so, it must be recognized that the better fiscal outcomes of these last few years have also been achieved thanks to the strong influence of exceptional factors, such as a high rate of economic growth; higher than expected world oil prices; appreciation of the exchange rate, and historically low interest rates. Moreover, the accounting treatment of government interest payments also contributed to the fiscal improvement.15
The positive fiscal surprise can be assessed by comparing initial authorities predictions for the consolidated fiscal defi cit (including quasi-fiscal operations) with actual results (Table 4). For the year 2005, a defi cit of 2.4% of GDP was expected, a forecast that was in fact used as performance criteria in Colombias program with the IMF. As shown, the actual result in 2005 was one of fiscal equilibrium. Table 4 quantifi es each of the main factors that contributed to this excellent outcome. Notice that real GDP growth turned out to be much better than expected, rising government tax revenue in 0.7% of GDP. This behavior is consistent with the positive output gap shown in Graph 2, panel A. Among other factors, low interest rates of public bonds and high oil prices also made a significant contribution.
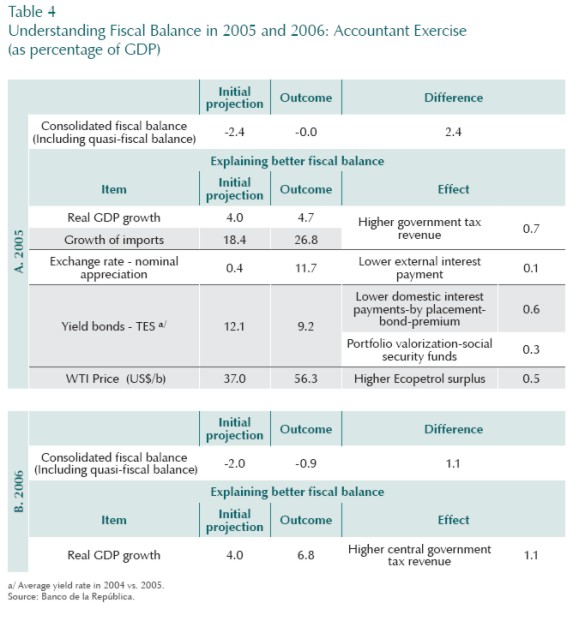
Something similar happened in 2006. From an initial forecast of a 2% deficit of GDP for the consolidated public sector, the actual result turned out to be a deficit of only 0.9% of GDP, that is, an unexpected fiscal improvement of 1.1% of GDP. As shown in Table 4, this positive outcome can be fully attributed to a rate of growth of 6.8% well above the initial forecast of 4%.
The official fiscal predictions for the next few years are less ambitious. For 2007, the budget considers a spending plan of COP$117.6 billon, a 7% real above the 2006 budget, and targets an NFPS deficit of 1.6% of GDP. In the medium term, 2008-2011, fiscal authorities expect to maintain a public defi cit of around 2% of GDP.
VI. CONCLUSIONS
This paper has presented a general assessment of the strong relationship between the business cycle and public finances in Colombia. Research on this area usually shows that cyclical movements in output systematically affect public fi nance results. The distinction between the structural and the cyclical components of the fiscal balance is an important tool for the analysis of fiscal policy, since it may help fiscal authorities to determine the extent to which current budget reflects their discretionary actions. Once the budget balance is adjusted by the cycle, a reliable indicator of the fiscal policy stance can be obtained.
Findings indicate that the cyclical component of both overall and primary fiscal balances of the central government in Colombia have been fairly small during the last ten years. During recession and recovery (1999-2003), cyclical deficit attained, on average, -0.5% of the GDP which accounted for only 8% of the actual overall defi cit period. More recently in 2006, when the economic growth rate was above its potential level, the cyclical component amounted to +0.8% of the GDP. For this year, if the output had grown at its potential level, the overall defi cit would have been -5.3% of the GDP (the structural level) instead of -4.5% of the GDP (the current level). These results provide clear evidence that the fiscal defi cit of the central government in Colombia has a structural character. This is why fiscal authorities have emphasized that the structural character of the fiscal deficit requires decisive and deep-rooted reforms.
There is no doubt that during the last years, the government made progress on structural reforms and public finances consolidation. Even so, it must be recognized that the improvement of fiscal outcomes in the years 2005 and 2006 has also been achieved thanks to the strong influence of exceptional factors, such as a high rate of economic growth; higher than expected world oil prices; appreciation of the exchange rate and historically low interest rates.
Using a traditional approach which links budget primary balance and output gap, we found that fiscal policy in Colombia has been procyclical in the last 45 years or so, with the primary surplus falling (and the deficit rising) as a share of GDP by approximately 1/5th of a percentage point, when the output gap improved by one percentage point. Our results corroborate both the outcomes of previous studies in Colombia, which have used fiscal impulse technique, as well as the international evidence on the procyclicality character of fiscal policies in developing countries.
COMENTARIOS
1 The so called NAILU: Non-accelerating inflation level of output.
2 At the beginning of the nineties, the government started to introduce important economic reforms to the trade and exchange rate regimes, as well as to the financial, labor, social security, and public sectors. These reforms aimed at improving resources allocation, promoting competitiveness, encouraging adoption of new technologies, and increasing exports. See details in Hommes et al. (1994).
3 Refer mainly to changes in the budget carryover.
4 The trade taxes include both tariffs and VAT on imports.
5 Pt LT is estimated using a moving average order 5, which provides a good proxy of the longterm price of WTI-oil, calculated by specialized agencies. On the other side, a corresponds to the share of domestic-oil-sales on total sales. A similar technique is used by Rincón et al. (2004).
6 The value of these parameters is analogous to what have shown the international evidence (using the same methodology). The income tax to GDP elasticity is, on average, 1.3 for OECD; 1.5 for euro area and 1.1 for new European Unions members (Girouard and André, 2005).
7 In this paper we used dummies technique to control the effects of tax reforms on revenues.
8 The primary balance excludes interest payments from the public expenditures.
9 See, for instance, the final report of the “Comisión de Racionalización del Gasto y de las Finanzas Públicas” (1997), or the final report of the “Comisión del Ingreso Público” (2002).
10 The surcharged on income-tax (10%); the personal/corporative wealth-tax; and 1 point (over 4) on the debit-transaction taxes.
11 According to Manasse (op. cit., p. 7), the “voracity” effect takes place, “[…] in economies lacking strong legal and political institutions. In such circumstances, a windfall in revenue exacerbates the struggle for fiscal redistribution, as each interest groups tries to appropriate its share without fully internalizing the consequence of its own demand on general taxation. Lack of coordination, in this version of the familiar common pool problem, is ultimately responsible for a more-than-proportional increase in spending.”
12 The primary balance of period t is dependent on last year primary balance, since it is not easy for a government to implement enough measures in a single year to significantly change the fiscal policy stance.
13 It should be recalled that output gap = actual output – potential output.
14 See details in Afonso (2005, pp. 14 y 24).
15 Until 2005, the premium from bond placements was totally discounted from interest payments expenses. This premium was calculated as difference between interest bearing coupon minus market rates.
ANEXOS
REFERENCES
1. Alesina, A.; Tabellini, G. Why is Fiscal Policy Often Procyclical?, working paper, no. 11600, Cambridge, National Bureau of Economic Research, 2005. [ Links ]
2. Afonso, A. Ricardian Fiscal Regimes in the European Union, working paper, no. 558, European Central Bank, 2005. [ Links ]
3. Alberola, E.; Montero, J. Debt Sustainability and Procyclical Fiscal Policies in Latin America, working paper, Banco de España, 2005. [ Links ]
4. Blanchard, O.; Perotti, R. An Empirical Characterization of the Dynamic Effects of Changes in Government Spending and Taxes on Output, working paper, no. 7269, Cambridge, National Bureau of Economic Research, 1999. [ Links ]
5. Bohn, H. The Behavior of U.S. Public Debt and Deficits, Quarterly Journal of Economics, vol. 113, pp. 949–963, August, 1998. [ Links ]
6. Calderón, C. A.; Duncan, R.; Schmidt-Hebbel, K. Institutions and Cyclical Properties of Macroeconomic Policies, working paper, no. 285, Banco Central de Chile, 2004. [ Links ]
7. Cárdenas, M.; Mejía, C.; Olivera, M. La economía política del proceso presupuestal en Colombia, working paper, no. 31, Fedesarrollo, 2006. [ Links ]
8. Comisión de Racionalización del Gasto y las Finanzas Públicas. Informe final, Ministerio de Hacienda y Crédito Público, 1997. [ Links ]
9. Comisión del Ingreso Público. Informe final, Fedesarrollo, 2002. [ Links ]
10. Crespo, J.; Silganor, M.: Reitschuler, G. The Fiscal Smile: The Effectiveness and Limits of Fiscal Stabilizers, working paper, no. 03/182, Fondo Monetario Internacional, 2003. [ Links ]
11. Gali, J. Government Size and Macroeconomic Stability, European Economic Review, vol. 38, no. 1, January, pp. 117- 132, 1994. [ Links ]
12. Gavin, M.; Hausmann, R.; Perotti, R.; Talvi, E. Managing Fiscal Policy in Latin America and the Caribbean: Volatility, Procyclicality, and Limited Creditworthiness, working paper, no. 326, InterAmerican Development Bank, 1994. [ Links ]
13. Gavin, M.; Perotti, R. Fiscal Policy in Latin America, in B. S. Bernanke and J. Rotemberg (eds.), NBER Macroeconomics Annual, Cambridge, MIT Press, 1997. [ Links ]
14. Girouard, N.; Andre, C. Measuring Cyclical-Adjusted Budget Balances for OECD Countries, working paper, no. 434, Organization for Economic Corporation and Development, 2005. [ Links ]
15. Hodrick, R.; Prescott, E. Postwar U.S. Business Cycles: An Empirical Investigation, Journal of Money, Credit and Banking, vol. 29, no. 1, February, pp. 1-16, 1997. [ Links ]
16. Hommes, R.; Montenegro, A.; Roda, P. Una apertura hacia el futuro, balance económico 1990-1994, Ministerio de Hacienda y Crédito Público, Departamento Nacional de Planeación, Fondo Financiero de Proyectos de Desarrollo. [ Links ]
17. Kaminsky, G.; Reinhart, C.; Vegh, C. When it Rains It Pours: Procyclical Fiscal Policy and Macroeconomic Policies, working paper, no. 10780, Cambridge, National Bureau of Economic Research, 2004. [ Links ]
18. Lozano, I.; Aristizabal, C., Déficit público y desempeño económico en los noventa: el caso colombiano, Desarrollo y Sociedad, no. 52, pp. 67-97, september, 2003. [ Links ]
19. Manasse, P. Procyclical Fiscal Policy: Shocks, Rules, and Institutions A View From MARS, working papers, no. 06/27, International Monetary Fund, 2006. [ Links ]
20. Perotti, R. Fiscal Policy in Good Times and Bad, Quarterly Journal of Economics, vol. 114, no. 4, pp. 1399-1436, 1999. [ Links ]
21. Perotti, R. Estimating the Effects of Fiscal Policy in OECD Countries, Innocenzo Gasparini Institute for Economic Research, March, 2004. [ Links ]
22. Rincón, H.; Berthel, J.; Gómez, M. Balance fiscal estructural y cíclico del Gobierno nacional central de Colombia, 1980-2002, Ensayos sobre Política Económica, no. 44, December, pp. 12-62, 2004. [ Links ]
23. Salazar, N.; Prada, D. Balance estructural del Gobierno en Colombia, Archivos de Economía , documento 26, DNP, 2003. [ Links ]
24. Silgoner, A.; Reitschuler, G.; Crespo-Cuaresma, J. The Fiscal Smile: The Effectiveness and Limits of Fiscal Stabilizers, working paper, no. 182, International Monetary Fund, 2003. [ Links ]
25. Talvi, E.; Végh, C. Tax Base Variability and Procylical Fiscal Policy, working paper, no. 7499, Cambridge, National Bureau of Economic Research, 2000. [ Links ]
26. World Bank. Colombia: Public Expenditure Review, mimeo, March, 2004. [ Links ]

