


Services on Demand
Journal
Article
 English (pdf)
 Article in xml format
 Article references
 Send this article by e-mail
Indicators
-
 Cited by SciELO
 -
 Access statistics
Related links
-
 Cited by Google
 -
 Similars in
SciELO
Similars in
SciELO -
 Similars in Google
Share

 Permalink
Ensayos sobre POLÍTICA ECONÓMICA
Print version ISSN 0120-4483
Ens. polit. econ. vol.32 no.spe73 Bogotá Jan. 2014
Leverage Pro-cyclicality and Bank Balance Sheet in Colombia*
Prociclicidad del apalancamiento y balances de los bancos en Colombia
Franz Hamanna,**, Rafael Hernándezb, Luisa Silvac, and Fernando Tenjo G.d
* The views expressed in this document are those of the authors and not necessarily those of the Banco de la República. Of course, any mistake in this paper is our responsibility.
a Advisor to the Governor, Banco de la República, Bogotá, Colombia
b Research Assistant, Centro de Estudios sobre Desarrollo Económico (CEDE), Universidad de los Andes, Bogotá, Colombia
c Head of the Financial Sector Unit, Banco de la República, Bogotá, Colombia
d Ex-Director, Monetary Policy Board, Banco de la República, Bogotá, Colombia
** Corresponding author. E-mail address: fhamansa@banrep.gov.co (F. Hamann).
History of the article:Received May 16, 2013 Accepted January 28, 2014
ABSTRACT
The recent financial crisis has renewed the interest of economists, both at the theoretical and empirical level, in developing a better understanding of credit and its mechanisms. A rapidly growing strand of the literature views banks as facing funding restrictions that condition their borrowing to a risk-based capital constraint which, in turn, affects bank lending. This work explores the way banks in Colombia manage their balance sheet and sheds light into the dynamics of credit and leverage over the business cycle. Using a sample of monthly bank balance sheets for the period 1994-2011, we find not only that leverage is predominantly pro-cyclical in the Colombian banking sector, but also that heterogeneity matters, and thus, an aggregate measure of bank leverage can mask a fragile financial sector. In addition, although some banks display great dynamics on the right-hand side of their balance sheet during the upward phase of the leverage cycle, changes in the composition of liabilities between core and non-core do not seem to have a clear pattern. Still, more attention should be paid on this by policy makers, as these dynamics could convey information about the phase of the cycle of the economy and the financial vulnerability of the system as a whole.
Keywords: Banks, Credit, Leverage, Non-core liabilities, Balance sheet, Business cycle, Colombia.
JEL Classification: E44, E52, G21, E32, G21, G32.
RESUMEN
La reciente crisis financiera ha renovado el interés de los economistas, tanto a nivel teórico como empírico, en E32 desarrollar un mejor entendimiento del crédito y sus mecanismos. Una rama de rápido crecimiento en la G21 literatura considera que los bancos enfrentan restricciones de financiamiento que condicionan su endeudamiento a una restricción de capital basada en el riesgo que asumen, y que a su vez, afecta la oferta de crédito. Este trabajo explora la forma en que los bancos en Colombia manejan sus balances y arroja luz sobre las dinámicas del crédito y el apalancamiento durante el ciclo económico. Utilizando una muestra de balances mensuales de los bancos para el período 1994-2011, encontramos no sólo que el apalancamiento del sector bancario colombiano es predominantemente procíclico, sino también, que la heterogeneidad importa, y por Pasivos non-core tanto, una medida agregada de apalancamiento puede estar ocultando un frágil sistema financiero. Además, Hoja de balances aunque algunos bancos muestran una gran dinámica en el lado derecho de sus balances durante la fase Ciclo económico ascendente del ciclo de apalancamiento, los cambios en la composición de los pasivos entre core y non-core no parecen tener un patrón claro. Aun así, se debe prestar más atención a este tema por parte de los hacedores de política, ya que estas dinámicas pueden proveer información sobre la fase del ciclo de la economía y la vulnerabilidad financiera del sistema como un todo.
Palabras clave: Bancos, Crédito, Apalancamiento, Pasivos non-core, Hoja de balances, Ciclo económico, Colombia.
Clasificación JEL: E32, G21, G32.
1. Introduction
This paper explores the way banks in Colombia manage their balance sheet and sheds light into the dynamics of credit. The idea is to see whether the link between credit dynamics, leverage and liability composition explains credit supply decisions. Evidence in this direction would help to understand credit fluctuations, identify possible signs of pro-cyclicality, and advance in the elaboration of a more appropriate view of the banking sector. This view is centered in the structural relationships between the two sides of the balance sheet, and would be a considerable improvement from the traditional interpretation that goes, mechanically, from money to credit. By using bank-level data, this work pays particular attention to the importance of heterogeneity within the banking system and the role it plays in the evolution of credit in the economy.
The recent financial crisis has renewed the interest of economists, both at the theoretical and empirical level, in developing a better understanding of credit and its mechanisms. A growing number of studies, drawing on a tradition that underscores the inherent instability of credit systems, show that credit lies at the heart of financial crises and that the latter may be the endogenous outcome of how credit is created in the context of decisions of numerous and heterogeneous agents (see Aikman et al., 2011, Jorda et al., 2011, and Taylor, 2012).
Very briefly, the inherent instability of credit results from the feedback between credit fluctuations and changes in collateral prices. This relationship is best approached in terms of what is known in the literature as leverage cycles (Geneakoplos, 2009; Jorda et al., 2011).
Various strings and lines of research can be pursued in order to test the validity of these ideas and try to find empirical support for them under different scenarios. Among such lines, the present paper follows recent strands of the literature that directly connect the dynamics of credit to the behavior of banks, going beyond mere quantities and looking at their entire balance sheet, including assets, liabilities, their composition, and leverage (Shularick and Taylor, 2010).
More specifically, recent interesting work builds on a formal model in which financial intermediaries manage their balance sheet in a way that is consistent with, and responds to, their credit supply decisions (see Adrian and Shin, 2010, Adrian and Boyarchenko, 2012, Adrian and Shin, 2011, and Adrian and Shin, 2012). The model in question is, briefly put, a model of credit supply and credit risk, where a bank maximizes profits subject to a value-at-risk constraint. This means that banks, and financial intermediaries in general, face funding restrictions that condition their borrowing to a risk-based capital constraint which, in turn, affects bank lending. Changes in the size and composition of balance sheets are derived from credit decisions taken by banks. Thus, there is a "lending" or "balance sheet capacity" of banks determined by risk and regulatory considerations, and banks expand their lending so as to make full use of this capacity when risk perceptions improve. As this happens, balance sheets grow, leverage increases and lending standards deteriorate. In other words, pro-cyclical leverage is closely tied to a risk-based capital constraint.
Along these lines, Hahm et al. (2011b) explain how lending booms coincide with changes in the compositions of bank liabilities or shifts from "core" (basically retail deposits) to "non-core" liabilities. The nature of non-core liabilities varies from country to country and depends, among other things, on the characteristics of the financial sector and the nature of the credit system. Some key insights about the notion of non-core liabilities in the literature can be highlighted briefly. What lies in the background of these ideas are two basic findings of previous research:
-
In credit booms, increases in lending outstrip the funds available to banks through retail deposits of household savers, or core liabilities, and banks have to resort to other types of funding.
-
This funding, which comprises non-core liabilities, is closely linked to financial vulnerability.
In light of these findings, the expansion of balance sheets, driven by the need to use up the enlarged lending capacity that results from more favorable measured risk perceptions, moves banks to resort to other sources of funding different from core liabilities, as the latter do not respond speedily enough to the needs of banks. Credit (or the size of the balance sheet), leverage and the composition of bank liabilities are thus part of the same process.
In the case of emerging market economies, which is the focus of the paper by Hahm et al. (2011b), banks are the most important financial intermediaries and wholesale funding markets are not well developed. For these economies the authors underline the crucial role of international capital flows and short-term funding in foreign currency as a key component of non-core liabilities of banks, as well as the changes in their weight across the various phases of credit cycles.
The relevance of the link between credit dynamics and liability composition has also been highlighted by other authors. For example, Schularick and Taylor (2010) show how, for a sample of developed countries, the upward trend observed since 1945 in the ratio of bank assets to broad money is the other side of a simultaneous increase in funding of banks via non-monetary liabilities. Shin (2011a), on his part, finds that monetary aggregates, to the extent that they reflect the size of non-core and core liabilities, convey information on the stage of the financial cycle. Kim et al. (2012) study the relationship between cross-border banking and the composition of monetary aggregates in terms of core and non-core liabilities of banks. The authors derived from here information signaling vulnerability to financial crises.
The above setting has also been successfully applied in empirical studies of scenarios that may give rise to credit booms, financial instability and, eventually, financial crises. The key concept here is pro-cyclical leverage, a phenomenon that derives from the behavior of banks in their credit supply decisions along the lines of the model referred to above (Shin, 2011a; Adrian and Shin, 2012, and Adrian and Shin, 2010).
Hahm et al. (2011a), using aggregated information for a sample of emerging and developing economies, analyze the link between various definitions of non-core bank liabilities and different measures of crises. The authors find that non-core liabilities have a strongly predictive power for both currency and credit crises. These results indicate that credit booms are reflected in the composition of liabilities. In a related exercise, focused on pro-cyclicality of leverage in the Canadian banking system, Damar et al. (2012) find that banks that rely more on non-core liabilities (wholesale funding) exhibit a higher degree of leverage pro-cyclicality. Non-core liabilities are a sign of vulnerability in banks' balance sheets. Studies that rely on bank-level data, as is the case of this paper, are particularly suitable to exploit heterogeneity within the banking sector when conducting analyses of how banks manage their balance sheets. For these purposes, it is clear that heterogeneity refers to differences in the way banks manage their portfolio (Adrian and Shin, 2010). Two types of banks or bank behavior can be identified depending on the relationship between leverage and assets or balance sheet size:
- Banks that seem to target a constant leverage ratio.
- Banks that exhibit pro-cyclical leverage or a positive relationship between changes in leverage and changes in total assets.
This heterogeneity in balance sheet management practices has been linked in the literature with the degree of reliance on the capital market and mark-to-market practices. Pro-cyclical leverage might have more incidence in market-based than in bank-based credit systems (see Damar et al., 2012, for Canada, and Adrian and Shin, 2010, for the USA). In Colombia, with a credit-system centered in banks, bank heterogeneity, as defined above, could be explained from differential access to markets for funding (bank size, for example). This issue will be dealt with in the paper. The division of banks into those that target a leverage ratio and those with pro-cyclical leverage should not blur the fact that leverage ratios vary widely both between banks and in time, depending on the different phases of the business cycle.
2. Data and Empi rical Regularities
The empirical analysis of the role of leverage in the dynamics of credit and bank assets conducted in this paper, relies on a balanced panel data set which consists of financial intermediaries operating in Colombia from January 1994 to December 2011. We use monthly data that capture the highest available frequency at which we can study the interaction of macroeconomic variables (economic activity, inflation and interest rates) with banks' balance sheet information.
2.1. Sample
Bank balance sheet data come from the Unique Accounting Plan (PUC) of the Financial Superintendence, which contains specific balance-sheet information of all banks. Our database contains detailed accounting information of 29 banks, all grouped in what we call "consolidated banking system". We excluded Special Financial Entities (EFE's) to avoid double accounting in loans, but also Financial Cooperatives, Financial Corporations, and Commercial Financing Companies, and focus on banks, the core of our analysis.
We end up with a panel data which is large across time but small across agents. The long sample period includes two credit booms, as defined in Guarín et al. (2013), as well as other structural macroeconomic and policy regime changes. The years 1994 to 1998 were characterized, as in many emerging countries, by a macroeconomic boom after the structural reforms (including a trade and capital account liberalization), and the stabilization programs of the beginning of the 90s: widening fiscal and external deficits, rapid credit, investment and consumption growth, and soaring asset prices, in a heavily intervened foreign exchange market with shallow financial markets. The South East Asia financial crisis led to a Sudden Stop of capital inflows and affected Colombia with particular strength. Currency, financial and macroeconomic crises hit the economy in 1999 with protracted effects. The financial crisis of the end of the 90s was characterized by the failure of many financial institutions, as Gómez-González and Kiefer (2009) recount. After failures, mergers, and acquisitions, the financial system shrank from 39 commercial banks in 1998 to 27 three years later.
By 1999, the country allowed the exchange rate to float more freely and embarked in a fiscal consolidation process. And by 2001, Colombia adopted an inflation targeting regime and strengthened financial regulation, to mention a few important changes. Five years later, the economy was growing at the fastest pace in decades, public debt appeared sustainable, the financial sector showed no evident signs of weakness, and inflation was low and stable. When the global financial crisis hit the economy, it almost stopped growing in 2009 and the currency depreciated temporally, but there was no financial crisis.
Despite all these significant changes, we did not restrict the sample across time to concentrate in a particular period, as we want to focus on the dynamics of bank balance sheets and leverage along the business cycle. As we will explain in the model specification section, we will do our best to control for several of these factors, in particular the monetary policy regime change.
Instead, we chose to restrict our sample across banks. We did so because the sample is not large and homogeneous enough to perform statistical inference with a great deal of confidence along that dimension, and using that information could bias our analysis. For instance, there are four big banks that hold in average sixty percent of the banking system total assets during our sample period, and thus dominate the industry. This means that the rest are medium and small banks, the latter being quite specialized institutions. This has been particularly evident in the last ten years, period that has seen the appearance of many small and specialized banks, such as the WWB Bank, which focuses on women entrepreneurs, and many others that specialize in micro and small enterprises. Balance-sheet accounts and management of these banks are quite different from other banks, and may thus introduce noise and outliers to our analysis, specially considering our small sample across individuals. We addressed this problem by grouping the banks that in April 2012 had a share of the consolidated banking system assets of less than 2.5%, in what we call "Small Banks", accounting for 5% of total assets.1
One bank deserves special treatment: Banco Agrario. It was created in 1999, following the liquidation of Caja Agraria, a public financial institution focused on the agricultural sector that had to be intervened as a result of malpractices and mismanagement. The transfer of assets and safe loan portfolio to Banco Agrario was likely to impact its leverage during this period. Furthermore, data available for this bank before 1999 include 53 out of 60 months where equity, and thus leverage, were negative, reaching a trough in August 1994, when the leverage ratio was –564.2. Atypical observations like this are not an indicative of the debt and other liabilities that a bank uses to finance its assets, and would bias the consolidated banking system leverage in this period, calculated as a weighted average (by assets) of the leverage of all banks.
In addition, Banco Agrario is the only bank in the database that is fully owned by the state, as 99% of its stocks shares are held by the Treasury. This bank is affiliated to the Ministry of Agriculture and Rural Development and it is arguable that its balance-sheet accounts are not marked to market as they may not reflect the bank's current financial situation, specially for the period before 2000. Also, the bank may be prone to allocate resources differently from the rest of the banks in the sample, as was the case of the extinct Caja Agraria for a long period of time. Thus, to avoid all these non-market factors, and the ones inherent to any liquidation, we kept Banco Agrario out of the analysis.
Finally, the total sample was controlled by all mergers and acquisitions that took place between 1994 and 2011. In particular, the sample of 14 banks was obtained as if each entity currently observed would have existed as a single one over the period under study. So, if a bank made purchases from other entities or had a merger, all entities involved were treated as one under the period in question. This grouping of banks and the exclusion of Banco Agrario left us with a sample of fourteen banks, four of them classified as foreign: Santander, Citibank, Sudameris, and BBVA. Overall, the data set contains 3024 bank-month observations.
2.2. Leverage
A key variable in our analysis is bank leverage. We measure the leverage ratio of bank i at date t as li,t = ai,t /ei,t, where ai represents the bank's total assets and ei its equity. The leverage of "Small Banks" was calculated by first changing the months of negative leverage to missing values. Assets for these months were considered to be zero. Leverage for each month in the sample was then calculated as an asset weighted average of the leverage of each of the sixteen small bank observations:

where litS = aitS / eitS denotes the leverage ratio of a bank i (that has been classified as small) at time t, ais denotes its assets, and eis its equity; ωis is the share of the assets of the small bank i within the group of "Small Banks". It is worth noting that when equity is negative, we set the assets of negative-leverage months to zero. Consolidated banking system's leverage was calculated in a similar way, as an asset weighted average of the leverage of the 14 banks in the sample, excluding Banco Agrario.
2.3. Non-core Liabilities
The second key and perhaps less known variable in the analysis is non-core liabilities. As stated earlier there is no single definition of this variable and it varies from country to country, depending on the structure of the banking and financial systems. This paper uses a working definition of core and non-core liabilities that fits with the type and development of the banking sector in Colombia. This definition has been drawn from a wider and growing literature that aims at building a better understanding of balance sheet management, bank liability composition and financial vulnerability.
For example, Adrian and Shin (2011) analyze balance sheet management by commercial and investment banks in developed economies with a capital market-based credit system, and stress that in such cases non-core liabilities are basically made up of wholesale funding, in particular repurchase agreements and commercial paper. The authors find that rapid asset growth and greater reliance on non-core liabilities are closely related to systemic risk and interconnectedness between banks.
The notion of non-core liabilities for an emerging economy may be different. Kim et al. (2011) study the problem of liability composition in open economies with bank-based credit systems, with a particular emphasis in Korea. In addition to stressing the links between the relative importance of non-core liabilities and financial pro-cyclicality, the work underlines those between these liabilities and the compression of risk premiums in the credit market. When discussing measures of non-core liabilities, the authors opt for a criterion based on the holder rather than on the type of the liability in question, and emphasize the importance of liabilities to foreign creditors in the definition of non-core liabilities of banks in open emerging economies.
A first general definition of non-core liabilities in these economies would then be the sum of wholesale bank funding and foreign exchange liabilities. In the case of Korea, this comprises six categories of bank liabilities: foreign exchange borrowing, debt securities, repurchase agreements, promissory notes (two types), and certificates of deposit.
For their analysis of the potential of non-core liabilities to predict vulnerability to crises for a sample of countries, the authors use two definitions:
-
Non-core 1: liabilities of banks to the foreign sector + liabilities of banks to the non-banking financial sector.
-
Non-core 2: liabilities of banks to the foreign sector + (M3 - M2).
Shin (2011b) further elaborate on the justification for including liabilities to foreign creditors as part of non-core liabilities of banks in open emerging economies. The argument runs in terms of the volatility of the various types of bank liabilities. Whereas claims to the household sector or retail deposits, which depend on household wealth, tend to be stable, wholesale funding exhibits a high degree of volatility. In emerging economies open to capital flows, short-term foreign-currency denominated bank liabilities, usually very volatile, play a central role in credit booms and should be included as part of non-core liabilities. With foreign exchange liabilities and wholesale bank funding as comprising non-core liabilities, the authors find that the latter are closely related to measures of risk appetite, such as credit spreads.2
Hahm et al. (2011a) show that the composition of bank liabilities has evolved from country to country and across time. The close link that exists between monetary aggregates and bank liability composition, that characterizes bank-based credit systems, is not observed with the same strength in countries with capital market-based credit systems, in which wholesale funding has been gaining importance vis-à-vis deposit-based funding. As a result of the rapid evolution of financial systems in the recent past, there has been a move to greater reliance on interbank markets, commercial paper and asset-backed securities in the funding of banks.
In the case of open emerging economies, as mentioned above, the growing incidence of international capital flows explains the role of foreign currency denominated liabilities of banks in these economies, with crucial implications for financial stability considerations and macroprudential policies.
Along these lines, the authors put forward the hypothesis that the degree of financial pro-cyclicality is amplified by the expansion and shrinkage of non-core liabilities. To test this hypothesis, they apply to the Korean banking system a definition of core liabilities as liabilities due to an ultimate domestic creditor, and of non-core liabilities as those due to either an intermediary or to a foreign creditor, and obtain interesting findings:
-
Greater GDP elasticity of non-core versus core bank liabilities.
-
A semi-elasticity of non-core bank liabilities with respect to contemporaneous policy rate that is not statistically different from zero, while the corresponding semi-elasticity for core liabilities is high, significant, and has a negative sign. This, the authors argue, calls into question the role of domestic monetary policy in containing excessive growth in non-core liabilities.
-
A negative and statistically significant semi-elasticity of non-core bank liabilities with respect to US policy rate, which means that global liquidity conditions play an important role in the build up of non-core liabilities in the upward phase of credit cycles.
Kim et al. (2011) explore the extent to which an interest rate-oriented monetary policy framework accelerates financial pro-cyclicality through the provision of high-powered money on an on-demand basis aimed at keeping short-term interest rates as close as possible to the policy rate. For this the authors define core assets of banks as claims on the private sector, and non-core bank liabilities as bonds, liabilities to other banking institutions, foreign liabilities, etc. They conduct an econometric exercise for 14 countries (Colombia included) for the period 2002-2009. The work finds that increases in non-core liability growth have a positive effect on core asset, monetary base and M2 growth. The authors conclude from here that, when the central bank increases the money supply, private credit via non-core liabilities increases rapidly. In general, the finding of the paper is that non-core liabilities contribute to explain growth of both private credit and monetary aggregates.
To test the hypothesis of non-core liabilities as potential accelerators of the pro-cyclicality of banks, we first need to embrace a definition of this type of liabilities. Thus, we first measure core liabilities (at the bank level) as all the deposits included in the broad money supply (M3), except for CDT and bonds in domestic currency. These last two items are subject to reserve requirements but are marketable and, therefore, part of the non-core liabilities. CDT and bonds in both domestic and foreign currency and liabilities denominated in foreign currency are then part of non-core liabilities.3
We will use this definition of core and non-core liabilities throughout the paper, but we have also considered two other alternative definitions, for two reasons. The first one is that, as previously mentioned, there is no unanimity with respect to a definition of these liabilities in open emerging economies with bank-based credit systems. The second one is that we would like to be sure that our findings are robust to the criterion used to classify liabilities between core and non-core.
The first one of these alternative measures is very similar to the main definition, except that takes CDTs in domestic currency as part of core liabilities, because despite being tradeable, these liabilities are commonly used by Colombian households and firms as a saving instrument, and thus tend to be very stable. But we can be more precise, and distinguish CDTs by their type of holder. There are CDTs owned by large investors, which will be classified under non-core liabilities, and the reamining balance of CDTs will be taken as part of core liabilities. This comprises our second alternative definition of core and non-core liabilities. We should note, however, that the last differenciation can only be made from May 2002 onwards, an thus imposes a limitation for the comparison with the other measures.
We did not consider the following items as part of either core or non-core liabilities: liability position in derivatives (code 23 of PUC), liabilities with other domestic and foreign banks and international organizations in domestic currency (code 24 of PUC), estimated liabilities and provisions (code 28 of PUC), and bonds mandatory convertible into shares (code 29 of PUC).
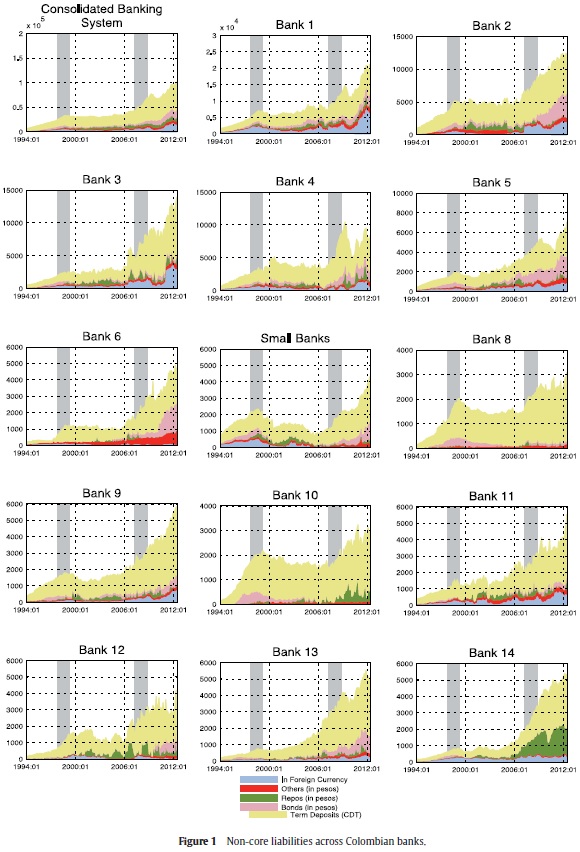
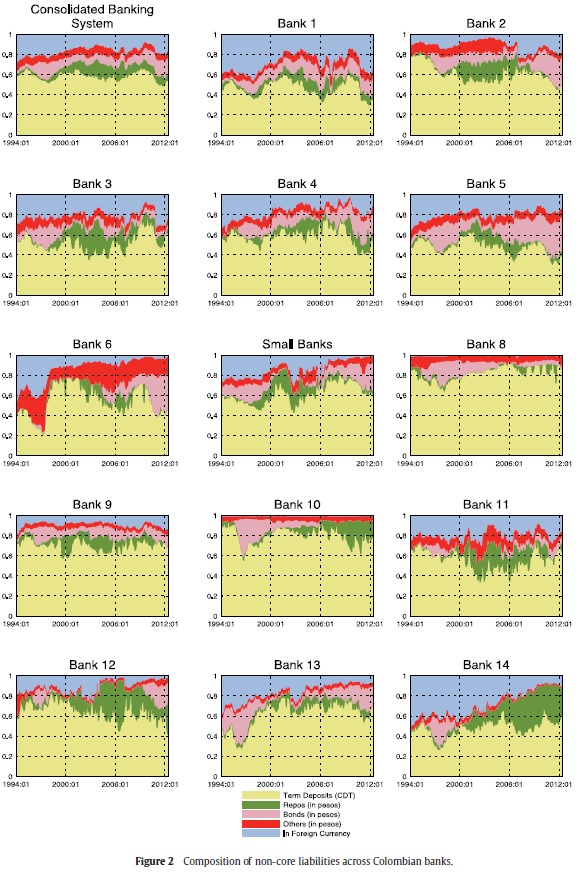
While Figure 1 shows the evolution of non-core liabilities4 of Colombian banks in the last two decades, Figure 2 presents their main components. It is quite clear that the importance of non-core liabilities has increased in the last two decades and that they appear to exhibit a cyclical pattern. Once again, we also see that there is a wide dispersion across intermediaries regarding the evolution of alternative financing instruments, which may reflect their different financial management policies, attitudes towards risk, access to different markets, among other aspects. We study these issues in more detail in the next section.
2.4. Some Stylized Facts
To try to overcome the fact that our sample is small across banks, we do not rely exclusively on the results of our estimated econometric model. Before diving into the econometrics, we perform different quantitative exercises to illustrate the importance of bank heterogeneity in understanding the dynamics of balance sheet management and credit.
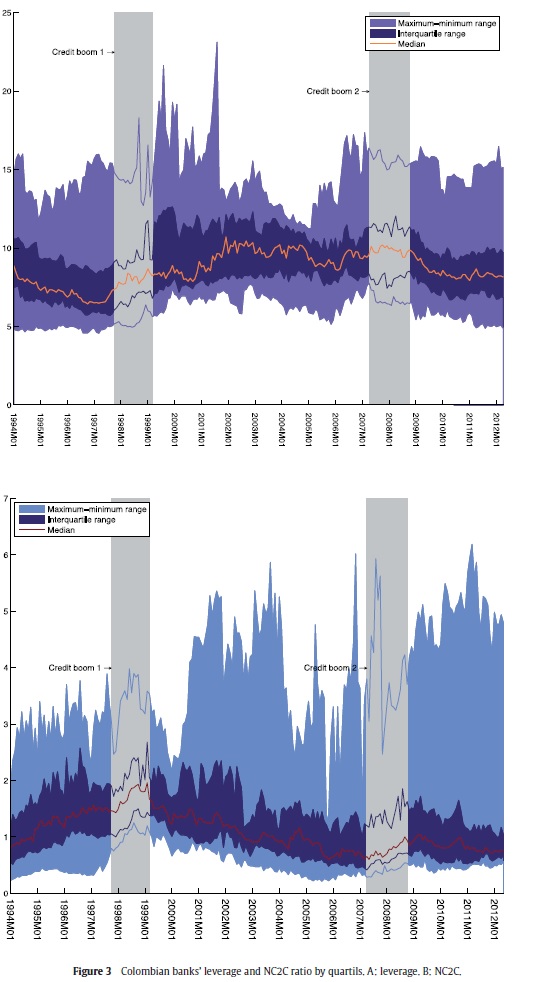
Many studies take the aggregate leverage as an indicator of the degree of financial "heat" in the banking system and the economy. A quick look at the evolution of the distribution of banks' leverage, presented in panel (a) of Figure 3, shows at least the following facts:
-
While the 1994-2011 median fluctuates around 8.8, the upper quartile of the distribution almost doubles this figure and the lower quartile is a small fraction of it.
-
Measured as either the inter-quartile range or as the max-min difference, leverage dispersion decreased between 2001 and 2005, period in which new financial regulation was introduced, but has increased thereafter.
-
Leverage dispersion increased during the two credit boom episodes (1997:10-1999:03 and 2007:04-2008:10) as well as during the previous months.
A similar pattern can be traced when we inspect the composition of liabilities, measured as the ratio of non-core to core liabilities, in the panel (b) of Figure 3:
-
The median of this ratio fluctuates between 0.6 and 2. This means that the value of non-core liabilities expand and contracts significantly and quickly.
-
The dispersion, measured as either the inter-quartile range or as the max-min difference, is also large and volatile. The upper quartile more than doubles the median and the lower one can at times be half of it.
-
Prior to the first credit boom (1997:10-1999:03) and during its development, non-core liabilities dispersion grew and became larger.
-
After the crisis, dispersion was reduced for a short period of time but increased again coming into the second credit boom (2007:04-2008:10). During the development of the last, it stayed large and even increased more in the afterwards of the boom.
This suggests that there is a wide dispersion in the degree of leverage between banks as well as in the composition of their liabilities. Focusing exclusively on central tendency measures may be misleading, since highly leveraged intermediaries co-exist with low-leveraged ones. This reinforces our prior that studying bank balance-sheets in detail may be a fruitful avenue to gain a deeper understanding of the business cycle.
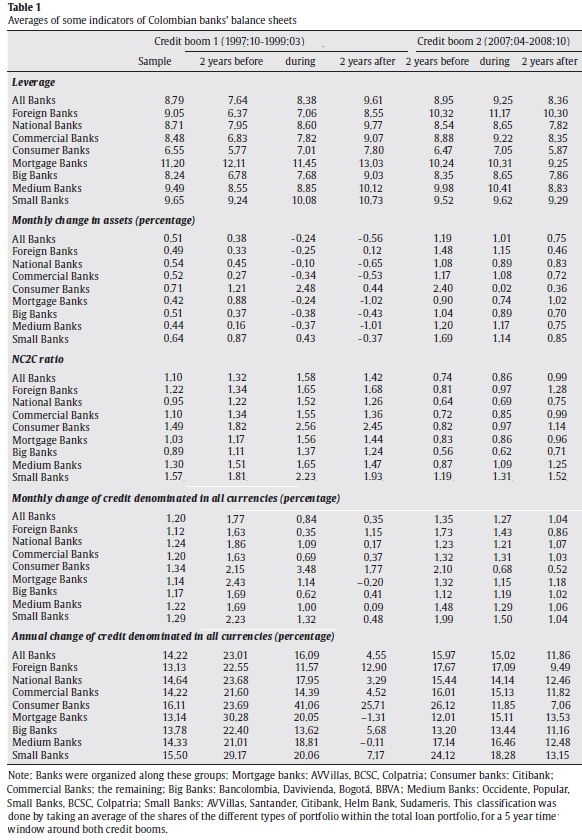
As a first approximation to the relationship between leverage, bank liability composition and the credit cycle, we start by classifying banks by ownership (foreign or national), size (share in total assets) and business segment (commercial, consumer or mortgage loans). For each group we compute the leverage ratio, the monthly growth rate of total assets, and the non-core to core liabilities ratio. Also, across time, we split the sample in three: the full period 1994-2011 and the two credit booms. Furthermore, we take not only those months of the credit booms but also a two-year window before, and after each boom. Table 1 shows the results. From the calculations we observe at least the following facts:
-
The average leverage ratio for the banking system is 8.79 and there is no prominent difference in the 1994-2011 average leverage by nationality or the size of banks. Nonetheless, there are differences by business segment: mortgage banks have an average leverage of 11.20, commercial banks of 8.48 and consumer banks of 6.55. These differences do not change during nor around the two credit booms.
-
The average monthly growth rate of total assets (in real terms) for the banking system during the period of study is 0.51%. There are no significant differences by nationality, size or business segment. This is expected to be so since asset (month-to-month) growth displays large volatility. From the behavior of this variable one can see that the two credit booms were different. While the first boom was preceded by rapid mortgage and consumption loans and a collapse of credit afterward (specially of mortgage's), the second was preceded by rapid consumption and commercial credit growth and was not followed by a collapse in credit.
-
The 1994-2011 average non-core to core liabilities ratio of the banking system is about one. In foreign consumer-loan oriented banks it tends to be higher than in national commercial and mortgage oriented banks. Furthermore, small and medium banks clearly show (on average) a larger share of non-core liabilities. In the case of medium banks, one could think that this number is biased upward if failed institutions within "Small Banks" Note that the group of "Small Banks", as defined in section 2.1, is in fact a medium bank in terms of size. It holds on average 4.9% of total assets of the banking system, while small banks in the classification discussed in this section hold between 2.5% and 4.1% of total assets. experimented an unprecedented increase in non-core liabilities just before their failure. As shown in Figure B.1 of Appendix B, this was not the case, as financial institutions that disappeared during the sample (all belonging to "Small Banks"5, didn't displayed an increase in non-core liabilities before they disappeared.
A natural question to ask is whether these differences across types of banks reveal alternative ways to manage balance sheets and how these practices are related to credit dynamics. As pointed out by Adrian and Shin (2011) for the United States, balance sheet management of financial intermediaries reveals that equity is sticky and the asset size of the bank is determined by the degree of leverage. The logic is that, if by definition, the leverage of bank i at time t is:

leverage growth of bank i, gli , is (approximately):

were gita = log ait - log ai,t-1 and geit = log eit - log ei,t-1
If equity is sticky (or fixed) for whatever reason, gite = 0 and changes in the size of the balance sheet of the bank will reflect leverage growth. A key feature of the banking sector is that assets are pro-cyclical (grow fast in booms and grow less or decrease in recessions) and their variation over the business cycle reflect not only better perspectives of positive net present value projects but also shifts in banks' willingness to take on risky positions. In the next section, we will develop an econometric model to see whether this prociclicality of leverage also holds for the colombian banking system, and also will try to derive common patterns for this behaviour across banks.
But before moving on, there is another perspective about the fluctuations of leverage across the business cycle and its relationship with bank balance sheet. During booms, leverage capacity increases not only due to the greater profitability of bank capital but also because measured risk (for each unit of capital) falls. As Adrian and Shin (2011) point out, a higher "balance sheet capacity" translates in a higher credit supply, which needs to be funded. Thus, banks need to increase their liabilities. Since core deposits are usually long-term and stable sources of funding which change at a lower frequency than that of the business cycle, intermediaries tap other financing windows (i.e. non-core liabilities). Therefore, non-core liabilities should grow more rapidly than core liabilities.
Figures 4 and 5 present the evolution of aggregate credit and non-core liabilities in Colombia for the period 1994-2012. Here, we use our main measure of non-core liabilities at the aggregate level that includes, as discussed earlier, liabilities denominated in foreign currency and CDT and bonds in domestic currency. Panel (a) of Figure 4 shows the evolution of credit as a share of GDP from 1994 to 2012. In addition, while panel (c) adds to the previous one the share of non-core liabilities to GDP, panel (b) shows the annual growth rate of the credit-to-GDP ratio. Panel (d) is a scatter plot of credit against non-core liabilities, both as shares in GDP. In Figure 5 we document the association between credit and non-core liabilities using alternative measures, mainly growth rates of these ratios.
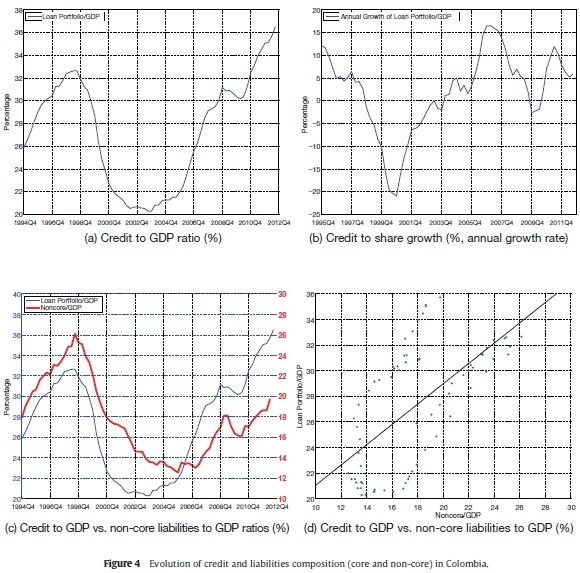
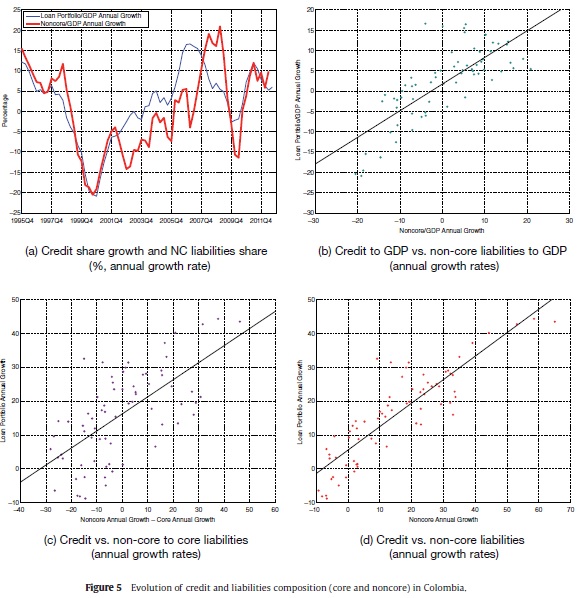
The results point in the direction that there is a positive relation ship between the level and the growth rates of credit and non-core liabilities. The relationship remains strongly positive even when measured as a share of GDP or in growth rates of the variables of interest.
A quick inspection of these figures leads us to observe that credit and non-core liabilities have a strong association during the different phases of the credit cycle. We can see a clearer dynamic association between these variables if we use cross-correlograms. Figures 6 and 7 show the cross-correlograms between the ratio of non-core to core liabilities and the growth rate of total assets (Figure 6), as well as the growth rate of credit (Figure 7). Values to the right of zero in the correlograms correspond to lags, while those to the left correspond to leads. We compute these cross-correlograms for the aggregate sample of banks and classifying them by nationality, predominant business segment and size.
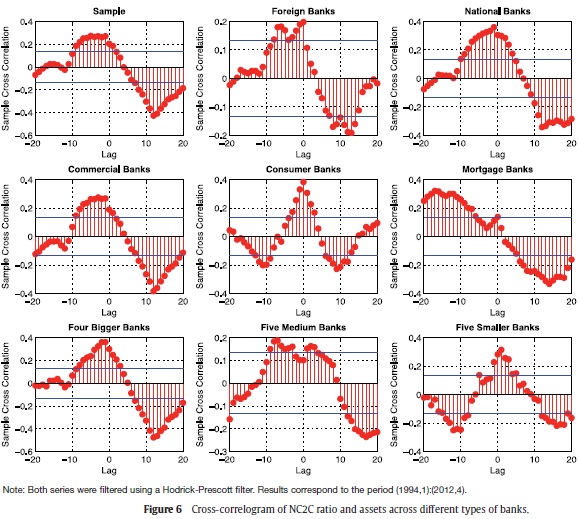
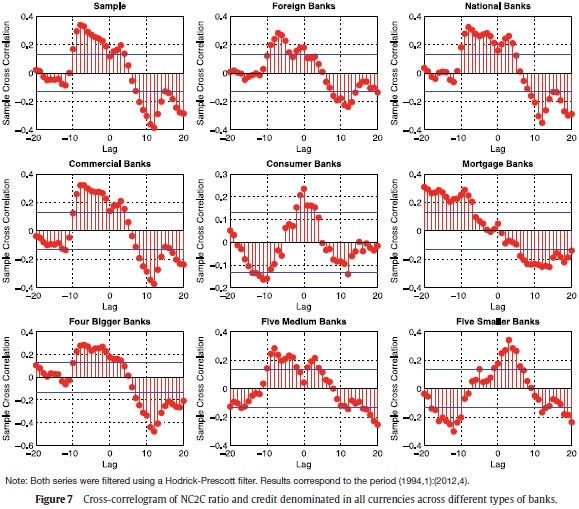
From these figures we highlight the following facts concerning the dynamic behavior of non-core liabilities along the credit cycle:
-
There is a positive correlation between contemporaneous and lagged non-core to core liabilities (around lag two) and total assets growth for the aggregate full sample, as well as for national banks. Non-core liabilities expand in tandem with assets.
-
There is a positive correlation between total asset growth and non-core to core liabilities ratio several months ahead. That is, faster credit growth today is not only associated with a contemporary expansion in the composition of banks' liabilities, but also with future expansions that tend to persist for several months ahead.
-
Furthermore, higher credit growth periods are anticipated by low non-core to core liabilities ratios in a monthly window of six to twenty months, depending on the type of banks. The negative correlation lags go back up to ten months for commercial banks and even longer than fifteen months for mortgage banks. Among consumer-credit-oriented banks the correlation is less strong.
-
These patterns are stronger for large and medium-sized banks. Smaller banks exhibit a different pattern.
All our previous analysis describes plain empirical regularities. In the next section, we aim to formalize these findings through an econometric credit supply model.
3. Econometric Model
As mentioned in Section 2, we have a panel dataset where the cross-section dimension (N) is small, and the time series dimension (T) is large. Thus, traditional panel estimation techniques are not the best approach to study the relationship we emphasize, that between credit supply and balance sheet management. This is so because panel estimation tools are heavily dependent on the assumption of T fixed and N growing without bound, in which case one can conveniently assume independent, and identically distributed onbservations (i.i.d), and focus on the asymptotic properties of estimators to approximate their finite sample properties.
Instead, we need to resort to multiple time series analysis, and therefore, we choose to estimate the following system of equations:
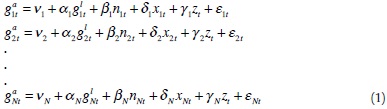
where the different N cross-sections units are treated as a system of seemingly unrelated regression equations (SURE), and t indexes time (in months). On the right side of the equations, nit is the ratio of non-core to core liabilities of bank i at time t, xit is a vector of idiosyncratic variables of bank i, and zt is a vector of macroeconomic variables, such as economic activity and the monetary policy stance, which affect differently all banks considered in our sample. On the left side of the equations, the variable that captures the asset side of a bank balance sheet can be either total assets or total outstanding loans. Total assets include total loans and banks' bond holdings, both public and private. Errors «it are assumed to be correlated between equations, and we estimate both models with maximum likelihood techniques.
The focus of our analysis are parameters αi and βi, which we expect to be positive for the majority of banks if the prevailing pattern in the Colombian banking industry is the "balance-sheet capacity" story. Credit supply increases with leverage (αi>0) when banks' equity is sticky and they face other frictions (a VaR constraint, for instance) such that liabilities increase, especially non-core ones (βi>0). Still, it is important to note that our specification allows for heterogeinity across banks and thus, the sign of the estimated parameters not need to be the same for all banks in the Colombian financial system.
We control for several factors that may affect our estimation of credit supply and use several bank-specific variables as well as macroeconomic variables. Vector xit includes the following variables:
-
Size: we measure size as the share of the bank's i assets in the total assets of the sample. Ex-ante, we have few strong reasons to believe that a bank's size would impact credit supply growth either positively or negatively. True, a large bank may have greater access to international financial markets than smaller banks, but the latter may also have other advantages like, in the case of Colombia, access to central bank liquidity funding facilities in the same conditions as large banks. This possibility gives them access to alternative sources of funding and so levels the playing field. In other words, we have no particular expectations about the sign of the estimated parameter for this variable.
-
Credit quality: the central bank's department of financial stability provided us a loan portfolio quality indicator (IC, indicador de calidad de la cartera), measured as the ratio between risky loan portfolio and gross loan portfolio (both without leasing), and also other indicator that proxies credit quality: short-term liabilities as a share of total liabilities. Short-term liabilities include savings accounts, current account deposits, less than one-year term deposits (CDT), and interbank funds. Both series are monthly, and while IC goes from January 2002 to September 2012, the short-term liabilities indicator is available from June 1990 to September 2012. The inclusion of credit quality is a key control mechanism because it may influence banks' balance sheet management and therefore, weaken our findings. For instance, a bank could experiment idiosyncratic changes in the quality of its loan portfolio, leading it to adjust its balance sheet also idiosyncratically. A bank's credit quality may improve, freeing up space for further leverage and triggering the described mechanism. Including credit quality may alleviate this potential problem6.
In vector z of macroeconomic variables we included:
-
Economic activity. We considered two indicators of economic activity separately: an industrial production index and a leading indicator of Colombian GDP, IMACO. We get the IPI (Industrial Production Index), including coffee threshing, from the website of DANE7, and seasonally adjusted it using an x12 filter in Matlab. IMACO is a a five-month leading indicator of economic activity calculated monthly by the Banco de la República following the methodology described in Kamil et. al (2010). This series is available for the full period of study. The fact that the IMACO is a leading indicator of economic activity is, in our view, an advantage as it allows us to take into consideration potential forward-looking effects in the allocation of credit.
-
An indicator of the monetary policy stance. We use the interbank interest rate (TIB) to proxy for the stance of monetary policy. This is probably a good proxy since 2000 onwards, but probably not the best indicator before that year. As we explain next, we control for this possibility using a monetary policy regime dummy. The interbank rate is available only from April 1995.
-
An indicator of the monetary policy regime: since our sample goes back to 1994, we acknowledge that by 1999 there was an important change in the operation of monetary policy, namely, the adoption of an inflation targeting regime by the central bank, abandoning the exchange rate crawling band system. Also, the policy instrument moved from monetary aggregates, like M1 or M3, to the short-term nominal interest rate. These changes may have had important implications for bank balance sheet management and, therefore, we set a dummy variable before and after the abandonment of the exchange rate band in September 1999.
Finally, there is a methodological point to make. We deflated, when necessary, all nominal series using the Consumer Price Index (CPI) without food, using 2008 as the base-year.
4. Estimation Results
This section discusses the main results of the estimation of the system of equations in (1) for assets and credit. We used maximum likelihood for the estimation of the Seemingly Unrelated Regression Equations (SURE), and the routines that allow robust standard errors were taken from Gould et al. (2006). Table 2 reports the results of the estimation using total assets as dependent variable and Table 3 reports the same but using outstanding loans instead. Both columns have fourteen columns, corresponding to the number of banks in our sample.
Results from both regression systems give us strong insights on how banks manage their balance sheet. There is a strong and positive relationship between leverage and the asset side of banks' balance sheet: faster leverage growth translates into faster bank asset and loan growth. This relationship is statistically significant for ten of the fourteen banks when we use assets as a proxy of the size of balance sheets, and for five of the fourteen banks when we use credit instead. Furthermore, the five banks that display leverage pro-cyclicality in the credit equations also display it in the assets equations, suggesting the relationship is robust to the way of measuring balance sheet size. When one focuses on magnitudes, the estimated values of ai that are significant range from 0.085 to 0.476 in the assets equations and from 0.157 to 0.447 in the credit ones. This means that one additional percentage point of monthly leverage growth translates into an additional 10 to 50 basis points of monthly asset/credit growth. This is a large number for the transmission mechanism from leverage to assets growth described above.
On the contrary, the results of the estimation of parameters Βi lack the robustness and consistency across banks and across alternative measures of balance sheet size, that the αi's do display. We were expecting a positive relationship between contemporary NC2C and assets growth, and a negative one between the last and lagged values of NC2C. In the assets equations the parameter associated to NC2C is positive and significant for five banks. Furthermore, the lagged value of this variable has the expected sign for the majority of banks, and the effect seems concentrated in the first lag. However, those relations partially vanish once we estimate the credit equations. In that case, there is one bank with a negative and significant parameter associated to variable NC2C, and other five banks with the expected positive sign, four of them coinciding with the ones from the previous specification. Only for bank number three in the credit equations, the results from the assets specification are no longer significant.
Moreover, if we estimate the systems of equations for the alternative measures of NC2C, we get a completely different relationship between composition of liabilities and assets/credit growth. As shown in Tables A1 to A4 of Appendix A, it now seems that the enlarged lending capacity of banks doesn't lead them to resort to alternative funding different from core liabilities. By contrast, the parameters associated to leverage remain robust to the alternative definitions of non-core liabilities. In the baseline assets equations, the 10 banks that exhibit procyclical leverage maintain this behavior under other definitions of non-core, as well as the five procyclical banks in the credit equations. Thus, the evidence presented so far gives support to the idea that banks differ in their leverage procyclicality (with more than half of the sample being procyclical), and thus heterogeneity matters when analysing credit dynamics.
Recall that the differences between our alternative measures of NC2C are related to the classification of CDTs. Ideally one would want to differentiate these certificates by their type of holder, distinguishing between institutional and non-institutional investors. We can do this only imperfectly, assigning the share of office (core) and treasury (noncore) collocations in new issuances of CDTs, to the current balances of these certificates, which is possible only from May 2002. However, it is still possible that large investors use offices to carry out large operations with CDTs, which would bring difficulties to our alternative measures of NC2C. Only from 2005 onwards it is possible to know accurately who are the holders of these type of liabilities, as the Financial Superintendence requires that banks fill a form with this information. We could then distinguish, for example, between investors like pension funds and trusts. Nevertheless, using these forms for a perfect partitioning between core and non-core would have implied to put aside data on the first credit boom documented by Guarín et al. (2013), and also a substantial decrease in the degrees of freedom that the SURE estimation requires. Thus, we did our best to build coherent alternative measures, given limitations of the data.
On the other hand, one pitfall of the SURE estimation is that we can't know if the nationality of banks affects the degree of leverage pro-cyclicality. Differentiating banks by nationality may be important because foreign banks may have different technologies for intermediating funds between economic agents, and different risk policies and management practices in general. To have a preliminar insight into this issue, Figure 8 is replicated from Adrian and Shin (2011) using our database. It shows a scatter of the monthly changes in assets against the monthly change of leverage for the consolidated banking system and the 14 banking in our sample. The black line shows a 45 degree line, representing the case when gite=0. Points above this line indicate that during those periods equity was increasing, while the opposite happens for points below it. The blue dots correspond to a national bank while the reds to a foreign one. The variable v shows the bank's share in total assets while the a's represent the estimated coefficients of the above SUR equations.
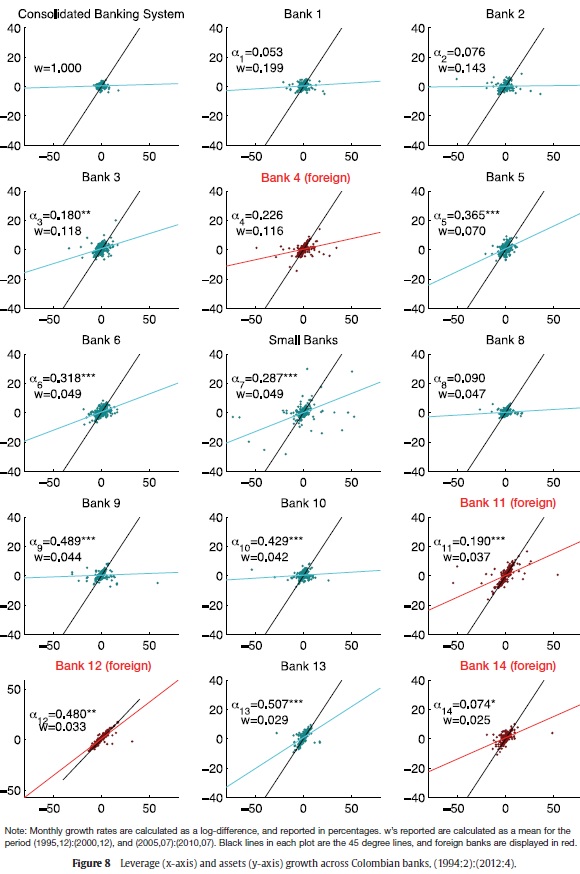
Based on these results, it is possible to identify two patterns of bank behavior depending on the relationship between leverage and assets or balance sheet size:
-
Banks that seem to target a constant leverage ratio, gil =0, and display low correlation between changes in leverage and changes in total assets.
-
Banks that exhibit pro-cyclical leverage or a positive relationship between changes in leverage and changes in total assets.
As mentioned earlier, this heterogeneity in balance sheet management practices has been linked in the literature to the degree of reliance on the capital market and mark-to-market practices. Pro-cyclical leverage might have more incidence in market-based than in bank-based credit systems (see Damar et. Al (2012) for Canada and Adrian and Shin (2010) for the USA). In Colombia, with a credit-system centered in banks, bank heterogeneity, as defined above, could be explained from differential access to markets for funding (explained in this case by bank nationality, for example). We explore this issue in more detail below, when we estimate a panel regression of our model. This approach allows for the interaction of leverage with the nationality of banks, which was not the case before, as SURE estimated 14 separated equations for each bank, and hence it was not possible to include dummy variables. Thus, we now can see if the pattern shown in Figure 8 remains robust once we control for other important variables.
More specifically, we estimate the following regression:

where i indexes banks, t indexes time (in months), and the rest of the variables nit, xit and zt are the same as in the SURE specification8. Foreign is a dummy that takes the value of one if the bank has at least 51% of its capital owned by non-residents, like Citibank Colombia or BBVA Colombia. This variable is interacted with leverage in all the specifications, to study whether foreign banks tend to be more procyclical than national banks or not. Following the prelimianary evidence shown in Figure 8, we expect f to be positive.
Alternatively, instead of considering the variables' real growth rates, we also estimate a similar model but using the cyclical component of credit and leverage. More specifically, we also estimate this regression:

where αit denotes either assets or loans of bank i at month t, the "hats" denote the deviation from trend of the variables and, as in previous specification, xit is a vector of characteristics of each bank and zt a vector of macroeconomic variables. This means that we end up with four equations to estimate.9
The estimation technique is OLS with fixed or random effects. To test for the reliability of the selection of fixed-effects we use the Wald test, which is an heteroskedastic and cluster-robust extension of the usual Hausman test. Table 4 reports the results for assets equations and Table 5 reports those for total outstanding loans. Both tables have four columns. The first two columns correspond to the model in growth rates, Equation (2), while the remaining two correspond to the model in cyclical terms, Equation (3). The difference between the two columns in each group is the sample period. The first corresponds to the complete period, from 1994 to 2011, while the second corresponds to the period for which the credit quality index data are available.
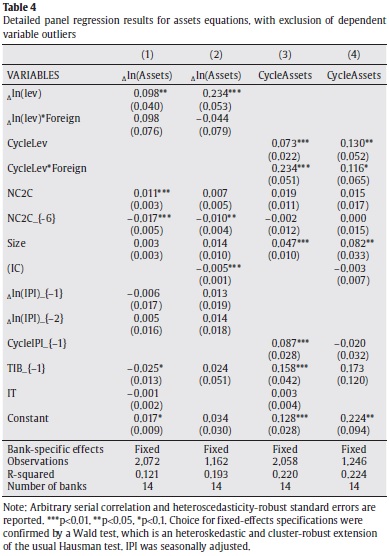
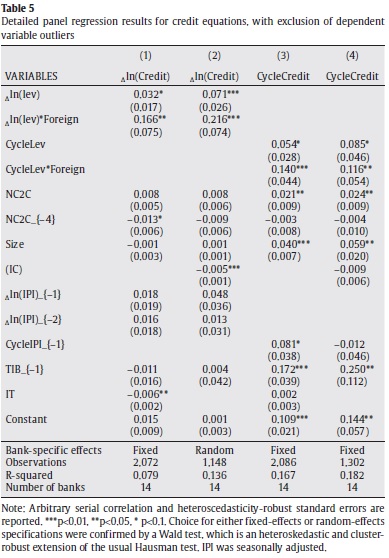
Results from both regression models give us further support for the hypothesis of leverage pro-cyclicality: faster leverage growth translates into faster bank asset and loan growth. Furthermore, when considering the model in cycles, unusually higher leverage is strongly associated with unusually high bank assets, but less with unusually high loans. At first sight, the estimated elasticities appear low but this may be misleading. Consider the first estimation of the model in growth terms. The estimated value of a ranges between 0.098 and 0.234, which means that one additional percentage point of monthly leverage growth translates into an additional 10 to 23 basis points of monthly asset growth. In annual terms, this would be about 1.2 to 2.6 percentage points larger. In addition, the results for the estimated parameter ɕ show that foreign banks experience a higher degree of leverage pro-cyclicality than national banks when we measure balance sheet size in terms of loans, both for the growth and cyclical models. In the case of asset equations, this behavior of foreign banks only applies to the model with cyclical deviations.
Our interpretation of these results is that they support the idea that banks behave as if they maximized profits subject to a value-at-risk constraint. This means that Colombian banks may be facing funding restrictions that condition their borrowing to a risk-based capital constraint. In Colombia the solvency ratio has been around 14% on average in the last ten years. Although this constraint may not be binding at all times, it may affect lending supply dynamics. Given that banks' ability to lend is determined by risk-management practices and regulatory considerations, when risk perceptions and/or measures improve, banks expand their lending so as to make full use of their lending capacity. Thus, assets grow and leverage increases.
The results of the estimation of parameter b add further support to this view. There is a positive but weak relationship between the composition of liabilities and the asset side of banks' balance sheet. A larger share of non-core liabilities translates into faster bank assets growth. In addition, an unusually large share of non-core liabilities has been associated with unusually high bank loans. The quantitative results here are harder to interpret because in this case the estimated parameter is a semi-elasticity. Although the estimation results are not fully robust for all model specifications, our interpretation is that the expansion of balance sheets, driven by the need to use up the already described mechanism of enlarged lending capacity, leads banks to resort to alternative means of funding other than their usual core liabilities. We believe, that this is so because of the intrinsic properties of core liabilities, as they respond more to low frequency movements than to cyclically high frequency changes of the funding needs of banks. Therefore, both of our findings lead us to believe that the size of the balance sheet (either credit or total assets), leverage and the composition of bank liabilities are part of the same process, lending support to a model in which banking frictions are relevant.
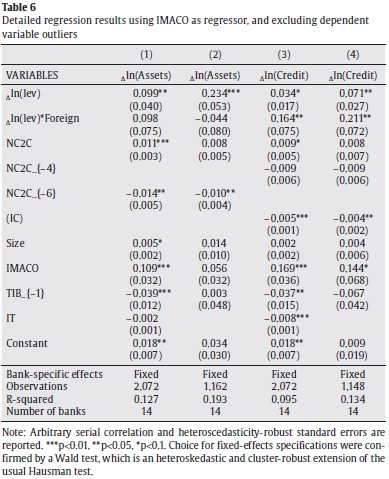
These results may be questioned from several dimensions, several of which we tackle in the following paragraphs. A first line of criticism may be related to the quality of our proxies. It may be argued that industrial production is probably not the best indicator of economic activity. In order to respond to this argument we consider using the IMACO, a leading indicator of GDP growth, as an alternative proxy in the regression model. Table 6 reports the results. The values of the estimated parameters are similar to those obtained under the model specification that considers the industrial production index.
A second dimension along which our results may be questioned is the estimation technique. There are at least two potential problems here: the presence of outliers and the potential endogeneity of leverage and of the non-core to core liabilities ratio. To prevent the effects of outliers, Tables 4 to 6 show the results that exclude dependent variable observations in the 1st and 99th percentiles. We also checked that excluded outliers did not come from the same bank (or few banks) and were not concentrated in certain years of the sample. Nonetheless, we also report in Appendix A the results without eliminating the outliers (see Tables A5 to A7).
There is a potential endogeneity between credit supply growth, leverage and non-core to core liabilities. The reader may wonder why we did not estimate the model by GMM and used lagged non-core to core liabilities ratio as instrument, which is a frequent practice in the literature of monetary policy transmission mechanisms (see, for example, Akbostanci and Ozsuca (2012)). However, the properties of our sample are not suitable for this technique, as our time series realizations are much larger than the cross-section observations, T > N. N is only 14 while T ranges between 82 and 148, depending on whether we include the credit quality index or not. Thus, for GMM estimation there will be a very large number of moment conditions, making the computational problem intractable. Furthermore, as discussed in Baltagi (2005), when T is too large the downward bias of GMM is quite severe, outweighing the potential gains in efficiency. We deal with this problem using lags of non-core to core liabilities as well as leverage.10
A third possible criticism is that results may be driven by monetary policy or economic fluctuations. Changes in the policy rate may explain the described dynamics of credit, leverage and non-core liabilities. A similar argument applies to the phase of the business cycle. During expansions it is expected that credit grows, leverage increases and demand for alternative bank liabilities flourishes. To deal with this problem, note that we included the interbank interest rate as a proxy of the stance of monetary policy and the industrial production index as a proxy of monthly economic activity (see Tables 4 to 6) since there is no monthly measure of GDP in Colombia.
The results of our baseline regressions show that the effect of the policy rate (TIB) on the dynamics of both growth and credit is not robust to alternative specifications. On the one hand, the results displayed in Table 6, with the leading economic activity index (IMACO) instead of the industrial production index (IPI) as an explanatory variable, are in line with the empirical literature on the risk-taking channel. This literature argues that lower interest rates increase banks' willingness to take risks, thus increasing leverage, and leading to faster growth of credit and assets. On the other hand, in Tables 4 and 5, three out of 8 specifications showed that increases in the short-term interest rate coincide with the expansionary phase of credit and assets cycles.
A possible explanation for the weakness of this parameter may be that the policy rate may be endogenous to credit growth, a problem that our empirical methodology cannot fully account for. We doubt that this is case. In the estimated regression, the dependent variable is the credit growth of a particular bank i, not aggregate credit. Circumstantial evidence allows us to contend, quite confidently, that the central bank does not set the intervention rate by targeting credit growth of a particular bank. Of course, it is possible that aggregate credit may influence the determination of TIB, but this is not how ours models are specified.
Another possibility is that monetary policy affects credit with long lags, and not only through changes in the level of the interest rate but through deviations from a "natural rate". Thus, we use multiple lags of the policy rate and run the same regressions as in Tables 4 to 6 but using the difference between the policy rate and its long run value, calculated by means of a Hodrick-Prescott filter. By removing the long-run component of the policy rate, we are also reducing the likelihood that this variable is not stationary. This is certainly another source of the potential lack of robustness of that estimated parameter. Tables A8 to A10 in Appendix A show the results of these estimations, each one reporting the lags of our fairly exogenous measure of monetary policy, that are found to be negative and highly significant.11
Finally, one may argue that the regressions that include the leading economic activity index as a regressor can account, at least partially, for the preemptive counter-cyclical policy actions of the central bank. These actions may be behind the positive coefficient reported in Tables 4 and 5. For instance, when the bank expects a slowdown of the economy and cuts the interest rates, it is unlikely that it can increase output (although it can make the fall of output less sharp). As a leading index that groups a significant amount of information regarding the future development of the economy, the leading economic activity index may be successful in purging our monetary policy measure from counter-cyclical policy actions taken in anticipation of future booms and recessions. The control mechanism may be similar to the one used in VAR's literature of applied international macroeconomics, where controlling for commodities prices largely eliminates the 'price puzzle', that is, the fact that the price level increases in the first months after an increase in the interest rates (see Sims, 1992, for discussion).
In sum, we perform several robustness checks and report them in the appendix. There, the reader can check the sign and values of the estimated parameters α and β. In our judgment the estimation results remain robust to a wide range of alternative specifications.
5. Fin al Remarks
The findings obtained in this paper make it possible to approach credit dynamics from a wider perspective that includes both sides of banks' balance sheets and that also sheds light into the links that exist, at an aggregate level, between monetary variables and credit.
These results clearly indicate that there is an interesting connection in Colombia between bank credit/asset growth, liability composition and leverage. This means that, despite the characteristics of the banking system in the country, banks seem to manage their balance sheet according to a model of credit in which risk perceptions and funding restrictions are important.
In terms of balance sheet management in general, and credit supply decisions in particular, the banking sector in Colombia is predominantly pro-cyclical. This has important implications for the analysis of the relationship between financial and business cycles, the amplification of shocks, and the way financial imbalances incubate in the economy.
The composition of bank liabilities between core and non-core, as defined in this paper, could provide valuable information for policy makers regarding the phase of the cycle of the economy. Foreign-denominated liabilities of banks, although they represent a relatively small share of non-core liabilities in Colombia, are dynamic during the upward phase of the leverage cycle. Taking this into account, a shift from core to non-core liabilities could play the role of an early warning indicator of financial vulnerability. Periods in which banks shift from lower to higher non-core liabilities ratios may signal the beginning of credit cycles. The fact that in this dimension our econometric results are not fully robust merits further and deeper research about this issue.
The contention that banks manage their balance sheet in a pro-cyclical fashion is consistent with the apparent stability of the average leverage ratio of the banking sector in Colombia. Leverage ratios of individual banks display a wide dispersion and also vary in the different phases of the cycle of the economy.
Bank heterogeneity matters when studying how banks manage their balance sheet. In particular, foreign banks exhibit higher leverage and non-core to core liabilities ratios than local banks. Mortgage banks are more leveraged than other banks. Consumer banks have the highest non-core to core liabilities ratio of the sample. Not always conclusively, bank size tends to be positively correlated with balance and credit growth. Most significantly, foreign banks display the highest degree of leverage pro-cyclicality.
These results point in the direction of the need to revise the traditional analyzes of changes in monetary variables in terms of shifts in the demand for money, for example between liquid less liquid assets. The hypothesis tested in this work, that credit supply decisions by banks are better understood as part of how they manage their balance sheets, illustrate that causation might very well go from credit to money.
Acknowlegments
We would like to thank Hernando Vargas and Andrés González for helpful comments and discussions.
Notes
1The banks that were grouped under this label are the following: ABNAmro, Andino, Bancamía, HSBC, BankBoston, Coomeva, Estado, Falabella, Finandina, Pacífico, Pichincha, Procredit, Selfin, Standard Charter, Uconal, and WWB.
2Nonetheless, the authors tried with different measures for non-core liabilities and the results were robust for different alternatives.
3Most of the information is classified under code 2 of the Unique Accounting Plan (PUC) of the balance sheets for commercial banks.
4From here on, all calculations and figures referring to NC2C will use the main definition discussed above, unless it is said the opposite.
5Note that the group of "Small Banks", as defined in section 2.1, is in fact a medium bank in terms of size. It holds on average 4.9% of total assets of the banking system, while small banks in the classification discussed in this section hold between lit = 2.5% and 4.1% of total assets.
6We should note, however, that in all results reported in Section 4 we used the first indicator, although we also conducted exercises with the other measure, which are available upon request.
7National Department of Statistics of Colombia.
8This time, vector xit has an additional regressor, Foreign. Foreign banks may have a wider spectrum of sources of funding than local ones (e.g. international credit lines), and thus we expect the coefficient associated to this variable to be positive. However, we can only include this variable if we impose a random effects estimation of the panel, as the nationality is constant over time and thus would be captured by the fixed effects if we were to use this last estimation technique. Results including this variable are shown in Tables A5 to A7 of Appendix A.
9This is without taking into account the possible combinations derived from all the alternative proxies we used for the right hand side variables, which served us to assess the robustness of the results.
10Most of these regressions are reported in the appendix titled "Robustness of the results". The others are available upon request.
11We also included simultaneously the 24 lags of CycleTIB in our regressions, as in Romer and Romer (2004), who found that a contractionary monetary shock negatively impacts industrial production between months 5 and 24. We were, however, expecting a faster effect of monetary policy on banks' credit supply and assets. In these regressions, most of the lags were negative, but few of them individually significant. Results of these regressions are available upon request.
References
Adrian, T., Boyarchenko, N. (2012). Intermediary Leverage Cycles and Financial Stability. Staff Reports No. 567, Federal Reserve Bank of New York. [ Links ]
Adrian, T., Shin, H. (2012). Procyclical Leverage and Value-at-Risk. Staff Reports No. 338. Federal Reserve Bank of New York. Revised version. [ Links ]
Adrian, T., Shin, H. (2011). Financial Intermediary Balance Sheet Management. Annual Review of Financial Economics 3, 289-307. [ Links ]
Adrian, T., Shin, H. (2010). Liquidity and Leverage. Journal of Financial Intermediation 19, 418-437. [ Links ]
Aikman, D., Haldane, A., Nelson, B. (2011). Curving the Credit Cycle. Columbia University Center on Capitalism and Society Annual Conference "Microfundations for Macroeconomics". New York, revised version. [ Links ]
Akbostanci, E., Ozsuca, E. (2012). An Empirical Analysis of the Risk Taking Channel of Monetary Policy in Turkey. Economic Research Center (ERC) Working Papers, Middle East Technical University. [ Links ]
Baltagi, B. (2005). Econometric Analysis of Panel Data. John Wiley and Sons, New York. [ Links ]
Bruno, V., Shin, H. (2011). Capital Flows, Cross-Border Banking and Global Liquidity. Mimeo. [ Links ]
Damar, H., Meh, C., Terajima, Y. (2012). Leverage, Balance Sheet and Wholesale Funding. 16th International Panel Data Conference and 44th Annual Conference of the Canadian Economics Association. [ Links ]
Gómez-Gónzalez, J., Kiefer, N. (2009). Bank Failure: Evidence from the Colombian Financial Crisis. The International Journal of Business and Finance Research 3, 15-31. [ Links ]
Geanakoplos, J. (2009). The Leverage Cycle. Discussion Paper No. 1715. Cowles Foundation. [ Links ]
Gould, W., Pitblado, J., Sribney, W. (2006). Maximum likelihood estimation with Stata. Stata Press, College Station. [ Links ]
Guarín, A., González, A., Skandalis, D., Sánchez, D. (2013). An Early Warning Model for Predicting Credit Booms Using Macroeconomic Aggregates. Forthcoming in Ensayos sobre política económica, Banco de la República. [ Links ]
Hahm, J., Mishkin, F., Shin, H., Shin, K. (2011a). Macroprudential Policies in Open Market Economies. Prepared for the 2011 Reserve Bank of San Francisco Asia Economic Policy Conference. [ Links ]
Hahm, J., Shin, H., Shin, K. (2011b). Non-Core Bank Liabilities and Financial Vulnerability. Preliminary draft of paper for the Federal Reserve Board and JMCB Conference on "Regulation of Systemic Risk'", Washington D.C. [ Links ]
Jorda, O., Schularick, M., Taylor, A. (2011). When Credit Bites Back: Leverage, Business Cycles, and Crises. Discussion Paper No. 8678, Center for Economic Policy Research, CEPR, London. [ Links ]
Kamil, J., Pulido, J., Torres, J. (2010). El IMACO: un índice mensual líder de la actividad económica en Colombia. Borradores de Economía, Banco de la República. [ Links ]
Kim, H.J., Shin, H., Yun, J. (2012). Monetary Aggregates and the Central Bank's Financial Stability Mandate. Paper prepared for the Federal Reserve Conference Central Banking Before, During and After the Crisis. [ Links ]
Kim, K., Kim, B., Pak, H. (2012). Monetary Policy Framework and Financial Procyclicality: International Evidence. In: Macroprudential regulation and policy. BIS Papers, Bank for International Settlements 60, April. [ Links ]
Romer, C. Romer, D. (2004). A New Measure of Monetary Shocks: Derivation and Implications. The American Economic Review 94, 1055-1084. [ Links ]
Schularick, M., Taylor, A. (2010). Credit Booms Gone Bust: Monetary Policy, Leverage Cycles and Financial Crises, 1870-2008. NBER Working Papers No. 15512, National Bureau of Economic Research, revised version. [ Links ]
Sims, C. (1992). Interpreting the Macroeconomic Time Series Facts: The Effects of Monetary Policy. European Economic Review 36, 975-1000. [ Links ]
Shin, H., Shin, K. (2011). Procyclicality and Monetary Aggregates. NBER Working Papers No. 16836, National Bureau of Economic Research. [ Links ]
Shin, H. (2011a). Banking Glut and Loan Risk Premium. Working paper, Princepton University. [ Links ]
Shin, H. (2011b). Macroprudential Policies Beyond Basel III. BIS Papers, No. 60. [ Links ] Talylor, A. (2012). The Great Leveraging. BIS Annual Conference, Lucerne, June. [ Links ]
