


 Inglés (pdf)
 Articulo en XML
 Referencias del artículo
 Enviar articulo por email
 Citado por SciELO
  Citado por Google
  Similares en
SciELO
Similares en
SciELO  Similares en Google
 Permalink
1. Introduction
Food price fluctuations have been under great interest for a long time. Earlier kinds of equilibrium models demonstrated that food price was influenced by multiple factors such as supply and demand, economic situation, trade policy, prices of related products, etc. These models focused on predicting long-term food price trend, and despised the frequent and drastic change of price (Labys, 2006). Food price crisis in 2007-2008 and 2009-2010 attracted more attention to short-term food price volatility and more efforts to modeling it.
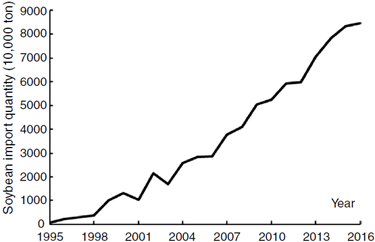
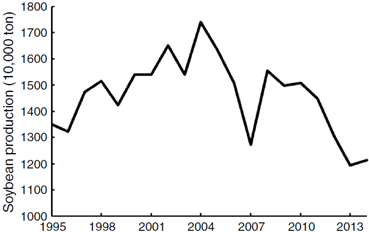
Soybean is one of the most important food products in the world, especially in China. The consumption of edible oil and soybean meal in China increased sharply since 1990s. To close the gap between China's soybean demand and supply and ease the agricultural production pressure on resources and environment (Ni, Yu, Xu, Song, Wang and Qian, 2014), China began to import soybeans increasingly (Li, Li, Liu, Hu, Luo and Zhang, 2015) (see Fig. 1). The import quantity of soybean in 2015 increased to 81.74 million tons, accounting for 87.3% of total domestic soybean consumption. The consequent soybean price volatility (SPV) increased the uncertainty of soybean growing gains, so domestic soybean production was not increasing by the growing domestic demand; instead, it was lingering and declining (see Fig. 2). It is important and valuable for both policy-makers and soybean growers to know the correlation between international market and China's domestic market, so they can know soybean price volatility better and improve food policies and production plans.
The high import dependency and price volatility of soybean caught much interest in studying the relationship of them. Yao and Cao (2015) made cointegration analysis of the relationship between the soybean import volume, international price and domestic price and attested the long-term equilibrium relationship between them; they also did Granger causality test on them, and the results demonstrated that international price and import quantity affected domestic soybean price in one-way direction. Chen (2013) continued to establish VAR models and applied variance decomposition to analyze different contributions of GDP, agriculture production means price and imported soybean price to soybean price changing. The results showed that imported soybean price shock was the leading factor of China's domestic SPV. Chen and Zhou (2016) followed the same way to learn the integration relationship between international and domestic soybean market at different periods, and concluded that in spite of several changes in the trading environment, the price volatility transmission capacity of international soybean market to domestic soybean market was much stronger than reaction of the latter. Besides the studies on soybean spot (SP) markets, soybean futures (SF) markets were also under extensive discussion. Zhou and Zou (2007) used VECM model to analyze short-term correlation between Chinese and international SF market. The evidence proved that US SF market played a leading role in the global SF pricing system and affected the China SF price trend. Xia and Cheng (2006) applied the same model to discuss the relationship of DEC and CBOT SF price and China's domestic SP price and got different results. They found that DEC SF market played a leading role in the changing of international SF price and China's domestic SP price also had some weak influence on soybean futures price. This difference may come from the data quality and processing.
Cointegration, Granger causality tests testified the long-term relationships between different soybean markets. VAR models moved forward to analyze influence of the international soybean price mean and lagged value on domestic soybean price changing which was called spillover effect (SE) of mean. VEC models were typically constrained VAR models and can show the adjustment speed of China's domestic market to international market shocks. The following variance decomposition can further analyze the degree of international soybean market impact on domestic SPV. But VAR or VEC models paid little attention on heteroscedasticity and time-varying covariance. GARCH models took them into account so as to optimize the estimations and explain the price volatility better. Song, Li, and Xu (2013) took use of VECH-TARCH model to study the volatility of US SP market and China's SP market, and found that both markets had obvious dependence on its past volatility and external shock which was called clustering effect (CE) of market volatility, but US SPV mainly relied on transmission of its previous volatility while Chinese SPV was more vulnerable to external shocks; the volatility SE between two markets were not significant. Gu, Guo, and Tian (2013) applied GARCH-BEKK model to investigate price volatility SE between foreign and China's domestic SP market using different price data. The result proved that international SPV had a one-way SE on domestic soybean price. Liu, Han, and Bao (2016) chose DCC-GARCH model to analyze the dynamic correlations of three markets, the results demonstrated that the relation between imported SP market and DEC SF market became closer, but the correlations between China's domestic SP market and imported SP market or SF market were weak due to domestic policies. Previous studies mainly used bivariate-GARCH models to examine the correlations between two markets, such as international and China's domestic markets or imported soybean market and China's domestic markets, and the conclusions of existing studies were inconsistent due to different methods and data. Dynamic relationship between international SF market, imported soybean market and China's domestic SP market drew less attention, but the price transmission was supposed to follow this route according to economic theories. So this study chose international, imported and domestic soybean price data for model estimation and compared the results of different multivariate GARCH models (MGARCH). Specifically, this study used data of CBOT SF price, soybean distribution price at Qingdao port and China's domestic SP price during September 10, 2011 to November 19, 2016 and chose three MGARCH models to check the CE and SE in volatility of three markets, as well as explore the correlation between them.
In the second part, MGARCH model and its extended forms, i.e., VECH-GARCH model, BEKK-GARCH model and CCC-MGARCH model were illustrated and the reason of choosing MGARCH model was addressed. In the third part, soybean price data and its sources were introduced, then weekly logarithmic price return rate of different soybean markets were calculated and followed by statistical analysis, unit root test and Granger causality test. In the fourth part, VECH-GARCH, BEKK-GARCH and CCC-MGARCH models using the data of weekly logarithmic price return rate were estimated by Eviews9.0 and model results were listed and explained. In the last part, we got some conclusions which had strong policy implication.
2. Econometric methodologies
Engle (1982) proposed ARCH model to analyze time-dependence of mean value changing. Bollerslev (1986) introduced lagged value of variance into ARCH models, and expanded the model into GARCH model. Univariate GARCH (UGARCH) models focus on the influence of external shock and time-varying variance on price volatility and are widely used to depict the volatility CE of single financial product or market. In addition to analysis of time-varying variance, Bollerslev, Engle, and Wooldridge (1988) applied multivariate GARCH (MGARCH) models to estimate returns rate of stock, fund and bond and discovered that conditional covariance was also time-varying and had significant effects on risk premiums. This discovery led to various researches on interaction and relationship between financial assets and markets. MGARCH model adds multiple time series variables into UGARCH models and can estimate CE and SE of mean and variance simultaneously. The general form of MGARCH model is written as Eq. (1).
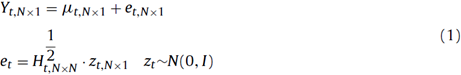
Conditional variance matrix H t is a function of historical information, standardized residuals z t is subject to identical and independent distribution of zero mean and unit variance. MGARCH model is hard to ensure the positive definiteness of H t, and cannot obtain the optimal values by maximum likelihood estimation. To solve these problems, it is necessary to make constraints on parameters, mean value and variance matrix.
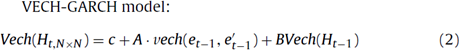
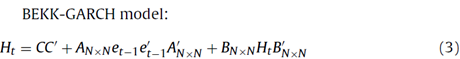
Bollerslev et al. (1988) put up with VECH-GARCH (1,1) model (see Eq. (2)), A and B were parameter matrices and H t was a linear combination of its own residual et-1 and variance of Ht-1. As this model cannot guarantee the positive definiteness of Ht, Engle and Kroner (1995) suggested BEKK-GARCH model (see Eq. (3)) as a solution, where matrix C is a symmetric and positive definite matrix. This model can guarantee the positive definiteness of Ht, but with the sequence of increased number of parameters. To simplify calculation and optimize the result, matrices A and B were restricted to be diagonal.
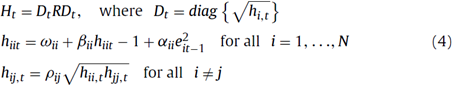
For the same purpose of reducing parameters, Bollerslev (1990) put forward CCC-MGARCH model (see Eq. (4)). This model divides the conditional covariance matrix into conditional variance matrix and conditional correlation coefficient matrix, and parameterizes separately (Li & Yin, 2009). Matrix R is symmetric and positive definite. Elements in it are constant conditional correlation coefficients p ij , and elements on the main diagonal are equal to one. The expression for h is similar to UGARCH model. This model can greatly simplify the computation work.
CCC-MGARCH model:
MGARCH models had been widely used in financial field (Bollerslev et al., 1988; Chang, González-Serrano, & Jimenez-Martin, 2013; Engle, 2002; Kroner & Ng, 1998; Tse & Tsui, 2000). Recently they were introduced into agricultural economy field to analyze the price volatility of agricultural products. Most researchers concentrated on SE of energy markets to agricultural products markets (Teterin, Brooks, & Enders, 2016; Wu & Li, 2013; Zhang & Qu, 2015), and some other scholars concerned about the SE between markets of different agricultural products (Beckmann &Czudaj, 2014).
Studies related to SE between soybean market and other markets centered around the price volatility and correlations between SF markets or SP markets at home and abroad. Previous studies showed that SPV of future market and spot market was asymmetric and in skewed distribution which was in line with characteristics of ARCH models. And SPV between different markets were interacted with each other (Liu et al., 2016; Song et al., 2013). This kind of fluctuations and interactions can be estimated by MGARCH models. Due to different constraints, variance and covari-ance parameters estimated by different MGARCH models will have differences (Kroner & Ng, 1998), so this study applied VECH-GARCH, BEKK-GARCH and CCC-GARCH models to analyze the volatility SE and the interaction between international SF market, imported soybean market and the China's domestic SP market.
3. Data description
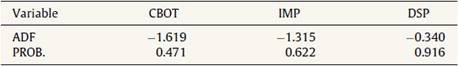
Data used in this study were weekly data of CBOT SF price (CBOT), imported soybean distribution price at Qingdao port (IMP) and China's domestic SP price (DSP), dated from September 10, 2011 to November 19, 2016. All data were derived from Wind database (2016), and each market included 255 observations. Soybean future trade volume of Chicago Board of trade ranked No. 1 in the world, so its closing price can represent the trend of international future market. According to the data in Wind database (2016), Qingdao custom ranked second in all China's soybean import ports, so its port distribution price can be used as the representative of imported soybean price. For convenience, data of weekends, holidays, and failed to match in the sequences had been removed. DSP and IMP were inflation adjusted by CPI index, and the base period was September 2010. The results of Augmented Dickey-Fuller (ADF) test for weekly soybean prices of three markets (see Table 1) all accepted the null hypothesis of unit root existence, which means the original price sequences were unstable.
To eliminate the instability of the sequences, soybean price return rate (SPR) was calculated by Eq. (5).
Soybean price return rate :
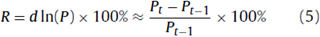
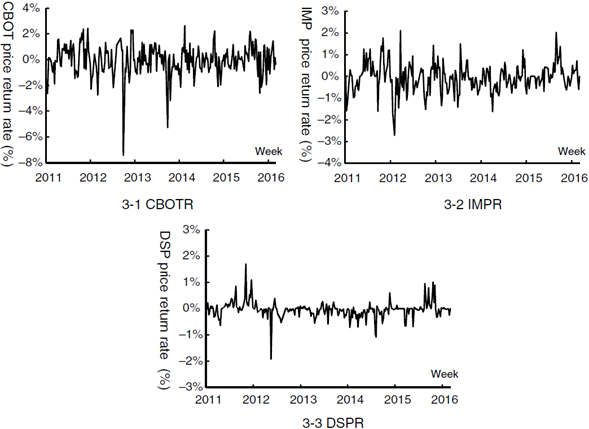
SPR of three markets from September 10, 2011 to November 19, 2016 are shown in Fig. 3. For the aspect of price trend, the general trend of three markets were basically the same, but volatility of CBOT SF price return rate (CBOTR) was closer to fluctuations of imported soybean distribution price return rate at Qingdao port (IMPR), while China's domestic SP price return rate (DSPR) fluctuation showed obvious different route; as to volatility features, all markets presented clearly thick tails which implied volatility CE, but CBOTR fluctuation was most frequent and intense (see Fig. 3-1) followed by IMPR (see Fig. 3-2), and the fluctuation frequency and range of DSPR was weakest (see Fig. 3-3).
Descriptive statistical analysis and unit root test of SPR series were processed by Eviews9.0 (see Table 2). Descriptive statistics analysis showed that SPR of three markets were asymmetric, CBOTR was left-skewed while IMPR and DSPR were slightly right-skewed, and Jarque-Bera statistic rejected the null hypothesis of normal distribution. CBOTR, IMPR and DSPR were all fluctuated around zero and fluctuations showed an evident feature of volatility clustering, which conformed to the requirements of establishing ARCH models. ADF test significantly declined the null hypothesis, which means SPR of three markets became stable after logarithms and first difference.
Table 2 Summary statistics of variables and unit root test results.
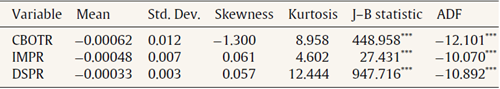
Note: The superscript * represents the probability (p) of accepting the null hypothesis. * means p<0.1; ** means p<0.05; *** means p<0.01.
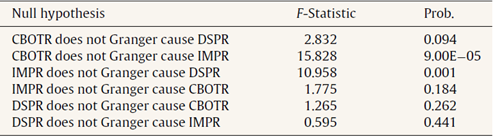
Based on stability test of the data sets, Granger causality test was undertaken to determine whether there was a granger causal relationship between SPR of different markets (see Table 3).The results showed that under significant level of 10%, CBOTR was Granger cause of IMPR and DSPR while IMPR and DSPR were not Granger causes of CBOTR; but when the significant level rose to 5%, CBOTR was no more Granger cause of DSPR; under significant level of 1%, IMPR was the Granger cause of DSPR while DSPR was not Granger cause of IMPR. Ganger causality test results proved that international SF market had significant effect on fluctuations of imported soybean market and imported soybean market exerted remarkable influence on China's domestic SP market, but China's domestic SP market had no significant effect on the international SF market and imported soybean market. It could be concluded that the volatility in international markets would be transmitted into China's domestic market, but the reaction of China's domestic market to the international market was weak. Such volatility transmission was in conformity with feature of GARCH models.
4. Results
4.1. Model results
Three MGARCH models were estimated by Eviews9.0, using the weekly data of CBOTR, IMPR and DSPR. The regression results are shown in Table 4 including mean values, ARCH and GARCH effects.
Table 4 Multivariate GARCH parameter estimates.
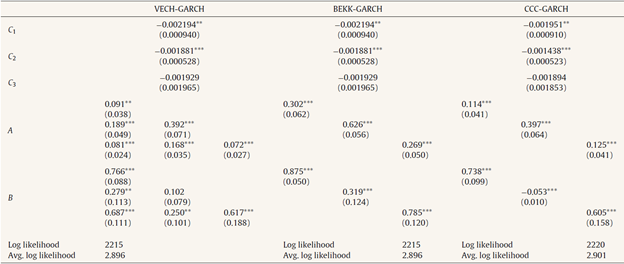
Note: (1) The subscript 1 represents IMPR; the subscript 2 represents DSPR; the subscript 3 represents CBOTR; (2) A11 represents ARCH effect of IMPR; A22 represents ARCH effect of DSPR; A33 represents ARCH effect of CBOTR; A21 represents mean spillover effect between IMPR and DSPR; A31 represents mean spillover effect between CBOTR and IMPR; A32 represents mean spillover effect between CBOTR and DSPR; (3) B11 represents GARCH effect of IMPR; B22 represents GARCH effect of DSPR; B33 represents GARCH effect of CBOTR; B21 represents variance spillover effect between IMPR and DSPR; B31 represents variance n spillover effect between CBOTR and IMPR; B32 represents variance spillover effect between CBOTR and DSPR. (4) The superscript * represents the same meaning as in Table 2, where *means p<0.1; **means p<0.05; ***means p<0.01.
Mean values estimated by three models were very close to zero which was in line with MGARCH model features. MatrixA reflected the ARCH effect of SPV. The significant diagonal elements in matrix A of three models proved the ARCH effect in the price fluctuation of each market. It also revealed that the ARCH effect in China's domestic SP market fluctuation (A22) was strongest, while ARCH effects in other two markets were relatively weak. It indicated that China's domestic SP market was defective and more vulnerable to external shock than the other two markets. The significant non-diagonal elements in VECH-GARCH model testified the mean spillover effect between three markets. It can be seen that A21 was biggest followed with A32 which represented the strong mean SE between China's domestic SP market and international soybean market including imported soybean market and international SF market. It implied that China's domestic soybean market was sensitive to the shocks from international soybean market. A31 was very small which demonstrated the weakest mean SE between imported soybean market and international SF market. It signified that imported soybean market was more efficient and insensitive the shock from international SF market.
Matrix B reflected the GARCH effect of SPV. The main diagonal coefficients of three models except B22 in VECH-GARCH model were highly significant, which means there were strong GARCH effects in fluctuations of three markets. By comparison, it was evident that GARCH effects in volatility of imported soybean market and international SF market were much stronger than the effect of China's domestic SP market volatility, which hinted that international soybean markets were more dependable on their past volatilities. Significant non-diagonal elements of VECH-GARCH model certified strong SE in price fluctuations of three markets. B31 were much bigger than B 32 which represented the stronger variance SE between imported soybean market and international SF market. It testified that international SF market volatility imposed much greater influence on imported soybean market than on China's domestic soybean market. B 21 was bigger than B 32 which means imported soybean market gave deeper impact to China's domestic soybean market than international SP market. It was worth mentioning that coefficients in matrix B were larger than these in matrix A, which stands for stronger GARCH effect in volatility of three markets.
Besides, there were slight differences in the estimated parameters by three models. By comparison of diagonal coefficients, it can be seen that the coefficients in BEKK-GARCH model was much bigger than coefficients of the other two models, which means BEKK model tends to overestimate the results. Estimated values of CCC and VECH models were closer, but may show different significance like B22 .
4.2. Conditional correlations
The conditional correlation coefficients between three markets calculated by BEKK-GARCH models are shown in Fig. 4.
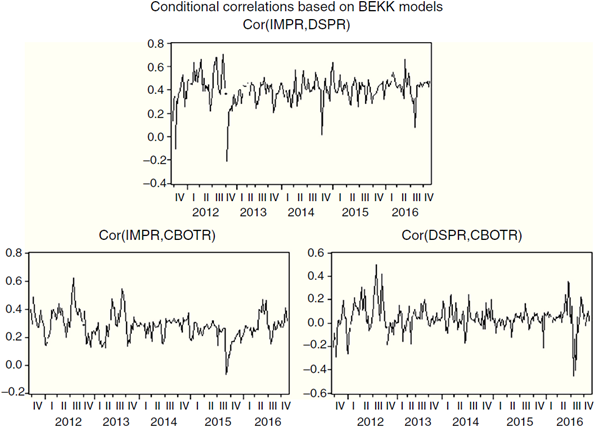
It was clear that the coefficients kept changing during the observation period. First, the correlation between imported soybean market and China's domestic SP market was at high level, and the fluctuation range was between 0 and 0.8, which means higher positive interaction existed between two markets which was quite different from conclusion of Liu et al. (2016); second, the correlation between import soybean market and international SF market was relatively high, and the range was between 0.1 and 0.6, indicating imported soybean prices were greatly influenced by international SF price; third, the correlation coefficients between international SF market and China's domestic SP market were in the range of -0.3 to 0.4, attesting that the influence of international SF market on China's domestic SP market was uncertain. The correlation between them was not significant, which was consistent with Granger causality test results. It could be found from Fig. 4 that the fluctuations of correlation coefficients between imported soybean market and China's domestic SP market or international SF market and China's domestic SP market were relatively stable after 2014 than early stages. It may result from China's soybean target price policy and improvement of domestic soybean market. There were also some abnormal fluctuations of correlation coefficients, and they may be due to seasonal factors and speculative factors, etc.
5. Conclusions
This study chose three MGARCH models to analyze the volatility features and correlation of international SF market, imported soybean market and China's domestic SP market. The models results were essentially the same, but BEKK model was inclined to overestimate the CE and SE. Model results showed there were significant CE in volatility of three markets, and GARCH effect was generally stronger than ARCH effect. But China's domestic SP market volatility had stronger ARCH effect while the othertwo markets' had stronger GARCH effect which accounts for different market efficiencies. For the interaction of three markets, the model results verified the obvious mean and variance SE in price fluctuations of three markets. Specifically, the SE of both mean and variance between China's domestic SP market and imported soybean market was strong and highly significant, while the variance SE between international SF market and imported soybean market was also remarkable. But the SE of mean and variance between China's domestic SP market and international SF market were comparatively weak. Combined with Granger causality test results, it implied that the imported soybean market was under great impact of international SF market volatility, and the shock and instability of imported market then resulted in violent fluctuations of China's domestic SP market. The conditional correlations coefficients of different markets also proved the above conclusions.
The high dependence on international markets led to volatility of China's domestic soybean price and uncertainty of growing income. When domestic soybean production is still in small scale and lack of competitiveness, excessive imports will worsen China's domestic market conditions for small producers and expose them to greater risk, which is not conducive to stable domestic soybean production. So government should establish international soybean price detection and early-warning mechanisms to provide more comprehensive information services for policy makers and soybean growers. Meanwhile, China's government should take measures to encourage soybean growers to expand their operation scale through subsidies, preferential tax and other policies and control excessive import of soybeans. In addition, China's domestic soybean growers' anti-risks ability should also be enhanced by establishing cooperative organizations or business cooperation.

