English (pdf)
 Article in xml format
 Article references
 Send this article by e-mail
 Cited by SciELO
  Cited by Google
  Similars in
SciELO
Similars in
SciELO  Similars in Google
 Permalink
1. Introduction
In this paper we attempt to determine the level of efficiency of Colombia and its influence on the generation of economic growth. We also try to answer the question as to the extent to which growth is hindered by institutional and environmental factors, so that it is possible to evaluate the potential threat to economic growth that these factors could represent. An essential variable in the study will be the level of efficiency of the public sector, so that we can determine the extent to which economic growth depends on the size of the public sector as well as its its level of efficiency.
When planning this type of evaluations, the researcher should always consider what is the best instrument to be used, in order to provide clear answers. In the field that concerns us, until a recent time it was the researcher himself who had to make an initial decision about the chosen research methods. In the evaluation of efficiency and productivity the researcher can choose among parametric (which use econometric instruments to estimate production frontiers) (see, for instance Lovell and Kumbhakar, 2000) or non-parametric estimation tools (using mathematical programming techniques) (see, for instance Cooperet al., 1999). Usually, the first option involves stochastic frontier estimations while the second one is carried out in a deterministic environment, in which the existence of error in the data is assumed to be non-existent. However, under the current state of the art these differences have been alleviated, since today it is possible to carry out deterministic or stochastic estimations can be made with any of them.
A second criterion that should be taken into account is the existing knowledge about the reference technology. In this way, taking account of the technological characteristics, one can opt for either parametric frontier estimations, with varying degrees of flexibility. When this is not the case, to impose arbitrarily a given functional form could be counterproductive, which would advise the use of non-parametric methods.
There are currently some proposals (Badunenko et al., 2012) that allow detecting the presence of inefficiency and also, according to the structure of the available data, choose the most appropriate estimation method. The preliminary results indicate that, in our specific scenario (an analysis for Colombia from an international perspective), the best alternative was to use parametric models for the estimation of production functions.
Our approach is different from the one carried out previously by, for instance, Alfonso et al. (2005) because, apart from measuring the levels of efficiency for the Colombian public sector, we also attempt to shed some light as to what extent the inefficiency detected is a burden that prevents achieving higher levels of economic growth. Answering that question demands statistically significant results and, for this reason, considering parametric approaches might be more convenient given the challenges that non-parametric techniques confront in this regard (Simar and Wilson, 1998, 1999).
The rest of the document presents, in the first place, the concept of efficiency and offers the elements that allow interpreting the results obtained. Next, we detail the data used and its descriptive statistics. Later on, the results obtained, which will allow us to analyze the position of Colombia with a greater level of detail. The final conclusions close the contents of this article.
2. Measuring efficiency
Starting from the modern theory of production, we derived the concept of efficiency from productivity estimates. Having a specific productivity level, the economic units try to find out the degree to which their level is appropriate compared to that of their competitors. The systematic comparison (benchmarking) between the productivity of units belonging to the same industry gives rise to the concept of technical efficiency. The technical efficiency indices facilitate the evaluation of productivity because, instead of considering the output produced per unit of input consumed, the information is reported in relative terms. That is, to what extent productivity must be improved in order to reach that level corresponding to those units with better performance (best-practice units).
Figure 1 shows, for an example, a simplified representation of efficiency estimates. It represents a very simple case in which only one output is produced by one input. The OC line represents the simplest of technologies: absence of fixed costs, and presence of constant returns to scale. In this sense, a technically efficient unit would correspond to the one producing a level of output, with a given level of input consumption, that would lie on that line. We can also refer to the OC line as the frontier of production possibilities, since it indicates the maximum level of production for any consumption of factors, so that it would be impossible for a given unit to lie above these levels of production. For the inefficient unit  the coefficient
  indicates whether it is close or far from the maximum possible level of production. The efficiency coefficient will have a value close to unity when inefficiency is low, and approaches zero when the inefficiency levels are high.
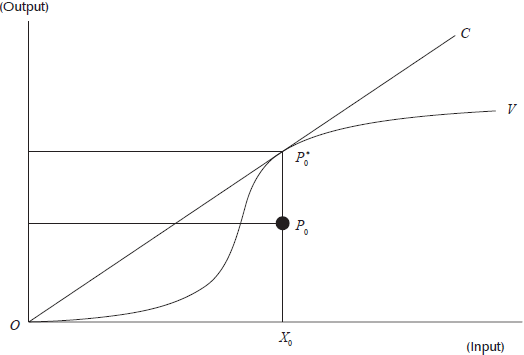
For more complex technologies there are other ways of describing the frontiers of production possibilities. Thus, the OV curve serves to illustrate a technology with variable returns to scale. From the origin to the  the slope grows more than proportionally, indicating the presence of increasing returns to scale. To the right of growth is less than proportional, indicating the existence of decreasing returns to scale. The simplest functional forms, such as the Cobb-Douglas production function, allow the description of technologies with constant, increasing or decreasing returns to scale, but they are inadequate when the returns to scale depend on the segment of the border that is considered. This limitation can be solved with more flexible functional forms such as, for example, the translog production function.
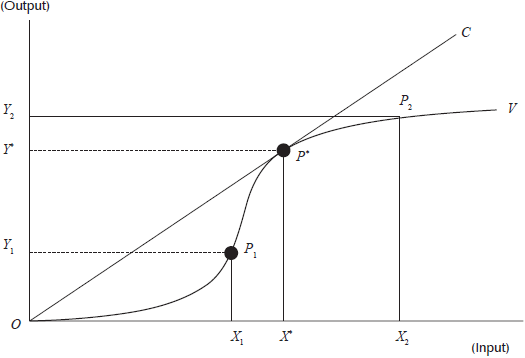
In most production processes, as in the situation presented in Figure 2, economies of scale are important. The OV curve indicates the production possibility frontier, whose optimal point (where the average productivity is maximum) is located at the point  The points
  and
and  lie on the frontier, but they cannot produce at the maximum productivity level because they are operating with a different size (lower or higher) than the optimum. For this reason, both combinations
  exhibit inefficiencies due to the inadequate scale of their operations.
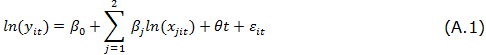
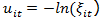
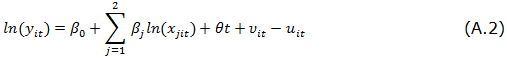
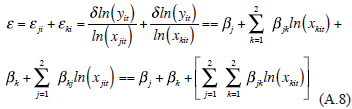
In Appendix A we formalize the process that allows us to estimate a Cobb-Douglas and translog production functions, which will allow us to measure efficiency via frontier efficiency techniques, similar to those represented in both Figures 1 and 2. Here we will continue with the description of model used for the analysis, which is summarized in Figure 3.
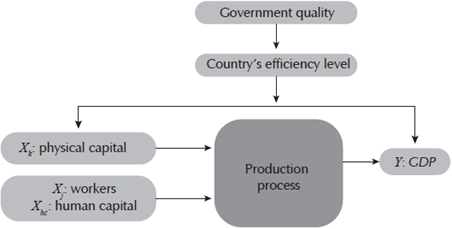
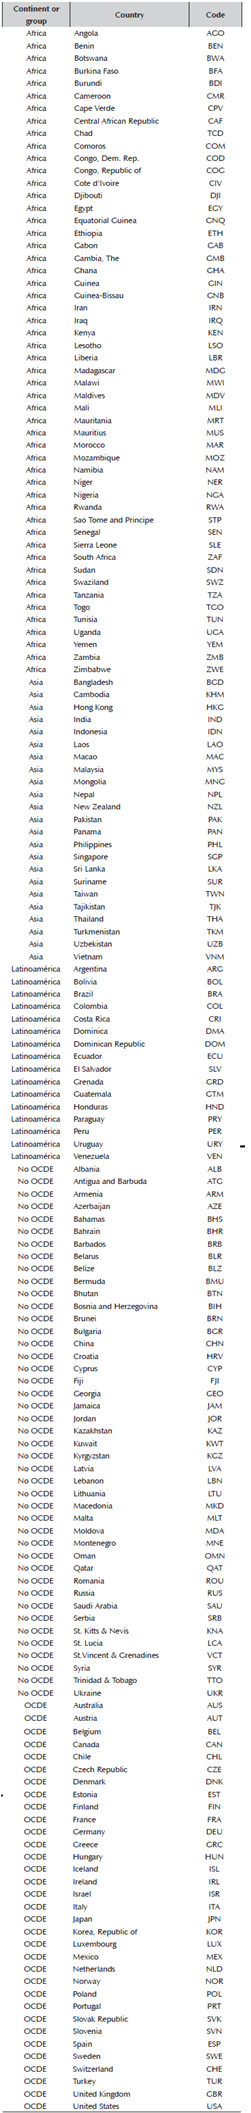
As indicated above, the objective of this article is to determine Colombia's efficiency levels from an international perspective.1 In order to do so, we will estimate production frontiers which considers one output (the country's GDP) and two inputs: physical and human capital. Since production frontiers will be adjusted to the set of countries for which it was possible to obtain information, special care must be taken to compare the quantities expressed in different currencies, and different purchasing power levels-which will be explained in the following section.
The estimated production functions allow us to determine the relative position of Colombia in terms of the variables related to technology: comparative efficiency level, relative position in terms of returns to scale, technical change corresponding to the frontier, and technical change specific to Colombia. This covers the typical analysis using production frontiers. As we are interested going beyond simple technological descriptions and, in a second approximation, we will reestimate the production frontiers to corroborate if efficiency levels depend upon each country's quality of government (Knack, 2002), so that it is possible to verify if there is empirical evidence of a significant relationship between the levels of quality of government (and the efficiency of national public institutions) with the country's public and private productive efficiency levels. In other words, following North, 1994, we attempt to verify whether there is a cooperative effect (North, 1994), so that the quality of institutions can be linked, using formal rules (statute law, common law, regulations) informal norms (conventions, norms of behavior, and self-imposed codes of conduct), or the enforcement characteristics of both,2 with each country having the levels of aggregate efficiency of all its productive sectors. In this sense, we expect to check whether those countries that have a quality institutional framework are those that obtain higher relative efficiency values. If this were the case, it seems obvious that both economic growth and improvements of a country's efficiency levels should be based on the consolidation of a political and public framework that generates quality institutions.
We will conclude the article with a final exploration that, again, will attempt to connect economic growth with two variables that are representative of the importance and quality of public sector management. In this sense, if the estimates obtain statistical significance, it will be possible to determine whether sluggish economic growth might be derived from inefficiencies in the public sector.
3. Data
There is a vast literature that has been using data from the Penn World Table (PWT) database for evaluating countries' macroeconomic performance. Although there are alternative sources of information such as, among others, those cited by Inklaar and Timmer (2013): OECD Productivity Database, Conference Board Total Economy Database, EU KLEMS and GGDC Productivity Level Database, none of them allows comparisons among countries at different stages of economic development. In addition, the 8th release of the PWT3 (published in July 2013) reports indicators of capital stock (and not of the annual investment flow), and also of the level of human capital (and not simply the number of employees), allowing for multilateral comparisons of efficiency and productivity among countries with a very detailed definition of inputs.
In Summer and Heston (1991), it is stated that the variables contained in PWT basically allowing making comparisons among prices of goods and services which include purchasing power parity (PPP) adjustments. Therefore, we facilitate comparing magnitudes expressed in real terms among countries. The characteristics of this database enabled Färe et al. (1996) to use this data to compare productivity growth for 17 OECD countries. Other studies that have used these data for estimating efficiency and productivity are Chambers et al. (1996), Ray and Desli (1997), Färe et al. (2000), Kumar and Russell (2002), Badunenko and Romer-Ávila (2013), Henderson and Russell (2005), Färe et al. (2004), Angelopoulos et al. (2008), Pires and Garcia (2012) and Badunenko et al. (2013). Among them, and excepting the studies of Angelopoulos et al. (2008) and Pires and Garcia (2012), all of them use nonparametric estimation techniques. In contrast, our methods will be based on stochastic frontier analysis because, apart from knowing the level of inefficiency assignable to the Colombian economy, we are also interested in understanding to what extent the estimates made are consistent with the axioms and postulates of production theory (for instance, to what extent the monotonicity axiom is accomplished in all the points, whether the required slopes of the marginal rates of inputs substitution or the inputs elasticity appear with the right sign).
Version 8 of PWT includes data from 189 countries and, for most cases, it encompasses a long time span (1950-2010). Here we will define a shorter period because, in addition to estimating levels of inefficiency by country, we want to check the impact of government effectiveness on efficiency levels. To this end, we will take data from the World Bank, and more specifically from the database The Worldwide Governance Indicators, 2014,4 which provides data on government effectiveness for years 1996 to 2012. As a conclusion, the empirical work Is carried out on 133 countries and considers a data panel of 16 years (between 1996 and 2012).
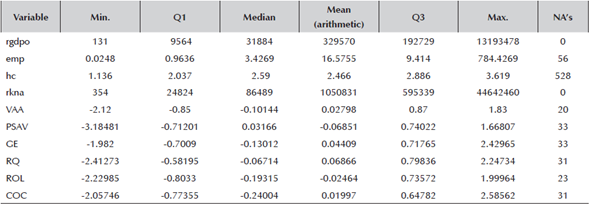
Table 1 defines the variables used, and Table 2 reports the descriptive statistics of these variables. They show that the country with the smallest size employs 24,800 workers, while the largest one employs 784 millions. Also that the greatest number of unknown values (528) is confined to the human capital variable. In contrast, the variables related to governability have a variability ranging between -3.5 (for the worst score) and +3.5 (for the best score). The highest mean value corresponds to Regulatory Quality (RQ) (Political Stability and Absence of Violence, PSAV, if we consider the median) while the lowest is PSAV (Control of Corruption, COC, if we consider the median). If we refer to the dispersion, then the interquartile range indicates that the greatest dispersion corresponds to the Voice and Accountability (VAA) variable, whereas the lowest one corresponds to RQ.
Table 1 Definition of the relevant variables
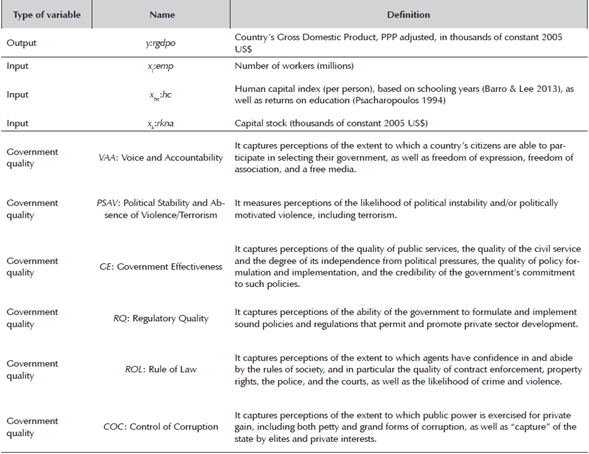
Source: Penn World Table (PWT) and The Worldwide Governance Indicators, 2014.
4. Results
4.1 Results corresponding to production frontiers and inefficiency levels
The results corresponding to the parametric estimates are presented in Table 3. Column 3 shows the results corresponding to the Cobb-Douglas production function. The coefficients have a positive sign and all variables are statistically significant, which guarantees the condition of monotonicity for all 134 countries. The sum  is lower than unity, indicating that the technology exhibits decreasing returns to scale (just the section
  of Figure 2). It is also clear that there is a positive technical change, albeit with a level close to zero. Given the characteristics that define Model I, we find that the level of inefficiency is high (0.4277), which implies that, in general, countries have problems obtaining the maximum GDP given their human capital and physical capital endowments.
Table 3 Estimation of the parameters of the production function
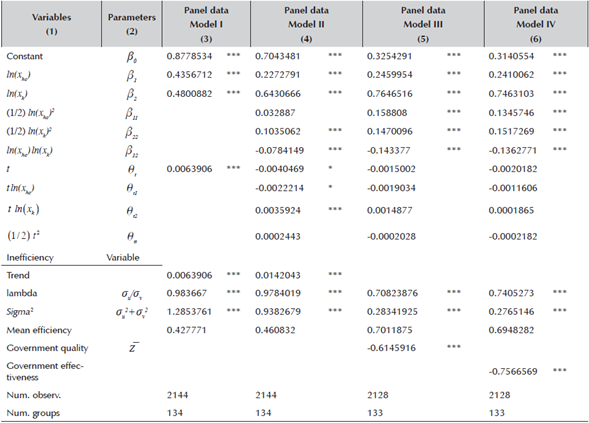
*,**,*** indicates significance at the 10%, 5% and 1% levels, respectively.
Model I: panel regression, Cobb-Douglas production function.
Model II: panel regression, translog production function.
Model III: panel regression, translog production function.
Model IV: panel regression, translog production function.
Source: own elaboration.
Results in column 3 (Table 3) correspond to an overly restrictive specification of technology, and it is natural to inquire whether might arise due to an inadequate specification. In order to verify this, columns 4, 5 and 6 report results corresponding to the estimates of the translog production functions. Column 4 reports the results corresponding to the first estimate of the translog function. It should be noted that the likelihood ratio test indicates that the translog model is preferable to Cobb-Douglas. Additionally, using an F-test we can reject the hypothesis that 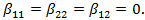 In the same way, results show a reasonable technological orientation as there is no evidence of severe specification problems: although the translog production function cannot be globally monotone (as it occurs with the Cobb-douglas production function), for the vast majority of observations the monotonicity condition is fulfilled-with positive output elasticities. It is also clear that levels of inefficiency increase.
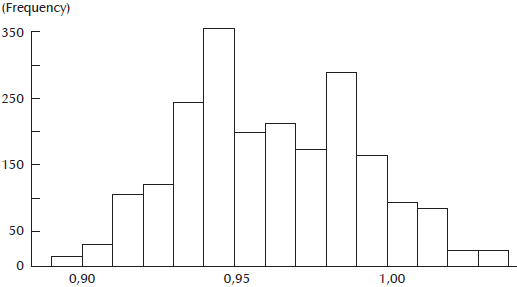
In addition, an analysis of economies of scale (see Figure 4) confirms that the predominant situation is of decreasing returns to scale (elasticities lower than unity), although these diseconomies of scale are not very high either, since the number of countries with a elasticity lower than 0.9 is quite low.
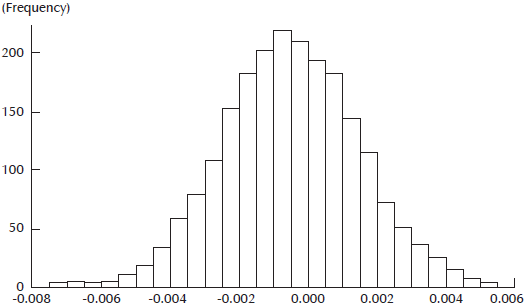
With respect to technical change, Figure 5 displays a perspective of its distribution: it seems that roughly half of the countries in the sample went through positive technical change although, globally, the values are very low, especially if we compare them with the values corresponding to technical inefficiency. The assumption about the technical change is that it is Hicks neutral, say it does not change the output elasticities nor the inputs marginal substitution rates. The estimation assumes a fixed rate of yearly technical change.
In the results presented so far, apart from the temporal evolution, we did not consider any variable explaining technical inefficiency. In both cases (columns 3 and 4 of Table 3), we see that inefficiency has a tendency to increase-with a value of 0.0142 in the case of Model II. The results reported in columns (5) and (6) also refer to the estimation of the production function but, in these cases, they add explanatory variables corresponding to the quality of government (these results come the estimation of model 6 from the appendix). The results strongly confirm the hypothesized signs. Specifically, in column (5) we see how the average value of the government's quality variables has a negative and significant impact (-0.6146), suggesting that countries with high government quality scores have associated low inefficiency levels, and vice versa. Therefore, we find evidence on the favorable effect of the quality of public institutions on the real economy, either via the direct participation of the public sector or due to government's ability to regulate private economic activities, in general.
The same approach is taken in column (6) (Table 3) although, instead of including the average value to government quality, only one of its components is included: the efficacy of public administrations and other public institutions. In fact, we can corroborate that this dimension has an even greater impact than that corresponding to the average of quality of government,5 confirming that, in fact, the behavior of the public sector and its efficacy levels have a direct impact on the country's efficiency levels. In other words, any initiatives to boost GDP growth should take into account, apart from the primary factors of production (human and physical capital), the impact of public institutions' performance as well as the efficiency levels of the economy. In other words, an efficient public sector has a positive effect on the key macroeconomic variables of any country, since it avoids wasteful and counterproductive allocations of funds, reducing the need for public financing and acting as a revitalizing factor for the economy as a whole.
In order to conclude with the explanations of Table 3's contents, it should be noted that the different estimations are convergent with each other since there are no sign changes or contrary values to those expected.6
4.2. Results corresponding to the barriers to growth
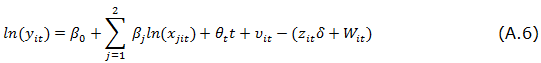
Once the results are known from an annual perspective, it is clear that poor quality institutions have an impact on the inefficiency levels of the country. However, we are now interested in providing details on the effect of public sector on the national economy from a dynamic perspective. In other words, we attempt to determine the direct impact of public sector efficiency on economic growth. For this, we will consider the model proposed by Angelopoulos et al. (2008) to explain those factors that affect the economic growth of the country:
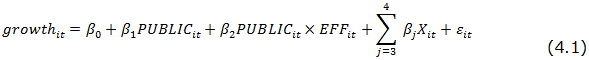
where growthit is the real GDP change for country i in year t, PUBLICit reflects the percentage of public spending on the GDP, EFFit refers to the level of efficiency of public spending, and Xit is the effect of other environmental ariables (in our case, the percentage of GDP devoted to investment and the value of per capita GDP). Actually, in our application the variable regarding the efficiency of the public sector is taken from the database of the World Bank, so its estimation is totally exogenous to the proposed model.
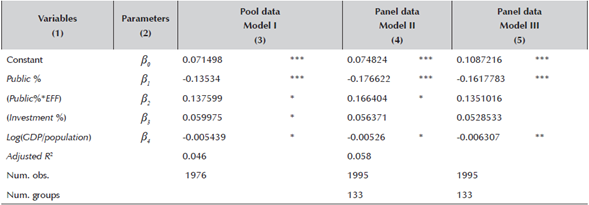
According to Angelopoulos (2008), a negative sign is expected for β1 (which would capture the negative impact of the size of the public sector on growth), a positive sign for β2 (which would indicate that public efficiency favors the country’s economic growth), a positive sign for β3 (capturing the positive impact of investment in growth) and, finally, a negative sign for β4 (this would confirm the existence of macroeconomic convergence, since countries with initially lower levels of per capita GDP grow faster).
Results reported in Table 4 confirm the predictions, with robust estimations. Therefore, regardless of the estimation method-pooled regression in column (3), panel data in column (4), and frontier regression in column (5)-the signs of the regressors coincide with the predictions, so that the relationship between the size of the public sector and GDP growth depends on the level of efficiency of public management. It is also clear that investment has a positive impact on growth, and that there is a convergence process because countries with higher GDP per capita growth more slowly.
Table 4 Estimation of the drivers of growth
*,**,*** indicates significance at the 10%, 5% and 1% levels, respectively.
Model I: pool regression
Model II: panel regression (PE)
Model III: panel regression (frontier)
Source: own elaboration.
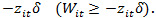
Delving more deeply into the relationship between economic growth and the size of the public sector, and taking expression (4.1) into account, it is easy to determine the necessary condition for public management to contribute positively to economic growth:

which, finally, offers us the following condition:

Those countries meeting Equation (4.3) are able to, given the high levels of efficiency of their public administrations, to induce economic growth. This is the case for Australia, Austria, Belgium, Bahamas, Bermuda, Barbados, Canada, Czech Republic, Chile, Cyprus, Denmark, Estonia, Finland, France, Hong Kong, Hungary, Ireland, Iceland, Israel , Japan, Luxembourg, Macau, Malaysia, Malta, Norway, New Zealand, Netherlands, Portugal, Singapore, Slovenia, Sweden, Switzerland, Taiwan and USA. It should be noted that the above condition is not fulfilled for all the years analyzed in Korea, Slovenia, Spain, Hungary, Macao, Malta, Portugal, and Taiwan. It should also be mentioned that no African country is listed among those countries benefiting from good governance. Finally, it should also be noted that the only Latin American country present in the subset of what we might refer as "virtuous practices" is Chile.
4.3. Results corresponding to Colombia
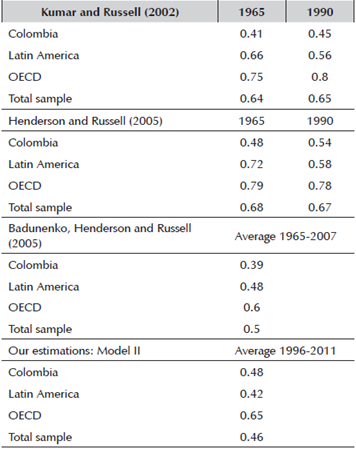
So far we have performed an overall analysis of the results obtained. In this section we focus on the comparative results of Colombia. First, we collect the results obtained in previous studies. In this sense, there are three studies in the literature Kumar and Russell (2002), Henderson and Russell (2005) and Baduneko et al. (2013) using the same data sources to estimate efficiency at the country level, although the methodological approach for the estimation of efficiency is different from ours.
Table 5 presents the results of these previous studies and those that are deduced from our application. For comparison purposes, the average results are added for Latin America, for OECD countries and for the total sample7. It should be remembered that the efficiency indicator goes from zero (for very low efficiency levels) to one (for high efficiency levels). It is verified that in the previous works it is always verified that the relative efficiency level of Colombia is low and inferior to any of the groups with which it is compared. On the other hand, it is clear from our estimates that Colombia's level of efficiency coincides practically with the average value of the sample analyzed, surpassing the average level in Latin America, although there is still a significant distance from the OECD countries. These results point to a catching up process that would allow Colombia to approach the efficiency frontier, especially in recent years, although improvements are still pending because its level of efficiency and productivity does not even reach half of the level maximum possible. In any case, the above comparisons should be taken with some caution because the results come from estimates for different time periods and the country samples are not completely coincident.
Table 5 Estimation of the aggregate efficiency for Colombia’s economy (comparison with previous studies)
Source: own elaboration.
A more detailed analysis will allow us to determine the role of government quality at the estimated levels. For this we will take the results of Models II, III and IV and compare them. In Table 6 we present the corresponding results. In column (1) we summarize the results of model II, and it is clear that the existing inefficiency is considerable, except for the OECD countries, the level of efficiency does not even reach half of the potential level. However, when we monitor for government quality levels, column (3) reveals that residual efficiency levels grow significantly. In both cases, Colombia's efficiency level is around the average for all countries in the sample, slightly above the Latin American average and still far from the OECD average.
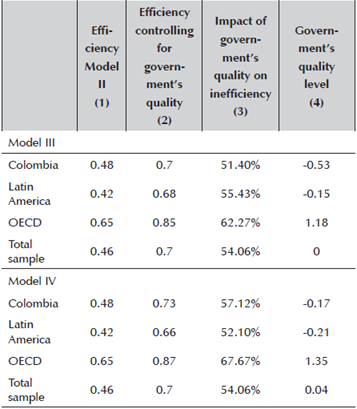
Another way to measure the effect of the environment variables is to determine what part of the inefficiency appears related to the environment variable considered. Thus, column (3) indicates that, in all cases, more than half of the inefficiency found is due to the respective levels of government quality, a fact that reiterates the importance of the efficiency of public management for any National economy. Importantly, column (3) does not present the highest percentage for Colombia, which indicates that in other geographical areas the impact of government effectiveness on the rest of the economy may be even higher.
In order to have a complete view of the situation, we must also pay attention to the content of column (4), and it is clear that the level of government quality in Colombia is below average. As a final conclusion we obtain that an improvement of the quality of the government and, in particular, of the effectiveness of the Colombian public organizations would impact of very positive form to the other economic sectors. In this sense, the information in column (4) makes it clear that there is a great potential for improvement.
4.4. Results related to obstacles to growth in Colombia
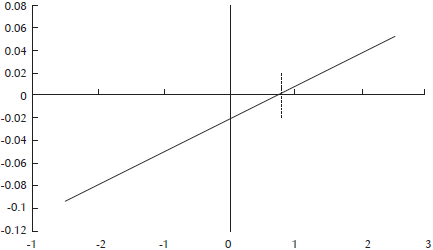
Let us now analyze the results of the analysis of obstacles to growth from a Colombian perspective (see model (1) above). From this model, it was clear that the sine qua non condition for public spending to generate economic growth in the country is that its efficiency level is higher than a certain level, whose theoretical condition is expressed in Equation .
However, with the results obtained (presented in Table 4), it is clear that this condition is not met in Colombia, which indicates that, inexorably, Colombian public spending becomes a brake on growth due to the insufficient level of public efficiency. A graphical illustration of the problem is illustrated in Figure 6. For Colombia's public efficiency level (-0.17), model (1) gives us a negative growth, indicating that the country's GDP growth is reduced by 2.10%. If this situation is to be avoided, we should move to the right in the line of Figure 6. In this case, for an efficiency level of 0.8, Colombia would begin to experience economic growth from the activity related to public spending. That is the challenge that must face the Colombian public management to avoid that its existence suppose a brake to the economic growth.
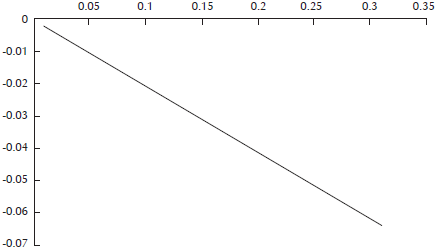
Finally, let us make an analysis based on the alternative variable. Thus, if the contribution to the growth of the public sector depends on its importance (that is, on the size of public expenditure) and also on its level of efficiency, suppose that, given the difficulties in improving the levels of public efficiency, it is decided To operate with the size of public expenditure (which, for the years analyzed, is around 11.65% of GDP). Figure 7 shows the results offered by this strategy, which indicates that there is no possible size of the Colombian public sector that can provide positive economic growth. In conclusion, it is clear that the only viable strategy to get the public sector to help generate positive economic growth rates is to improve public efficiency levels.
Conclusions
As indicated by several reputated scholars (North, 1990, 1994; Acemoglu and Robinson, 2008; Robinson and Acemoglu, 2012), one of the most relevant determining factors that explains the differences in prosperity among countries is related to how their economic institutions differ. Specifically, the disparate quality levels of both formal and informal institutions helps to understand the discrepancies in the living standards and economic progress of countries. With this theoretical background, our study has analyzed the efficiency differences of a relevant group of countries (all those included in the Penn World Tables database and The World Governance Indicators of the World Bank). In a first stage, we evaluated the differences in performance (efficiency, returns to scale, and technical change of the reference frontier) and, in a second stage, we examined the extent to which institutional variables explained these differences.
Results confirm that the estimated models offer a good fit and that production functions preserve the monotonicity conditions for most observations. Therefore, there are no indications of problems with the specification of the production model. Results also show the prevalence of decreasing returns to scale (albeit very lightly) and a positive technical change for almost half of the sample (with a very small value). However, there is a high level of technical inefficiency, which also seems to increase over time. Finally, factoring in institutional variables indicates that the quality of government and, to a greater extent, the effectiveness of public administration and other public institutions has a significant influence on the levels of inefficiency in each country. Therefore, the proposition that emerges from the institutional theory that the existing institutions in each country have a decisive impact on their economic performance is confirmed. These results might imply that, in developing countries such as Colombia, a good growth strategy requires improving the quality of their institutions.
In the second stage, we evaluated the impact of public sector efficiency levels on economic growth. The results were again robust, indicated clearly that higher levels of public efficiency translates were associated to higher growth rates. These estimations also allowed us to determine the necessary conditions for public spending to be a driver that contributes positively to economic growth, and not a hindrance. Results are again very indicative, pointing out that no African country meets this requirement, and also that in Latin America the only country that meets it is Chile. The general conclusion would suggest that, in developing countries, increased public expenditures not accompanied by acceptable efficiency levels will have a limited impact on economic growth prospects.
The results for Colombia indicate that there is still a long way to go, because GDP per capita levels are still well below the OECD average values. It has also been found that more than half of the country's inefficiency is related to poor institutional quality, which is a more severe factor for Colombia than for other economies in the region. Therefore, improving the country efficiency levels requires improving the quality of government and, in particular, the effectiveness of public institutions. In the analysis of the relationship between public spending and growth strategies, it was found that the lack of public efficiency implies slower growth for the country (two points of GDP), and that improvements in the efficient provision of public services and infrastructures are necessary to reverse the situation.
To conclude, we should emphasize that both the global analysis as well as the specific analysis for Colombia reveal the paramount importance of institutions as an engine of growth and economic progress. The institutional improvement is, therefore, a challenge that policy makers must face as a way of laying the pillars of growth. Failure to give it the attention this issue requires may involve maintaining or even widening the discrepancies among different areas of economic influence.