English (pdf)
 Article in xml format
 Article references
 Send this article by e-mail
 Cited by SciELO
  Cited by Google
  Similars in
SciELO
Similars in
SciELO  Similars in Google
 Permalink
1. Introduction
The purpose of this paper is to assess whether Colombian students in their last year of secondary school have academic and earnings expectations that relate to the labor market, and to the scores of standardized tests used for admission to colleges around the country. We use the case of Colombia, where higher education includes vocational (technical) and academic studies as alternative options. The understanding and practical application of basic principles of science and mathematics is carried out in the former, and its objective is the preparation of graduates for occupations that are classified above skilled crafts, but below scientific or engineering professions. Professional education places a major emphasis on the theories, understanding, and design of new ways to solve problems.
People invest in education under uncertain schemes seeking non-pecuniary goals (Oreopoulos and Salvanes, 2009), but also improving their quality of life by maximizing their earning potential. These concepts are summarized in the well-known human capital formation model (Becker, 1964; Mincer, 1974), where earnings expectations play a central role in investment choices.
An important element to consider is the distinction between ex ante and ex post income variability. In some middle-income and developing countries, that individuals' ex ante forecasts about their future income might be below the ex post income that they would obtain if they were to invest in education: Jensen (2010) found that teenagers in rural parts of the Dominican Republic do not expect important benefits from secondary education. In a different direction, Hastings et al. (2016) found that students who overestimate or underestimate the costs of college in Chile tend to make "mistakes" regarding human capital formation.
Jensen's results differ from the findings from developed countries. While Dominitz and Manski (1996) found that students know about the existence of a college earnings premium, they demonstrate substantial heterogeneity and commonly overestimate (ex post) returns. However, in the case of Duke University students, they are aware of the relative pecuniary benefits of their majors (Arcidiacono et al., 2010). There is also evidence about the role played by externally implemented tests on expected returns, choices, and student motivations (Stinebrickner and Stinebrickner, 2012; Wiswall and Zafar, 2015; Zafar, 2011; Zafar, 2013; Reuben et al., 2017; Sequeira et al., 2016). Based on this evidence, several information-based policy experiments have been conducted around the world. Information on labor market wages around the world has been used in China (Loyalka et al., 2013), Colombia (Bonilla et al., 2015) , Finland (Pekkala et al., 2015), India (Sequeira et al., 2016) , Mexico (Avitabile et al., 2015) and the United States of America (Fryer, 2013). Others have focused instead on knowledge about costs and financial constraints; for example, Hoxby and Turner (2013) in the United States of America, and McGuigan et al. (2015) in England. Another methodology, based on reference points, has been used in Madagascar (Nguyen, 2013). The results from these interventions are mixed, with some students updating their beliefs, but often without significant changes in their actual choices. However, there is evidence that another type of intervention, such as conditional cash transfers, might improve students' aspirations (García et al., 2016).
It is important to mention that future earnings expectations may differ from contemporaneous data because of several reasons. This is due to either having private information to explain why their idiosyncratic beliefs differ from the observed mean, or to having incorrect information about such a mean. Systematic differences arise if students consider that economic conditions will be different in the future if there is a generalized error in the information about general wages (as in Jensen's paper), if the learning process starts with a prior belief above or below the mean (optimistic or pessimistic students), or simply if the elicitation instrument induces students to under or over-report their beliefs.
Along with this document, we analyze a nationally representative sample of the last year of upper secondary school students who took the Saber 11 test in 2013 (the Colombian equivalent to SAT).1 This is the standardized, mandatory secondary school leaving test in Colombia. Its importance is crucial to students in the future. On one side, it is required to enroll in tertiary education. On the other, it is used as a quality indicator for admission or financial aid in private and public post-secondary institutions. In 2013, several weeks before the test, ICFES (the National Institute for Educational Evaluation) included an additional set of questions in its application form, among which was a subset that included some items about expectations. These questions were to be answered by 10% of the students from the registry (N=58.224 students). They were asked to indicate: (1) their earnings expectations in 5 years, conditional on following a vocational training path,2 finishing a college degree,3 or not pursuing any further education above secondary school; (2) their expected results in the mathematics and language tests; and (3) the odds of enrolling in an undergraduate program.
This paper considers (1) how income and academic expectations are related to student, family, school, and municipality characteristics, particularly the observed wages in the local labor market for each student. This is compared with (2) how these expectations are related to test scores and their contribution to our ability to understand the variance in such results. As the questions on expectations were posed in categories, we use an interval regression to read the correlations obtained.
We found that the earnings expectations of Colombian students closely followed the variations in the local labor markets when considering vocational and secondary education scenarios. However, there is a lower correlation between college expected earnings and observed wages in departments. Similar to Bonilla et al.'s (2015) findings, for a sample of schools in Bogotá, students systematically tend to expect college earnings well above those observed for individuals of the same gender, who are 5 years older, and from the same city. Earnings expectations also exhibit characteristics such as gender pay gaps; however, such gaps are not present in earnings for college education. This is linked to the fact that females are more likely to be enrolled in college. Avitabile et al. (2015) demonstrate that females are more likely to increase their schooling effort after being exposed to information related to education and future career prospects.
The expected test scores also present a common gender gap: males expect better results in mathematics than females, while females expect better results in language. Also, students from private schools expect higher test scores, even after considering previous school results in the test. These gaps are several times larger than what can be observed in the data from test scores, which show that preconceptions might play an important role on how individuals make their decisions on human capital formation.
Finally, both earnings and academic expectations are related to observed test scores. However, while the expectations data add private information to the decision process, they do not notoriously improve our understanding of the variance in test results. This suggests, in line with the literature described above on information treatment experiments, that the bottleneck in college formation (human capital accumulation) in middle-income countries is not principally due to an information problem.
The structure of this document is as follows. After this introduction, section two describes the databases and the empirical strategy adopted throughout the paper. This is followed by the results and robustness checks, and, lastly by the conclusion.
2. Data and Empirical Exercises
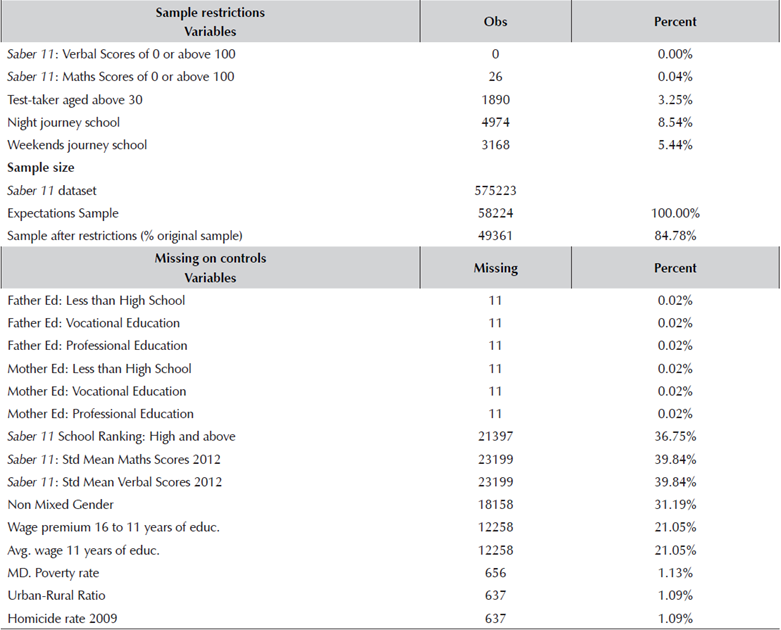
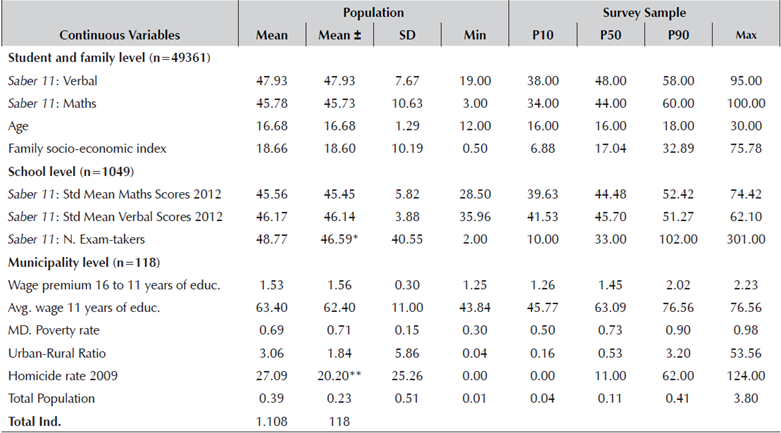
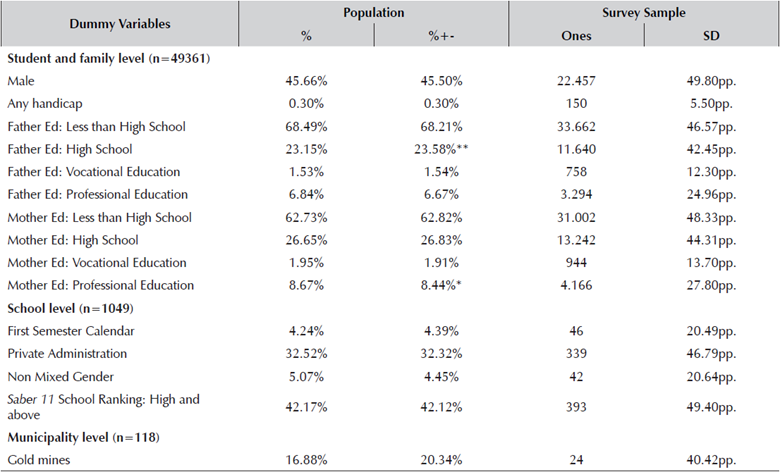
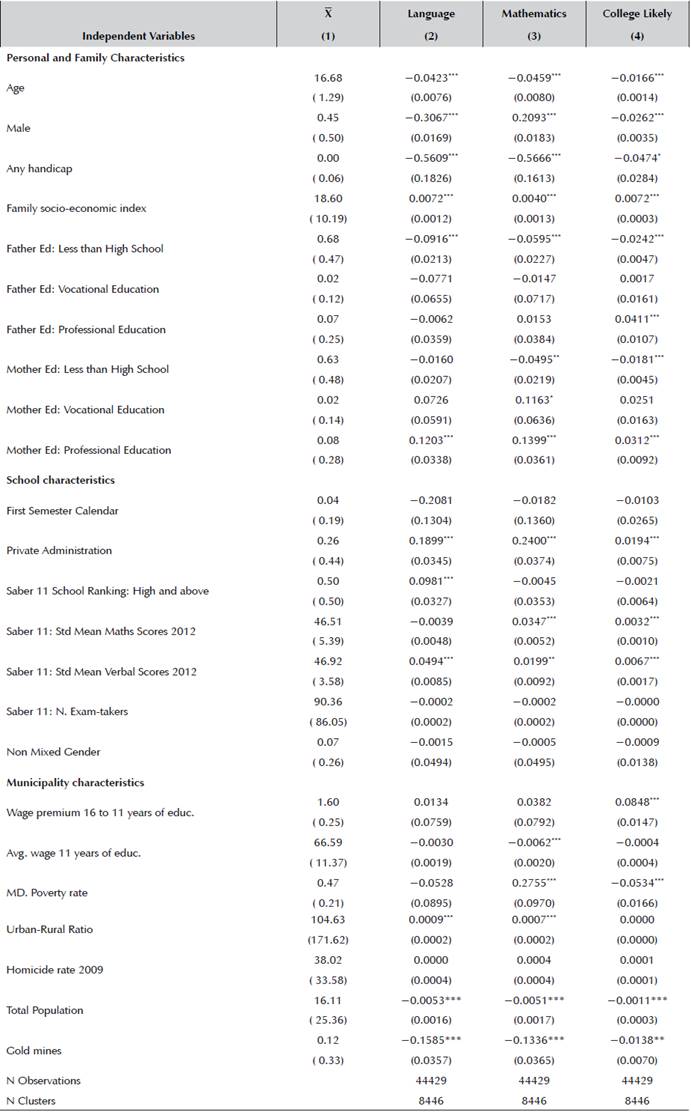
The Saber 11 Test is designed to be taken by all students in the last year of secondary studies, and it is administered by the Colombian Institute for Evaluation of Education, ICFES. Most of the private universities' admission procedures are based on the scores from this test or part of it (i.e. Maths scores). During the inscription process, which is carried out about 3 months before the test, students fill out online forms about their personal characteristics and household conditions. For 2013, the online application form included a set of additional compulsory questions for a random sample of 10% of all students (58.224 students) on the two dates of the test (first and second semester).4 Tables 1 and 2 compare the population and sample means of the principal variables available, and show that the sampled group is balanced in terms of most of the relevant covariates in this study, which will be described below.
Table 1 Descriptive Statistics
† Data from ICFES official classification for 2010 if 2011 is not available.
± Starts show the significance of a test checking if the difference between the sampled and non-sampled mean is equal to zero (* 0.1 ** 0.05 *** 0.01).
Source: Own calculations based on a 10% student sample from Saber 11 2013-II.
Table 2 Descriptive Statistics II
† Data from ICFES official classification for 2010 if 2011 is not available.
± Starts show the significance of a test checking if the difference between the sampled and non-sampled mean is equal to zero (* 0.1 ** 0.05 *** 0.01).
Source: Own calculations based on a 10% student sample from Saber 11 2013-II.
To guarantee comparability and avoid noise from unobservable factors, the sample was depurated by omitting individuals with missing information or extreme values, for example missing information on parents' education or scores equal to 0 or above 100. More details about these restrictions are presented in the Appendix.
The average student was 16 years old. This reflects that the choice of future investment in education is made by very young people (Tables 1 and 2). At the individual level, there is considerable dispersion in the scores obtained in mathematics and verbal analysis. These test scores were published after the questions regarding expected returns were completed (about 6 months); therefore, expectations are not affected by them. A family's socio-economic index, which is constructed using a set of variables that describe the physical assets owned by the household, reflects that the students' living conditions are equivalent to those of the middle-low class.5 At the school level, there is a higher incidence of cohorts above 90 students where boys are less numerous than girls. More than 60% of the student population come from households with a low educational background (Table 2). That is, the fraction of students whose mother has a professional education is less than 7.0%, and less than 8.0% in the case of the father. These statistics reflect a similar situation for people around the country. Human capital in parents is crucial in terms of the support provided to enroll in higher education, but also because of its impact on students' motivation. It is interesting to note that the incidence of gold mines is nearly 14%. There are less boys than girls (boys -45.3%), and about 77% come from publicly-managed schools. Another aspect worth mentioning is the low incidence of students with any type of handicap (e.g., visual, auditory, and physical movement), but it is crucial to include it in terms of perceived limitations and expectations for the future.
We added some additional controls regarding economic and political heterogeneity (Table 3). Among these, some variables relate to economic conditions (poverty rate per municipality and an index of standard of living), the existence of booms (the number of licenses for extracting gold, a commodity whose price has boomed since the great recession), and variables related to violence. The existence of mining booms may influence educational expectations, as does the incidence of violent events.
Table 3 Data Sources
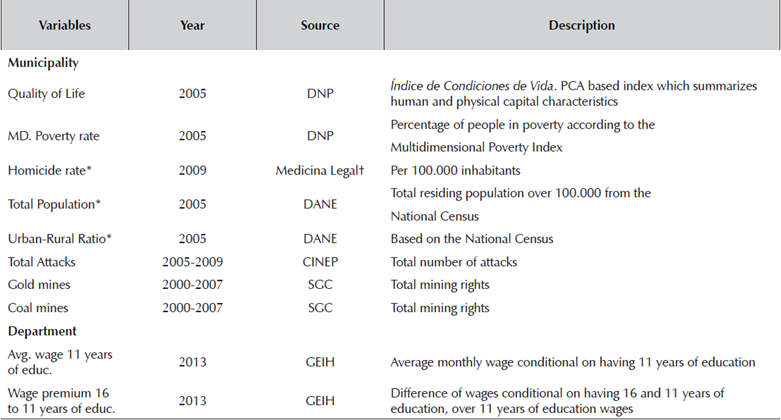
*Obtained via SIGOT web page. t National Legal Medicine and Forensic Sciences Institute. DANE: National Statistics Department. DNP: National Planning Department. SGC (INGEOMINAS): Colombian Geological Service. CINEP: Popular Education and Research
Source: Authors' calculations
To compare students' expectations with actual earnings, we constructed a distribution of observed earnings in 2013 from the National Household Survey (Gran Encuesta Integrada de Hogares, GEIH for its acronym in Spanish). This is based on students' gender, and their age plus 5 years. That is, we have constructed a proxy of their earnings in 5 years. We assume that the observed earnings for 2013 will not change at all within the age, gender, and schooling levels. This is not a particularly strong assumption, given that the macroeconomic conditions in the country have been stable over the last 20 years. The annual inflation rate in Colombia has been below 10% since 2000, and the GDP growth rate has been between 1.7% and 6.9% during the same period.
2.1 Subjective Earning Expectations
Our indicator of expected earnings is constructed from the use of the following question in the application form: 'In five years, what monthly income do you think you would earn in each of the following situations (a. You only finish middle education and pursue no more studies; b. You study for a vocational career; c. You finish higher education (any major) at college or university)? 'The most useful scenario is one in which perceived labor incomes were gathered as a continuous variable, but ICFES decided to collect it in minimum wage (MW) intervals in order to guarantee time-comparability for questions in future exercises.6 The minimum wage is an important reference number recognized by people in the Colombian labor market, given that employees typically earn either 1 MW, or their wage is defined in terms of MW. It is also used for defining the value of several official figures, such as fines and legal compensations. The categories selected by the ICFES were:
1. Less than 1 MW,
2. Between 1 and 2 MW,
3. Between 3 and 4 MW,
4. Between 5 and 7 MW,
5. Between 8 and 10 MW,
6. More than 10 MW.
The choice of intervals always includes a subjective judgment because of the trade-off between the number of intervals and their amplitude. Fewer intervals make it harder to detect variations on the conditional mean of the latent variable, but make it simpler for the student to understand and answer the question. Moreover, the values defined for some categories were misleading, as they avoid the possibility of some intervals (e.g. between 2 and 3 MW), and are completely arbitrary. Although these are the most obvious problems (which we address in the robustness checks by modifying the values of the cut-offs), there are conceptual issues that are harder to tackle. In particular, the fact that we are imposing values for the thresholds might generate anchoring: that is, individual responses might be determined partly due to the way in which the options are presented. In the case of education, Heckman et al. (2010) suggest it is desirable to anchor skills in a common scale in order to gain a better understanding of the relative importance of cognitive skills and their importance of investments at different stages of the life cycle; however, the number of categories and their meaning provide information to the respondent that might influence their choice. In other words, if someone is questioned about their expected performance in a continuous (i.e., categorical) scale, his/her answers may differ because the structure of the options indicates a relative perceived self-valuation.7 Hence, even though we present some numbers that can be interpreted in terms of the Colombian currency, they are mainly for illustrative purposes. In fact, our analysis focuses on terms of order, rather than magnitude.
2.2 Test Scores and Progress to Higher Education Expectations
Among other factors, test performance depends on self-motivation and expectations about future educational choices. One of the advantages of our sample is the availability of information about the scores expected by the students, as well as whether they expect to be enrolled in a tertiary education programme. These expectations provide us with some intuition about self-perceived ability, tastes and effort.
Regarding mathematics and language scores, students were asked to choose their expected results from the categories below. For our analysis, the cut-off points are translated into standardized test scores.8
The Likert Scale was employed in expectation of enrolment in tertiary education.
I will not continue studying
It is unlikely that I will enter a higher education program
It is likely that I will enter a Higher education program and
Surely I will enter a Higher Education program
For our empirical exercises, these answers were collapsed in a dummy variable that it is equal to 1 for c and d, and 0 otherwise.
2.3 Empirical Strategy
We proceed to carry out two types of exercises according to the database. First, we check the existence of any correlations between expectations and some of the socioeconomic variables. Second, we intend to study the relationship among test scores and expectations. In the first case, the structure of the database only allows us to observe labor income and test scores as categorical variables. Then, we proceed to use interval regression to determine how the observed characteristics of the students, their families, and their schools and municipalities are related to expectations.
Apart from reported wages w ijl for student i from school j in level /, earnings ratios between wage with schooling level l over wage in m level (R i,l,m ) are calculated by assuming the midpoint of each reported wage category.
Under the Interval Regression approach, the underlying variable w* is observed in C intervals defined by the cut-offs {K 1 ,...,K C-1 }. Then, if w* is between the values K C-1 and KC, the categorical counterpart will take the value w c (see equation 1).
By following Stewart's (1983) approach, it is necessary to impose a restriction on the way the truncation is done. That is, we need to model the probability of an individual choosing a particular category wc, as in equation 2.
For simplicity, we can assume Fe ~ Ν(0,σ2), so the model can be easily estimated by maximum likelihood. As we assume that the category thresholds are credible, the marginal effects can be understood in the usual way. The assumption of normality is crucial for providing monetary-based estimates on the marginal effects of each regressor. Hence, such values might change as another distribution is considered. However, the relationship between regressors and beliefs is given by the ordinal feature of our perceived returns variable.
Consistency is achieved if we assume that e is uncorrected with respect to X ij . This might be a strong assumption, given that unobserved characteristics such as motivation might be related to better academic achievement and to higher expected returns. This would be reflected in an upward bias of our estimates. Additionally, the values of our estimates in terms of 'pesos' are determined to a large extent by the values of the thresholds. How would the results change if the cut-offs were chosen differently? This is provided by the normality assumption of e ijt .
In the second case, test scores and expectations, our dataset allowed us to compare both earnings and academic expectations with the actual test scores, which took place several months after the elicitation of beliefs. We can thus understand how private information embedded in expectations is related to test performance. To assess their relationship, we will estimate a linear regression for test scores, and discuss whether expectations information adds new information into the analysis of observed characteristics. Although school-level fixed effects are normally considered in this type of exercises because of the effect of unobserved variables on individual beliefs, the main issue is related to maximum likelihood estimation. The number of schools (9888 in the dataset) makes it hard for the optimization algorithm to estimate such large number of parameters.9 This is an important caveat for the individual and household level regressors, where the school and municipality levels might not be enough for disentangling individual from classroom effects.
3. Results
3.1 Earnings Expectations and Observed Labor Income
Our analysis allows us to compare earnings expectations between two scenarios, high school vs. vocational studies, or high school vs. college. A first result is that students consider that investing in additional years of education will provide a substantial payoff in the case of college, and notoriously less in the case of vocational education. This is observed in Figure 1, where both the distribution of expected earnings from vocational and college education are to the right of expected earnings from high school distribution.
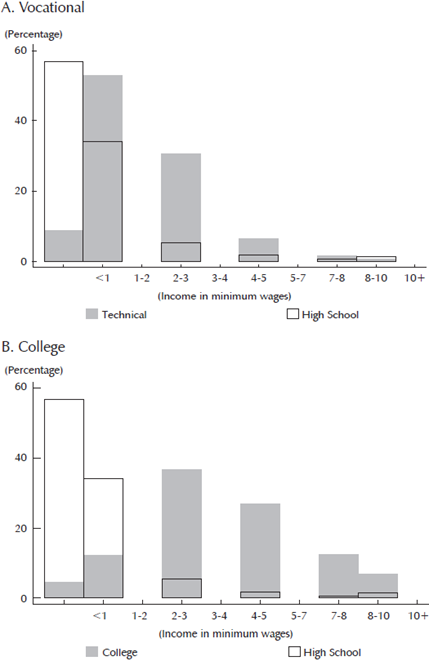
Source: Own calculations based on ICFES expectations survey.
Figure 1 Distribution of Subjective Expected Earnings
Perhaps the most striking result comes from comparing the current labor market information and students' expectations. Colombian students do not underestimate college graduates' wages. Instead, they highly overestimate them. Figure 2 compares the expected and observed earnings for 2013, which are conditional on attaining a college degree or just completing high school. There are several points to consider in these figures. First, it is likely that part of the overestimation comes from the anchoring: students tend to value college education in a higher income category just because they perceive them as "high". Second, since the question design omitted some categories, the central values of our distribution are biased. Third, overconfidence is a common result when eliciting returns on investments, as discussed by Brunnermeier and Parker (2005). As a result, it is hard to say by how much the students are overestimating their potential future earnings.
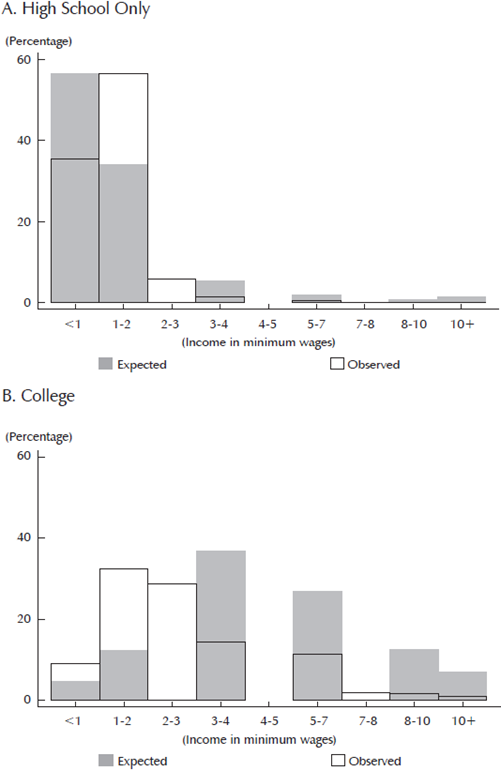
Note: Observed wages correspond to monthly earnings reported by individuals aged 20 to 30 years old who are working and meet the education level criteria in the GEIH survey. Such figures were divided by 589.500 COP, an official monthly minimum wage in 2013, and the classified into the corresponding categories. Source: Own calculations based on the GEIH and ICFES expectations survey.
Figure 2 Expected vs. Observed Earnings
Despite these limitations, as shown in the local linear analysis in Figure 3, expectations follow variations in observed earnings (both 2012 and 2013 values) of people aged 20 to 30 years old.10 However, the relationship is flat for college in places where average earnings are between COP 1.2 and 1.6 million (around 2 to 2.5 minimum wages). There are several potential explanations for this. First, it could be a result of the categorical design of the question, which makes it harder to detect small variations. Second, it could be due to a lack of diffusion of wage information in areas where wages are low. Third, it could indicate that students consider that the relevant labor market is not the same as the one in which they live. This is plausible, considering that many students typically migrate to the main cities to pursue college education.
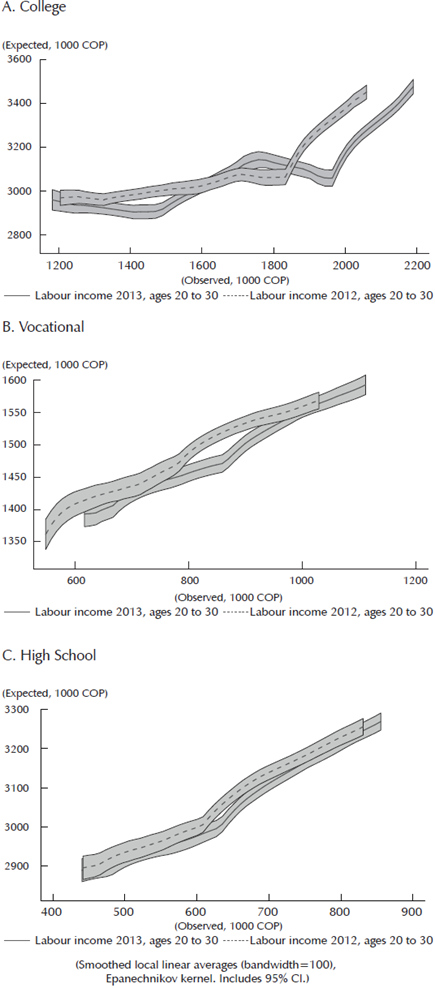
Table 4 reports the result of the interval regressions analysis. The first three columns summarise the marginal coefficients for each academic level expected, while the last two include earnings ratios (the ratio of perceived earnings between one academic level and the prior level). From this table, we can comment on some interesting correlations.
Table 4 Interval Regression Marginal Effects
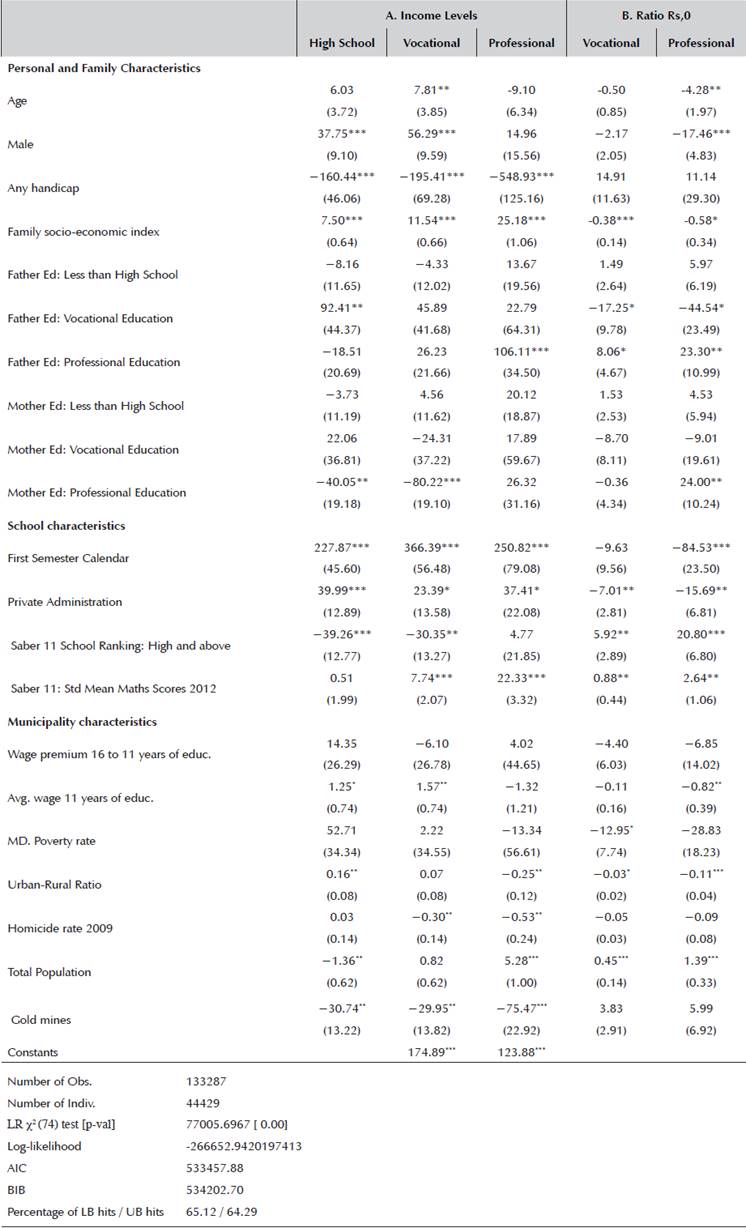
Calculated by the Delta method at the averages. SE clustered at individual level. Significance: 99% ***; 95% **; 90% *.
Source: Authors' own calculations.
3.1.1 Individual and family characteristics
First, older students expect lower earnings from investing in professional studies. This can be explained by the fact that older students are both more likely to have repeated a year, or to have suffered from gaps during their secondary education. These two elements are related to both socio-economic conditions and cognitive skills, which are directly related to the earnings ratio.
A second relevant result is related to gender. Differences in perceived earnings are common for lower educational investments. Boys tend to expect higher wages from basic and vocational education than girls, but this difference disappears for college-level income. This is an interesting point for future research because it could be associated with labor market barrier beliefs in women regarding the availability of vocational jobs. Previous findings suggest that parents' expectations matter in terms of investing in education, and they are strong predictors for the probability of being enrolled in secondary school (Attanasio and Kaufman, 2009; Armand, 2015). Recognizing that 'drop out' levels were still important, the Central government implemented conditional cash transfers such as Familias en Acción and Jovenes en Acción. These benefits were intended to reduce demand barriers to human capital accumulation, which increased the number of girls completing high school and enrolling in higher education. These initiatives increased girls' competences and relative labor income. This contributed to a decline in perceived and observed gender wage gaps during the last years in Latin-American countries (Ñopo and Hoyos, 2010; Barrera-Osorio et al., 2008). Another common earnings gap is noted among people who report a disability, who notoriously expect lower wages in any category.
Third, it seems that more privileged students tend to value higher earnings at each additional educational level. That is, students belonging to wealthier families, or with college-educated parents, will opt to increase their human capital more than those who do not have enough economic resources.
A significant result is that students whose parents have a vocational education report higher earnings for secondary-only education, which means that the perceived benefits of both vocational and college education are lower than for those children with parents without post-secondary education. There might be at least two reasons explaining this result. On one hand, students from low socioeconomic background could have lower expectations because of the observed realizations in their environment that downplay their aspirations. On the other hand, more informed youths tend to be less optimistic about the added value of additional investments on education.
3.1.2 School characteristics
School characteristics are essential for explaining both income and academic expectations, not only because schools train children for the labor market and tertiary education, but also because they reflect parents' choices. Children enrolled in good schools evidence the importance (and financial means) that parents give to education, which is probably correlated with the pecuniary returns on such an investment.
The first element to consider is the quality of the school. We measure it according to prior results on the Saber 11, and on the ranking given by schools. They show that better schools imply higher earnings if the student goes to college, and lower ones for any other level.
A second aspect to consider is whether a student is enrolled in a public or private school. Public schools are subsidized, but, more importantly, they have fewer tools for controlling the background of their students at enrolment. Private schools can target specific needs of families (such as religion), filter their students with entry exams, and choose the socio-economic background of their students by determining their tuition fees. Results show that students from private schools believe that they will be better-off in any scenario by approximately the same amount of money, which slightly reduces both the college and vocational students' ratio. This result is particularly interesting, as it is already conditional on the socio-economic characteristics of the household, municipality characteristics, and school ranking. Since private schools are highly heterogeneous in terms of the economic conditions faced by the students and they cover about 30% of total enrolment, their expectations may differ because of multiple reasons. Schools that apply the Saber test in the first semester are private and represent a small fraction of total enrolment (less than 5%), but they provide education to the upper tail of income distribution and their students expect a profitable future, on average.
3.1.3 Municipality characteristics
Once we consider personal, family and school variation, the role of municipality characteristics is notoriously less important. Elements such as: poverty rate, urban-rural ratio, and homicide rate are irrelevant once we consider wages and population size. The table shows that students in bigger cities expect higher salaries after college education. It also reflects the lower earnings ratio of college and vocational studies in places that pay better wages to workers with secondary-education. This reflection of regional labor market characteristics, also discussed above, shows that individuals are informed about wages, despite the general overestimation of tertiary education earnings.
A particularly interesting case is the presence of gold mines. Whether mining booms undermine expected returns to education is an open research question that is relevant for developing countries, but which cannot be addressed within this framework. However, the present results suggest that further analysis of this question is relevant: the presence of a gold mine in the municipality is associated to lower income expectations in any educational attainment scenario. Nevertheless, goldmine municipalities have families with lower income, in general, according to the Saber 11 socio-economic index,11 which could confirm this finding.
3.2 Expected Test Scores
Figure 4 compares expectations about test scores and actual results. On average, expectations clearly signal performance. There is a significant difference in mathematics of around 9 points (0.8 standard deviations) between those who reported the highest category against those who reported the lowest. In the case of the language test, this difference is about 5 points (0.7 SD) and significant at the 99% level.
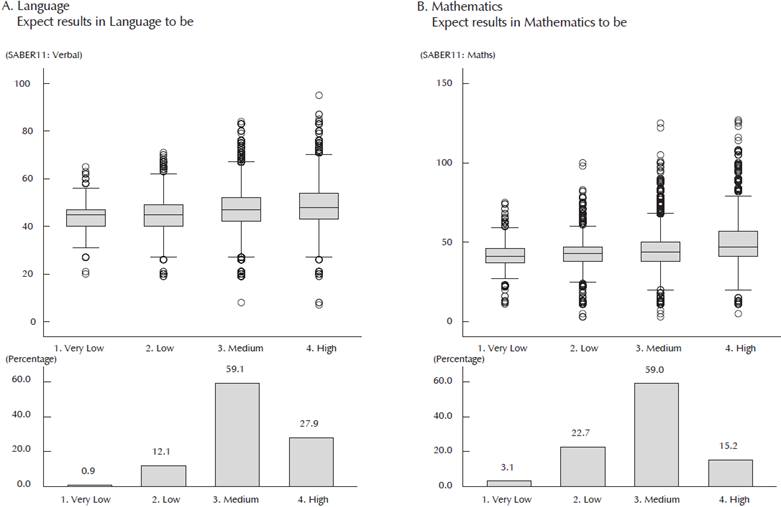
Source: Own calculations based on a sample from SABER 11 2013 data.
Figure 4 Test Realizations and Expectations
Additionally, students who expect longer educational investments (who are more likely to progress into higher education) exhibit higher performance. Figure 5 shows that the distribution shifts with each category. For both language and mathematics, there is a significant difference between the lowest and highest categories. These results seem to suggest that there are important links among these variables, and that both relationships encapsulate information on beliefs, ability, and other inputs that are crucial for the performance of test-scores.
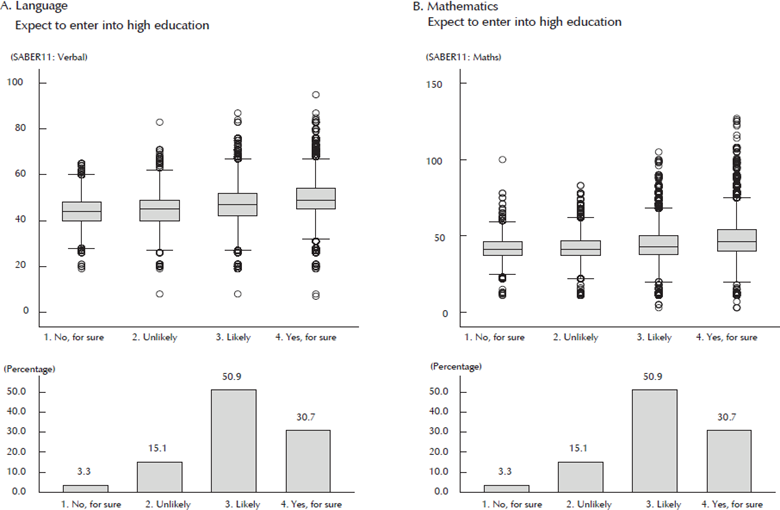
Source: Own calculations based on a sample from SABER 11 2013 data.
Figure 5 Test Scores and Expectation to Progress into Tertiary Education
A more formal analysis is presented in Table 5, which exhibits the marginal effects after an interval regression. The table shows that the key predictors of test results such as age, socio-economic index, parental education, school quality, or the presence of a disability are correlated with both test results and education attainment expectations. There are clear differences between boys and girls in terms of expected test results and the probability of pursuing tertiary education. Also, as with expected earnings, students from private schools expect higher test scores and attendance at college.
Table 5 Expected academic outcomes and student, school and municipality characteristics
Columns 1 and 2 present marginal effects from a model using intervals of the expected Saber 11 test scores as outcomes. Column 3 presents marginal effects after a Probit regression where the outcome is whether the student considers it likely or very likely to enroll into college education. SE clustered at school level. Significance: 99% ***; 95% **; 90% *.
Source: Authors' own calculations.
3.3 Test Results and Expectations
Table 6 summarizes the relationship between test scores and both expected earnings and academic achievement. In this case, the analysis is based on a linear regression where the dependent variables are the standardized mathematics and language results. Columns 2 and 4 present a regression without expectations, while Columns 3 and 5 include such information.
Table 6 Subjective expected earnings, academic outputs, and Test Scores
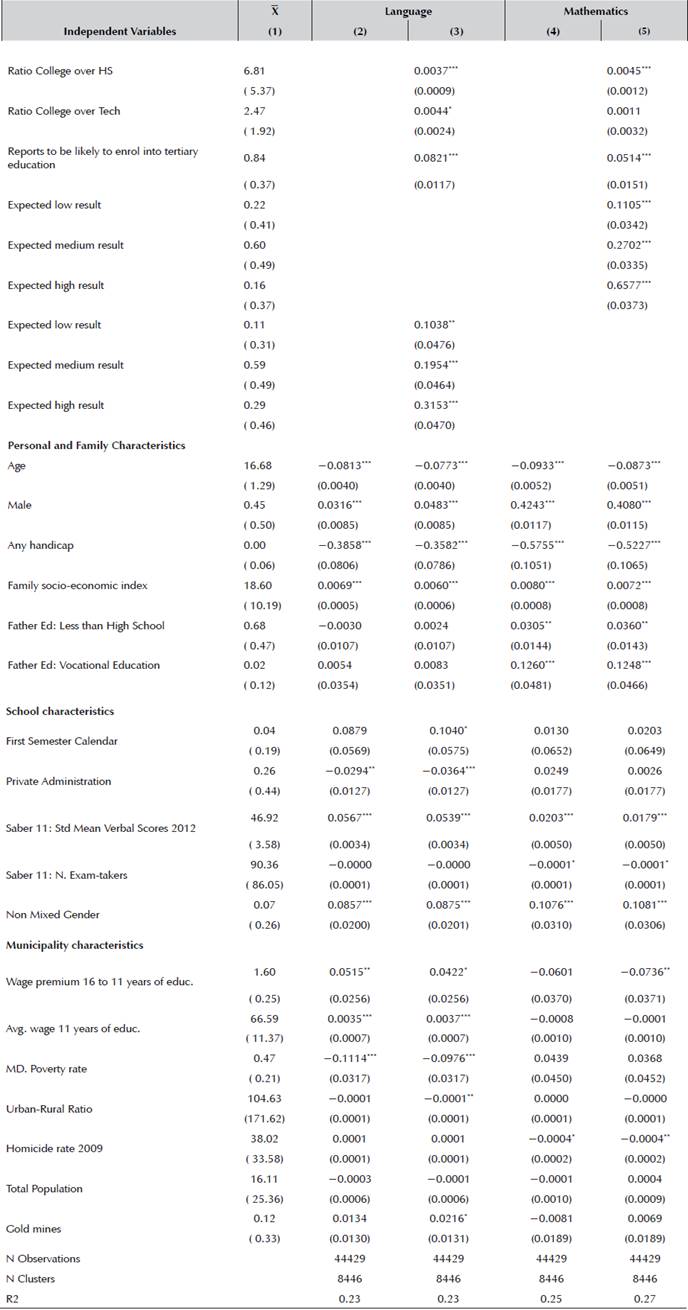
Estimates from Ordinary least squares regressions. SE clustered at school level. Dependant variables, in the columns, are standardised Saber 11 test scores. Independent variables, in the rows, include ratios derived from the subjective income expectations, where the medium value is assigned to each response category. In Panel B, regressions include controls on students, family and counties characteristics (see data section for more details). Significance: 99% ***; 95% **; 90% *.
Source: Authors' own calculations.
In terms of the basic individual, family, school, and municipality characteristics, the pattern is the same as for the expectation questions. A difference that is worth mentioning is the gender gap in language. While in mathematics there is a clear difference between boys and girls both in terms of expectations and results, boys expect lower results than girls in the language test. This difference is not observed in the actual data.
Another interesting difference is the role of private schools. Conditional on socio-economic characteristics and prior school results, students in private schools expect better scores than those in public ones. However, in the data analyzed data, they do slightly worse than public ones. By dividing private schools according to their tuition fees (lower 50% and upper 50%), we found that the increase in earnings expectations is concentrated on the upper tuition group, and the reduction on language test scores is found for the lower tuition group. Nevertheless, the upper tuition level does not perform better in the test results once all the controls and expectations information are considered.
Another result is the explanatory power of expectations. Excluding expectational information, we were able to explain around 23% of the performance in mathematics and 25% of the language results. Once we included beliefs data, the mathematics R2 remained at 23% and language increased to 27%. This result tells us that expectations do not improve our understanding of the test results, once we consider the main individual, household, school, and municipality covariates. In other words, information on items such as motivation, self-esteem, and non-cognitive abilities, which are contained in the expectations, does not improve the ability of the model to explain the variation on test scores. This does not mean that such variables are not relevant, rather than test-score expectations do not capture such information appropriately. There is an important caveat, however: that the categorical responses used for eliciting information might be responsible for the loss of relevant information. Moreover, with our current design, we do not know whether this information improves elements such as actual enrolment in tertiary education.
3.4 Robustness Checks
We performed several robustness checks to assess the correlations described about earnings expectations. A more detailed description and tables with their outputs are available as an online appendix.
First, we redefined the cut-offs of the interval regressions to consider whether the marginal effects were affected by the numbers imposed by the upper and lower limits stated for each category. The purpose of this exercise was to remove the gaps between the non-continuous intervals by stablishing a cut-off between them: for two given intervals [A, B] and [C, D] where D>C>B>A, we considered defining as the cut-off between categories first B, then C, and finally  Marginal effects remained the same in sign and significance for all variables, which is the goal of our estimation strategy given the limitations imposed by the data collection exercise.
Second, we considered the inclusion of individual and household covariates alone, as well as how the coefficients vary when school and municipality level controls were considered. The purpose of this exercise was to detect if the main effects were sensitive to the specification. As a result, the magnitude of some of the individual and household coefficients increased when the school and municipality controls were excluded, but again, sign and significance were preserved. Also, we experimented with alternative clustering specifications-instead of an individual level, we considered school and municipality level clustering of the error. Typically, standard errors are larger than in the individual-level exercise; however, almost all coefficients keep the same significance level.
In a final exercise, we considered as an outcome whether the student expected higher wages under the vocational education scenario than in high school, and a similar variable for professional education. The goal of the exercise was to simplify the assumptions required for the estimation by reducing the problem to a binary response exercise, with the cost of a less sensitive outcome.12 Most of the variables explaining the differences on the premium are the same as the ones described above: age, gender, socio-economic index, parents' education, observed wage, and wage premium in the metropolitan area, school ranking, and mean math scores.
4. Conclusions
This paper analyzed the earnings and academic expectations of a random sample of 10% of the students who took the official secondary education leaving test, Saber 11, which is required to enroll for academic or vocational studies in the country. First, we studied how these expectations correlated with individual, family, school, and municipality characteristics. Second, we considered their relation with actual test scores, which took place several weeks after the elicitation of the beliefs information.
First, we found that expected earnings in each level of education follow the trends observed in local labor markets, particularly wages for individuals 5 years older than the students tested. Contrary to Jensen's (2010) finding regarding secondary school returns in rural Dominican Republic, there is evidence that Colombian students expect a notoriously higher income once they have obtained a college degree, which is consistent with Bonilla et al.'s (2015) analysis in 120 schools in Bogotá.
Second, earnings expectations follow some patterns observed in the data, such as gender gaps and disability gaps. An interesting finding in this direction is that the gender gap is not present at the level of college education. This might be related to the fact that more girls significantly expect to enroll in college education than boys. This is conditional on school quality. However, simultaneously, during the last decade, there was a higher fraction of girls completing secondary education in Colombia (the number of girls taking the Saber 11 test is higher than boys during the last few years). Since vocational studies are, on average, more affordable for low-income individuals, it is likely that expectations toward premiums differ in each modality of post-secondary education according to parental expectations. However, as was mentioned before, parental expectations (Attanasio and Kaufman, 2009; Armand, 2015) and a decrease in demand barriers (Barrera-Osorio et al., (2008; Nopo and Hoyos, 2010) encourage women's participation and delay fertility choices (Glassman, 2015).
Third, students in private schools expect higher wages, higher test scores and higher odds of enrolling in tertiary education, despite conditioning on the socio-economic characteristics of both families and municipalities, and the observed performance of schools in prior Saber 11 tests. This result is particularly interesting, considering that test scores do not show such high-test scores premium. Such a difference in expectations indicates that enrolment in private schools is related to a family's desired academic outcome for their children, but does not guarantee a better performance once we consider their performance in prior Saber 11. As a result, it is of primary relevance to encourage policy-makers to divulge test results, so that families can choose schools based on accurate information on their quality.
Finally, expected earnings and test scores embedded private information that explains the variation in actual test scores, even after conditioning on key characteristics. However, they only marginally improve our ability to understand the test score outcomes. As shown by Bonilla et al. (2015), it is likely that information interventions have very limited power in terms of improving tertiary education enrolment in Latin America.