English (pdf)
 Article in xml format
 Article references
 Send this article by e-mail
 Cited by SciELO
  Cited by Google
  Similars in
SciELO
Similars in
SciELO  Similars in Google
 Permalink
1. Introduction
In a country with a federal structure, the central government is responsible for allocating and transferring funds for various economic activities to the states / provinces. These funds are mainly grants or loans. However, in a federation, the central government has the incentive as well as the capability to manipulate the transfers given to the states (provinces / sub-national jurisdictions) so as to enhance the possibility of winning the election.1 This idea is closely linked to the notion of a political budget cycle (based on the concept of a political business cycle), which alleges that the government can opportunistically manipulate fiscal policy in order to increase the possibility of winning the election (see Nordhaus, 1975; Hibbs, 1977; Drazen, 2000; and Manjhi and Mehra, 2016 for a theoretical exposition, and Drazen and Eslava, 2010; Aidt, Veiga, and Veiga, 2011; and Chortareas, Logothetis and Papandreou, 2016 for empirical evidence on this issue). Similar to Drazen and Eslava, 2010; Aidt, Veiga, and Veiga, 2011; and Chortareas, Logothetis, and Papandreou, 2016, this paper attempts to trace the political transfer cycles (PTC) in the context of India, and whether these transfer cycles help win the elections. Since its independence, India has evolved from a centralized quasi-federation to a cooperative and competitive structure of centre-state power relationship. In the aggregate, however, the union tends to wield greater power as compared to the states regarding federal interactions of tax and revenue sharing. Specifically, in this power-sharing arrangement, the central government always attempts to keep more power to itself, of which control over centre-to-state transfers is a significant manifestation. Additionally, driven by the motivation to retain incumbency, the centre may also attempt to channel higher opportunistic transfers to certain states in order to finance their expenditure.
Several important earlier studies on political budget cycles (PBC) include the following: after Nordhaus (1975), the brief forty years' analysis of political business cycles (Hibbs, 1977; Frey and Schneider, 1978; Cukierman and Meltzer, 1986; Alesina, 1987, 1988, etc., under adaptive expectations) moved on to understanding the PBC as introduced by Rogoff and Sibert (1988), Rogoff (1990), and further extended by Drazen (2000), with the latter two works covering fiscal/ budget components in detail along with monetary variables in the framework of Active Fiscal Passive Monetary (AFPM) cycles, and not just the inflation-unemployment trade-off cycles based on the Phillips curve as explained in Nordhaus (1975). The recent strand of research on PBC models is mostly based on fiscal and monetary policy under rational expectations, and can be attributed to the following works: Rogoff and Sibert (1988); Rogoff (1990); Persson and Tabellini (1990); Alesina, Roubini, and Cohen (1997); Shi and Svensson (2002a); Shi and Svensson (2002b); Shi and Svensson (2006); Persson and Tabellini (2003); Brender and Drazen (2005); Drazen and Eslava (2010); Aidt, Veiga, and Veiga (2011) ; Efthyvoulou (2012); Manjhi and Mehra (2016), etc.
The specific studies related to the analysis of centrestate transfers are divided among theoretical, empirical, and studies for India. Among the theoretical works, Sengupta (2011), Sengupta (2016), Inman and Rubinfeld (1994), Lindbeck and Weibull (1987), and Dixit and Londregan (1995, 1996, 1998a, 1998b) are important. Sengupta (2011) demonstrates that federal welfare may actually increase with politically motivated transfers, and that the state ruled by the same government as the one in the centre receives higher grants, hence, spending more on public good. Sengupta (2016) finds that if a central government grant is tied up with a public project for the province, provincial tax and central transfers tend to be strategic substitutes: higher central transfers lower the marginal utility of public projects to the province, and the latter responds by cutting down taxes. There are studies that cover the political influence as follows: Inman and Rubinfeld (1994) show how the central government's local representation and assignment of responsibility affect the political values of participation, protection of individual rights, development of civic virtues, allocation of goods and services, and, hence, economic efficiency. Lindbeck and Weibull (1987) and Dixit and Londregan (1995, 1996, 1998a, 1998b) construct a theoretical model of tactical redistribution, which describes how a political party will design its policy platform in order to target electoral goals. Among the last set of papers, the former aims at winning the election, and the latter set of papers analyses the maximization of vote share.
Some of the important empirical works are Kroth (2012); Reid (1998); Kneebone and McKenzie (2001); Drazen and Eslava (2010); Brender and Drazen (2013); Baskaran, Brender, Blesse, and Reingewertz (2016); Brollo and Nannicini (2012); Baskaran and Hessami (2014); and Chortareas, Logothetis, and Papandreou (2016). Kroth (2012) uses a panel data set of nine provinces of South Africa over the period 1995-2010 and derives two important results. First, provinces where the national ruling party faces higher electoral competition tend to receive higher per capita transfers in the year before the election. Second, this increase is driven by a conditional grant, which is the non-formulaic component of the total inter-governmental transfer. The evidence of local budget cycles can also be found in Reid (1998) and Kneebone and McKenzie (2001) for Canadian provinces. Drazen and Eslava (2010) provide descriptive evidence of a significant increase in investment prior to elections in local governments in Colombia, an increase that is only partially compensated by a decrease in government consumption, whereas Brender and Drazen (2013) find a large change in the composition of expenditure in the established democracies during the election. Alesina and Paradisi (2014) find a strong PBC particularly for the south of Italy with the use of a 'lower tax' regime close to the election. Baskaran, Brender, Blesse, and Reingewertz (2016) find that a low share of revenue raised by the Israeli local municipalities' budget creates excessive dependence on central government transfers, and hence on the PBC. However, a tightening of the monitoring procedures eliminates it. Brollo and Nannicini (2012) find that politically-aligned municipalities receive larger infrastructure transfers in Brazil, whereas Baskaran and Hessami (2014) find that the left-wing state government favours left-aligned municipalities more, but the right-wing state government favours the non-aligned ones. In fact, the right-wing state government had to 'buy off' the unaligned municipalities as there were only a few local councils with absolute right-wing majorities during the tenure. Chortareas, Logothetis, and Papandreou (2016) find an opportunistic PBC pattern in the budget balance, in the total expenditure and investment expenditure, and in the borrowing revenues, irrespective of whether the mayor runs for re-election or not, or whether the incumbents are politically aligned with the central government or not. Also, the opportunistically enhanced expenditure by the incumbent is electorally rewarded.
The papers specific to India are: Khemani (2004); Rao and Singh (1999); Biswas and Marjit (2005); Dasgupta, Dhillon, and Dutta (2004); Arulampalam, Dasgupta, Dhillon, and Dutta (2009); Rao and Singh (2007); etc. Khemani (2004) shows that electoral budget cycles affect the composition of local budgets. That is, that the Indian state governments do not manipulate aggregate fiscal variables such as total spending or deficits in the run-up to an election, but manipulate individual budget items and investment on public projects instead. Rao and Singh (1999) demonstrate that implicit transfers in India disproportionately benefit the richer states, whereas Biswas and Marjit (2005) show that the states' representation in the central government's cabinet affects the state-wise distribution of letters of intent and industrial licenses. Dasgupta, Dhillon, and Dutta (2004) and Arulampalam, Dasgupta, Dhillon, and Dutta (2009) construct a redistributive model of politics where the central government is opportunist and uses its discretion to disproportionately provide grants to the aligned states in India. Rao and Singh (2007) analyse the institutional process through which reforms take place and the influence of politics on institutions such as the FC.
Similar to the concept of PBC, one can hypothesize the centre-state PTCs and pose the following question: Can the government at the national level strategically transfer financial resources to the states? Also, if by transferring the resources it can increase the chances of winning the election and form the government in the next electoral term? For instance, it is shown that opportunistic behaviour helped the incumbent win the election in Colombian municipalities (Drazen and Eslava, 2010) and spending more opportunistically close to the election helped win the election in Portuguese municipalities (Aidt, Veiga, and Veiga, 2011). Further, Chortareas, Logothetis, and Papandreou (2016) also confirm that opportunistic expenditure by the incumbent is electorally rewarded in Greek municipalities.
In many ways, this paper is an extension of the analysis of political budget cycles in terms of centre-state federal transfers in the context of India. It follows the frameworks similar to those in Drazen and Eslava (2010) and Aidt, Veiga, and Veiga (2011), specifically the approach used in the former, wherein two separate equations have been estimated by the authors: one for the political determinants of public expenditure and another one that analyses the election outcome as a function of politically-motivated expenditures and other controls. We follow a similar approach for our analysis in the context of centre-state transfers. Furthermore, unlike Drazen and Eslava (2010); Aidt, Veiga, and Veiga (2011) and Chortareas, Logothetis, and Papandreou (2016), who primarily rely on a generalized method of moments and its variants, and the theoretical analysis of federal transfers as in Sengupta (2011, 2016), this paper focuses on the political determinants of transfers using the pooled mean group method (PMG), which helps overcome the concerns of endogeneity as well as to analyse the long-and short-run effects of election variables on transfers. Additionally, in order to analyse the effect of a politically motivated transfer on the electoral outcome, a Logit method has been used. To the best of our knowledge, this analysis has not yet been attempted for India. The time period covered by the analysis is 1980-81 to 201011. India has a multi-party democratic system, and many of its states are ruled by regionally dominant parties that are different from those at the centre. At the same time, the governments in the centre and state levels may be a single party majority or a coalition government. Consequently, the operation of centre-state transfers with respect to parliamentary and assembly elections can be potentially different, driven by varied socio-economic-political goals. So far, most of the studies have used assembly elections for their analysis. This paper analyses both the parliamentary (national/ union) and assembly (state) elections separately.
The key results and contributions derived for the Indian federal structure regarding the political determinants of transfers and, conversely, the effect of transfers and other controls are as follows:
Political transfer cycles are more pronounced in the year before parliamentary elections and in the year of assembly elections in the case of loans from the centre, whereas weak transfer cycles in terms of grants from the centre are found only in the year before the assembly elections.
Right-wing and coalition governments, in general, provide lower transfers to the states in both the year of union and state elections, exception for higher grants from the centre to the states in the year of assembly elections.
Having the same party in power at the union and state levels, or the state-ruling party being aligned to the union government is associated with higher grants and loans than the non-aligned ones.
The opportunistic manipulations of grants from the centre in the year before the parliamentary elections, and the levels of loans from the centre in the year of the assembly elections can help the government to regain its power.
Inflation is electorally harmful for the government, as it increases the likelihood of losing the election at the union level, but not necessarily at the state level.
A higher population density is less likely to win the parliamentary elections, but more likely to win the assembly elections. Similarly, higher voters' turnout help win the election, but the number of years of experience in government is not really important, electorally.
A right-wing government is more likely to win the assembly elections, but not necessarily the parliamentary elections. This is a novel result of this research, and it ties in well with similar observations made by Lakoff (2014). On the other hand, if the centre and the states have the same government, or if the state government is an ally, the possibility of retaining power for the union government is reduced, but it is higher in the case of the state-level government.
Furthermore, in general, a coalition government reduces the possibility of winning inboth the parliamentary and the state elections.
These results have practical implications as well. For instance, in order to receive higher transfers, regional and small parties can always try to be part of the coalition government at the centre. The opportunist government interested in winning can manipulate the transfers close to the elections. Similarly, the government can maintain a lower inflation regime in the economy and keep the ideological leaning right-tilted so that the chances of winning the election are improved.
The section-wise structure of this paper is as follows: section 2 covers a brief description of the Indian federation. The data and variables are explained in Section 3. The tracing of PTC is presented in Section 4, which uses a pooled mean group method. Section 5 discusses the effects of transfer variables and controls on the probability of winning the election in both the union and the state level by using a Logit model. Section 6 concludes the paper.
2. Fiscal Federalism in India
With the onset of economic liberalization in the post 1980s, some countries, namely, China, Brazil, Argentina, and Russia, moved toward a federal structure of centripetal kind, whereas some big federations such as Canada, the United States, and Australia were structured more as of the centrifugal type.2 India has moved from a centralized quasi-federation to a cooperative and competitive structure of the centre-state power relationship, and thus seems to have commonality with the former group. For India, the first three decades after its independence in 1947 up to the late 1980s can be termed as the phase of a centralized federation. The subsequent post-reform era can be broadly termed as that of cooperative-cM/w-competitive federation. This phenomenon is also supported by the idea of a coalitional structure of government, which came into existence effectively in the early 1990s. That is, the state governments that happened to be allies of the central government would mostly cooperate, whereas the non-allied ones would compete (Bagchi, 2003; Chakraborty, 2003).
The structure of the Indian federation comprises three tiers: national (centre), sub-national (state), and sub-sub-national (panchayat / municipality / district councils / village councils). On several occasions, the states have sought higher autonomy, but the centre has always maintained its supremacy in decision-making. In fact, in some cases, the centre has even amended the constitution in order to move items from the state list to the concurrent list and thus increase its own share of spending (George and Gulati, 1985). There is a clearly demarcated line of revenue generation at the national and sub-national levels.
Figure 1 shows the basic structure of the revenue and capital receipts.3 The transfers from the centre to the states under study are the components of revenue and capital receipts (italics in Figure 1). The total revenue of the states consists of total revenue receipts and capital receipts. Total revenue receipts contain tax revenue and non-tax revenue. Tax revenue is further segregated into the states' own tax revenue and shared taxes (tax devolution). Tax devolution consists of: (i) shared income taxes, (ii) shared estate duty, and (iii) share of union excise duties. The total non-tax revenue consists of the states' own non-tax revenue and grants from the central government. Grants from the centre have four components, namely: (i) non-plan grants, (ii) grants for state-plan schemes, (iii) grants for central plan schemes, and (iv) grants for centrally-sponsored schemes. Capital receipts contain the following: (i) market loans (ii) loans from the centre (iii) other loans (iv) state provident funds, etc. For our analysis of transfer cycles, we consider the italicized transfer variables from Figure 1, namely, grants from the centre (Gfc), loans from the centre (Lfc) and tax devolution (Td).4 Also, there are three ways by which the centre can transfer the resources, namely:
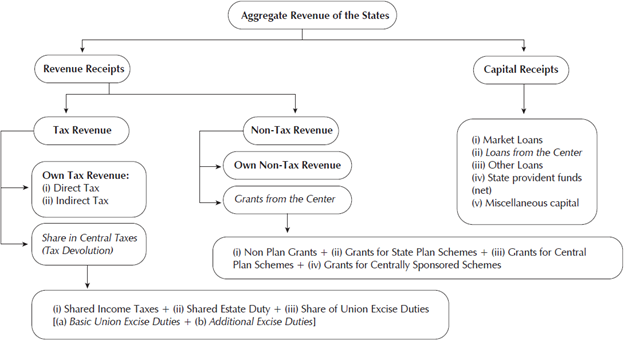
Statutory transfers=Shared taxes + Non-plan grants;
Grants for state-plan schemes;
Discretionary transfers=Grants for central plan schemes + Grants for centrally sponsored schemes.
There are three institutions that control the transfers from the centre to the states. Firstly, the Finance Commission (FC) decides on the level of the Td and non-plan grants and, since the FC is an independent constitutional body, the direct political influence is the least possible scenario here.5 So far, 14 FC reports have been tabled, and almost all have been accepted by the central government. Secondly, the Planning Commission would recommend grants and loans to implement development schemes.6 Finally, grants are provided by different ministries to specific projects which are fully funded by the centre (central plan schemes), or the costs of the development schemes are shared by the states (centrally-sponsored schemes). The grants for state plan schemes require the centre's approval of the projects proposed by the states; hence, some limited discretion is likely even in this case (Rao and Singh, 2003). In general, the possibility of political influence cannot be ruled out in the case of Gfc and Lfc, but this may not directly imply manipulation of tax devolution, unless clause 3(c) of Article 280 is used to direct the FC by the President of India for sound finance of the state. Moreover, even if political influence is the least possible scenario in Td, it has been considered in this paper as a comparative robustness check relative to Gfc and Lfc.
One of the basis for the transfers from the centre to the states is the revenue expenditure imbalance at the state level. That is, states might go on spending without any constraint (or without worrying much about the fiscal deficit), because that would, in any case, be compensated by the union government through transfers. In conclusion, this mechanism can create a moral hazard and lack of fiscal discipline among the states. This is one of the shortcomings, and the FC has been criticized for the use of grants to fill the revenue-expenditure gaps claimed by the states (Rao and Singh, 2007).7 The Gfc and the Td are mostly under the purview of the FC. However, there is already a greater role to be played by the Planning Commission (now NITI Aayog) and the central government for the transfers, such as the Gfc and the Lfc. Overall, it seems that the central government tries to maintain political control over the transfers in some way. Also, there is evidence of attempts to influence the entire transfer process. Rao and Singh (2007) and Rudolph and Rudolph (2001) state that, although the FCs use different formulaic-based decisions on transfers or grants, it has been observed that the states which are represented as members of the commission do relatively better in terms of the awards received.
The government's opportunism is depicted in Figure 2 (2A, 2B). Opportunism is measured in the form of "opportunistic deviation" and "opportunistic manipulation." Opportunistic Deviation = [ B ts - Mean (B s )] , where B ts is the reference year value for a particular year `t' in the electoral term `s', and Mean (B s ) is the mean of all the values in that electoral term ‘s'. The calculation of the mean of ‘B s ’ excludes the reference year t th value. Also, if the electoral term is incomplete, we consider the next electoral term including the incomplete period as well. In comparison, Opportunistic Manipulation = [ B yts - Mean (B s )], where ‘s' is an electoral term and `yt' is the year prior to the election or the year of the election value.8 It can be seen that opportunistic transfers are more pronounced for the same ruling party in both the centre and state governments, or for allied parties more than for non-allied parties in the year of the election and one year before the election (Dasgupta, Dhillon, and Dutta, 2004; Arulampalam, Dasgupta, Dhillon, and Dutta, 2009).

Note: gfc_d, lfc_d, and td_d are in terms of opportunistic deviation. Source: Authors' calculations.
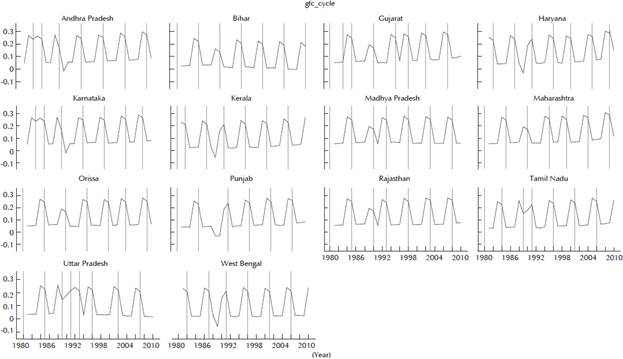
Figure 2 Opportunistic Transfers in the Electoral Term from 1980-81 to 2010-11
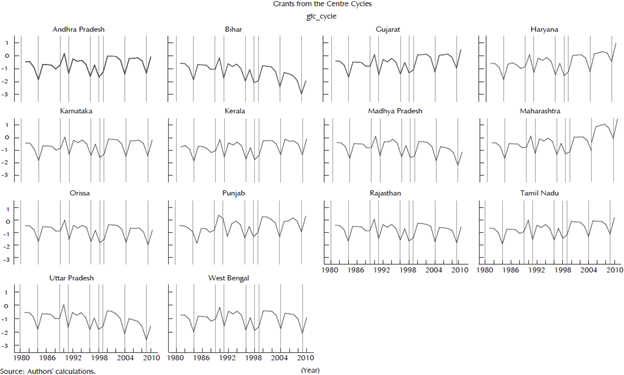
Figure 2 (2A, 2B) shows the transfers defined in terms of the level of opportunism for different years (namely, all years, year of election, year before the election, the year and the year prior to the election, the year after the election, and non-election years) in the electoral term of the parliamentary and assembly elections. Figure 2A depicts the opportunistic transfer of the centre to states with respect to parliamentary elections. In general, the deviations in the electoral term with respect to Gfc, Lfc and Td hover around zero for all the years. Notice that Gfc, in most cases, deviates negatively in election years, whereas Td deviates negatively in the years of and before the election in almost all cases. However, Gfc deviates positively in the year before the election, more so if the state-ruling party is same as the union government or the allied party (Figure B.1 in Appendix B also shows higher deviation in the year before the election, but plunges in the year of the election). In most cases, Lfc is positively deviated in the year of election or in the year before the election. (This is also confirmed by Figure B.2a resulting from the estimated equation, as shown in Appendix B). The Gfc and Td deviations are all positive after the election. (As shown in Appendix B, Figure B.2b does not have a clear pattern for Td). It appears that the opportunistic manipulations are higher in the case of Lfc. Opportunistic deviations have also been shown in the specific context where the state-level ruling party is an ally of the union government as well as when it is not. Some interesting points to note here are: in the aggregate, the allied state-ruling party gets a higher Gfc and Lfc in general, and particularly in the year before the election.
Figure B.2 shows the opportunistic centre-state transfer with respect to assembly elections. In general, the deviations during the electoral term with respect to Gfc are positive, and negative with Lfc, whereas these tend to hover around zero in the case of Td. It is interesting to note that Gfc is positively deviated in the year of the election, the year before the election, the years of and before the election (which is also confirmed by Figure B.3 in Appendix B), but not in case of Lfc (there is a slight jump in Lfc in the year of the election from the estimation results of Figure B.4a in Appendix B). Positive deviations are more likely with Lfc if the state-ruling parties are allied to the centre. Unlike the case of parliamentary elections, Td shows a positive deviation in the year of the election, the year before the election, the years of and before the election (the higher mid-electoral term and the year before election cycles are confirmed by Figure B.4b in Appendix B). The post-election period and the none-election years mostly show positive deviations in Lfc, whereas this is not the case for Gfc and Td.
In general, fiscal variables in a federal context are expected to follow an expansionary trend before the election. Figure 2 (2A, 2B) provides an indication of the presence of an opportunistic behaviour of the ruling party in both Gfc and Lfc in the case of parliamentary elections, and only in Lfc in the case of assembly elections, particularly for allied parties at the state level. In fact, a state which is both aligned and swing in the last state election is estimated to receive 16% higher transfers than a state which is non-allied and non-swing (Arulampalam, Dasgupta, Dhillon, and Dutta, 2009). The Td mostly displays a negative deviation before and during the election and has a positive deviation after the parliamentary election, but behaves oppositely in the case of assembly elections.
One of the primary motivations of this research is the announcement of transfer packages by the centre to the states observed prior to the elections. What happens to the announcements and when do they actually get transferred to the states in the electoral term is a subject matter of empirical investigation, which we take up in this paper. Furthermore, so far, a bulk of the research in this area has focused on advanced economies, and not on developing or emerging countries. Particularly, the lack of analysis at the sub-national level remains an obvious lacuna. More specifically, the analysis of PBC has been largely attempted for advanced countries, and more so focused on various fiscal heads for financing the expenditure and collecting revenue through taxes. However, hardly any work analyses centre-to-state (federal) transfers, especially for developing economies like India. In this respect, this research fills an important gap in the literature.
This paper focuses on centre-to-state transfer variables with other additional variables, namely, gross state domestic product, inflation, the parties' years of experience as incumbents, etc., used as control variables.
The analysis is also extended to look at whether the expansion of transfers in the year prior to the election is higher or lower if the ruling party in the state is an ally of the union government. More specifically, this paper attempts to analyse whether, in the federal structure, transfers under various heads of the states (for example, Gfc, Lfc, and Td) have been operated opportunistically by the central government. Dasgupta, Dhillon, and Dutta (2004) and Arulampalam, Dasgupta, Dhillon, and Dutta, (2009) look at the distributive model, where they analyse that the states which are both aligned and swing in the last elections are estimated to get higher discretionary transfers, whereas this paper differs by specifically looking at the transfers Gfc, Lfc, and Td from the centre to the states close to the elections. Also, whether the opportunistically created transfer cycles impact the electoral outcome at the centre and state levels. In order to find answers to these questions we look at whether there are specific effects associated with the election years on these transfers. Also, we analyse whether the opportunistic behaviour of the incumbent enhances their chances of re-election.
3. Data and Variables
This paper utilizes a balanced panel of 14 Indian states for 1980-81 to 2010-11, excluding the newly created states such as Jharkhand, Chhattisgarh, Uttarakhand, and Telangana as well as some additional states where regular elections did not take place, namely, Goa, and Jammu and Kashmir.9 The newly born states such as Jharkhand, Chhatishgarh, Uttarakhand, and Telangana are excluded from the sample because of the small number of data points, whereas Goa, and Jammu and Kashmir are excluded because of the infrequent elections. Also, all North-Eastern states have been dropped from the sample as they are special-category states. Being 'special category' implies that they receive grants / transfers on a special basis from the central government, which is very generous in nature (Rao and Singh, 2003; Arulampalam, Dasgupta, Dhillon, and Dutta, 2009).10 Consequently, their inclusion would not reveal the correct picture in terms of electoral politics. This paper attempts to test the following hypotheses: whether the transfers from the union to the states are politically motivated, and whether the political motivation of transfers can help the governments win the national and state-level elections.
The variables that have been considered for the analyses are11:
Gfc: Grants are provided to the states for state and centrally planned and sponsored schemes.
Lfc: Loans are capital receipts of the states, either borrowed from the market or from the government. In this case, the study focuses on the study on loans from the centre.
Td: This is a state's share in central taxes. Normally, states have to receive an amount equal to their share in the total central taxes in terms of tax devolution.
All the transfer variables (Gfc, Lfc, and Td) have been expressed as the percentage of total expenditure at state level. Along with transfer variables, the additional control variables considered are12:
Yr_bf_Elect: The year before the election Yr_bf_ Elect=1, 0 otherwise. The government in power might be interested in transferring more in the year prior to the election.
YrElect: The year of election Yr_Elect=1, 0 otherwise. The government in power might be interested in transferring more during the year of the election.
Density: This is a population density. A more densely populated state requires more transfers on account of a higher need for public investment (Arulampalam, Dasgupta, Dhillon, and Dutta, 2009), and can help win the election.
Dpci: This is a difference between the country's and the states' per capita income. The union government will transfer higher resources to a state if the state has a lower per capita income as compared to the national average.
Inf i: The union level inflation is harmful for the government in power from the election point of view. This is expressed as a percentage.
Inf_s: The state level inflation is harmful for the government in power from the election point of view. This is expressed as a percentage.
Turn: This is the percentage of voters' turnout. Hansford and Gomez (2010) find that a high turnout produces a less predictable electoral outcome, whereas Grofman, Owen, and Collet (1999) find that a higher voter turnout rate could be bad news for the government. Hence, the effect of turnout on the probability of winning could be either way. This is expressed as the percentage of votes casted out of the total eligible voters.
Nypp: Number of years that the party was in power counted as years of experience. The greater the experience of the party in power, the higher the transfers will be, hence the higher probability of winning. This is measured in the numbers of years that a party was in power.
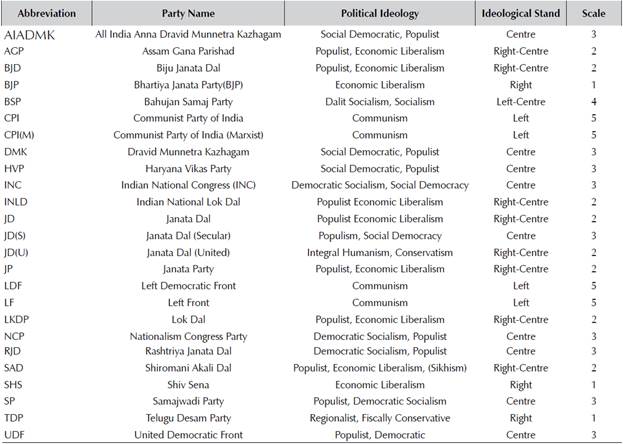
Pidum: This is political ideology. Veiga and Veiga (2007) and Aidt, Veiga, and Veiga (2011) find that right-wing Portuguese mayors are less opportunist than the left-wing ones. Similar results have been found by Mourao and Veiga (2010). Van der Brug, Van der Eijk, and Franklin (2007) argued that, being more opportunist, a left-wing government aims more at reducing unemployment, while a right-wing government, being less opportunist, worries more about inflation. Thus, an ideologically leaning government (both to the left or to the right) might be associated with opportunistic transfers that may help win the election. For parliamentary elections, Pidum=1 if right wing, 0 otherwise. In case of assembly elections, Pidum has been ranked from '1' to '5', representing the extreme right-wing and the extreme left-wing, respectively.
Allied: Allied=1, if the party in power in a state and in the centre are the same or if the state ruling party is allied, 0 otherwise. In this case, the states can garner more resources from the centre (Arulampalam, Dasgupta, Dhillon, and Dutta, 2009; Brollo and Nannicini, 2012), and can help win the election.
Cl_dum: Cl_dum=1, if the ruling party is a coalition, 0 otherwise. A coalition government is considered to be weak because of its excessive dependence on state / regional parties, hence, the transfers in general might be less and therefore the probability of winning is less.
Claldum: Clal_dum=1, if the central government is a coalition and the state ruling party is part of the alliance, 0 otherwise. In this case, there is a possibility of a constant flow of transfers by the central government to the allied states so that the coalition will continue to sustain the government.
The transfer variables have been normalized as a percentage by dividing by the state level aggregate expenditure. The detailed definition of the variables and data sources have been provided in Appendix A. As has been explained in the literature review, there have been few attempts to study the behaviour of federal transfers where the authors have argued that one cannot deny the possibility of political motivation behind the transfers from the centre to the states. Table 1 presents the basic descriptive statistics for all the transfer variables defined in levels as well as in terms of opportunistic deviation / manipulation. It also presents the basic statistics for the additional variables, namely, Allied, Cldum, and Clal_dum, Pidum, Nypp, NGDP growth rates, Inflation (Inf i for the inflation rate for all India and Inf_s for state-level inflation) and Density. The full sample respective means of the Gfc, Lfc, and Tdare: 9.79, 10.10, and 16.14. The average values for Lfc show higher levels the year before and the year of the parliamentary election, whereas Gfc and Td are higher the year before the parliamentary election and all Gfc, Lfc, and Td are higher the year prior to the assembly elections. In terms of opportunistic manipulations, Gfc and Lfc are positively deviated the year before, but not in the year of parliamentary elections. However, notice that Gfc and Td are positively deviated in both the year before and the year of the assembly elections. The possible reason for higher Td in the year before the election can be the coincident execution of the constitutional provision.
Table 1 Basic Statistical Information (1980-81 to 2010-11)
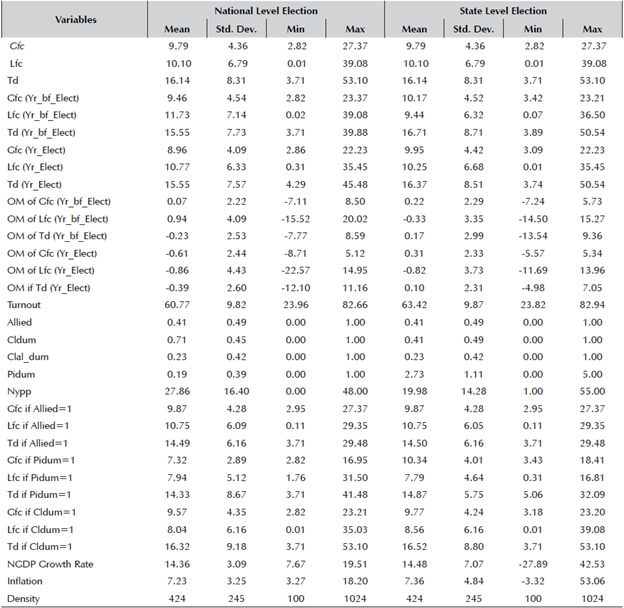
Note: Pidum for the national election is binary (=1 if right, 0 otherwise) and ranking for the state election (1 to 5 correspondingly ranked from extreme right to extreme left). OM is Opportunistic Manipulations.
Source: Authors' calculations.
Furthermore, for the period between 1980-81 to 2010-11, around 41% of the time the centre and the states have the same government, or the state government is an ally, whereas, respectively, around 71% and 41% of the time the union and the states are ruled by the coalition government. In the post-1980 period, India has been governed mostly by a coalition government, which has frequently been left-of-the-centre. That is, the central government has been ruled by the centre-left 80% of the time, and the remaining 20% by the right-wing. Similarly, at the state level, governments are mostly ruled by centrist parties. Observably, in general, the right-wing government tends to provide less transfers in terms of Gfc and Lfc as compared to the centre-left one for the union government, whereas, at the state level, the former has the higher Gfc. Also, notice that the state level nominal GDP growth and inflation rates are slightly higher than at the national level.
The hypotheses that have been designed are indistinctive for both the parliamentary and assembly elections, because the former has been analysed on the basis of a state-level data set itself. The basic hypotheses that have been designed are:
Gfc are higher in the year of the election and in the year prior to the election.
Lfc are higher in the year of election and in the year before the election.
Td, being formulaic, may or may not depict a conventional transfer cycle as in the case of Gfc or Lfc.13
The empirical strategy for the preceding hypotheses has been designed in Section 4. After observing the political motivation of transfers for both the union and the state level elections, this paper proceeds to find out whether these politically-motivated transfers help the government win the elections (Section 5). The basic hypotheses for this part of the research are:
Gfc in general and year, and year before the election can particularly help the government win the elections.
Lfc in general, and year, and year before the election in particular, can help the government win the elections.
Besides transfer variables, the additional political-economic factors that can help the government win the elections are: Allied, Nypp. A higher Turnout and an ideologically leaning government (left or right) could affect the election outcome either way and, finally, the coalition government lowers its probability of winning. The empirical strategy for testing these hypotheses is laid out in Section 5.
4. Tracing the Political Transfer Cycles
The testing of the PTC model utilizes the Pesaran, Shin, and Smith (1999) pooled mean group (PMG) panel data estimation method. This is one of alternatives for the Generalized Method of Moments (GMM), for which the justification is discussed later in this section.
4.1 Estimation Method
The Ordinary Least Square (OLS) panel data estimation method ignores individual heterogeneity by keeping the intercept and slope coefficient unchanged for cross-sectional units (states) in a random-effects model. On the other hand, a fixed-effects model assumes constant slopes and variance, given that the intercept terms are variant across cross-sectional units. Also, there is a higher loss of degrees of freedom under a fixed-effects model while controlling for state and time effects through a dummy variable (Baltagi, 2008). Under the two-way fixed-effects model, the estimated parameters will be biased if the right hand variables are correlated with the error terms (Campos and Kinoshita, 2008). In contrast, the random effects model assumes that the error term is not correlated with the right-hand independent variables (Arellano, 2003). However, this might not be true in practice. Normally, an OLS panel data model assumes common coefficients of the lagged dependent variable (Holly and Raissi, 2009). Also, it does not explain the short and long-term relationship considering the cross section and the time dimension of the panel data (Loayza and Ranciere, 2006). Thus, a static panel model of random and fixed effects is not suitable for the data.
According to Roodman (2006, 2009), the GMM difference estimators put forth by Arellano and Bond (1991) and the system GMM proposed by Arellano and Bover (1995) and Blundell and Bond (1998) fit the model well if the number of cross-sectional units (N ) is larger than the time index (T). In contrast, if T is larger than N, GMM estimators might produce spurious results, either because of the possible error due to the inclusion of lags as the instruments, which might be invalid instruments or because of their relationship with the error term. In addition, controlling for the state and time-fixed effects creates a large number of instruments where the Sargan test over-rejects the null hypothesis of exogeneity of instruments. The GMM also ignores the longrun relationship of the variables and their stationarity. Also, it is difficult to decide whether the estimated panel data models represent a structural long-run equilibrium or a spurious one. Kiviet (1995) argues that, in GMM estimation, assuming a common slope coefficient for the lagged dependent variable could lead to further bias. Hence, the GMM might not be a reliable method in this case.
Based on the estimation concept by Klomp and De Haan (2013a, b), this paper tries to capture the political transfer cycle by using the method suggested by Pesaran, Shin, and Smith (1999), Loayza and Ranciere (2006), and Samargandi, Fidrmuc, and Ghosh (2015). Pesaran, Shin, and Smith (1999) provide the short and long-term relationships between variables using a dynamic heterogeneous panel data error-correction estimation utilizing an auto-regressive distributed lag (ARDL) model, where p is the lag of the dependent variable and q is the lag of the independent variables. In order to maintain enough degrees of freedom with the given 14 cross-sections for 31 years' data, we take p = 1 and q = 1. Following Loayza and Ranciere (2006), the structure of the equation is postulated as:
where,
 and
and
 is the lag of the error term
 The
The
 and
and
 are the error terms of eqs. (1) and (2), respectively. The
 is the transfer variable for the i
th state at time t, and it could be any of the following variables: Gfc, Lfc, or Td. The variables
is the transfer variable for the i
th state at time t, and it could be any of the following variables: Gfc, Lfc, or Td. The variables
 where j = 1, 2,...,p-1, are the first differences of the lagged dependent variables. The X
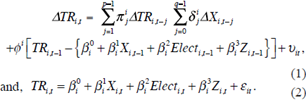
it is the set of following variables - the density of population (Density), number of years that a party is in power (Nypp), the difference between per capita income of the country and the states (Dpci). Elect is a set of election-year variables, which consist of two dummy variables: year before the election (Yr_bf_ Elect) and year of the election (YrElect). Furthermore, Z is another set of dummy variables that includes Pidum, Pidum*Yr_bf_Elect, Pidum*Yr_Elect, Allied, Cldum, and Clal dum. As for political ideology, Pidum=1 if the ruling party is right-wing and 0 otherwise for the national elections. In the case of assembly elections, the political ideology has been ranked from '1' to '5,' where, '1' represents the extreme right and '5' is the extreme-left party's ideology (refer to Table A.1 in Appendix A for a detailed classification of the ideologies).14 In the binary case, Allied=1, if the governing party in the state is the same in the centre or if the state-ruling party is allied to the centre, and 0 otherwise. The binary coalition, Cldum, equals 1 if the centre is a coalition government, and 0 otherwise (a similar definition but with a separate dummy has been used for coalition governments at the state level). If the coalition government at the centre and the state-ruling party are allies, then it is expressed as Clal_dum=1, and 0 otherwise. The β 's are the long-run coefficients, and φ is the speed of adjustment (error-correction coefficient) to the long-run equilibrium. The subscripts i and t denote state and time indices, respectively. The square bracket term in the right hand side of eq. (1) yields the long-run transfers regression equation derived from eq. (2).
where j = 1, 2,...,p-1, are the first differences of the lagged dependent variables. The X
it is the set of following variables - the density of population (Density), number of years that a party is in power (Nypp), the difference between per capita income of the country and the states (Dpci). Elect is a set of election-year variables, which consist of two dummy variables: year before the election (Yr_bf_ Elect) and year of the election (YrElect). Furthermore, Z is another set of dummy variables that includes Pidum, Pidum*Yr_bf_Elect, Pidum*Yr_Elect, Allied, Cldum, and Clal dum. As for political ideology, Pidum=1 if the ruling party is right-wing and 0 otherwise for the national elections. In the case of assembly elections, the political ideology has been ranked from '1' to '5,' where, '1' represents the extreme right and '5' is the extreme-left party's ideology (refer to Table A.1 in Appendix A for a detailed classification of the ideologies).14 In the binary case, Allied=1, if the governing party in the state is the same in the centre or if the state-ruling party is allied to the centre, and 0 otherwise. The binary coalition, Cldum, equals 1 if the centre is a coalition government, and 0 otherwise (a similar definition but with a separate dummy has been used for coalition governments at the state level). If the coalition government at the centre and the state-ruling party are allies, then it is expressed as Clal_dum=1, and 0 otherwise. The β 's are the long-run coefficients, and φ is the speed of adjustment (error-correction coefficient) to the long-run equilibrium. The subscripts i and t denote state and time indices, respectively. The square bracket term in the right hand side of eq. (1) yields the long-run transfers regression equation derived from eq. (2).
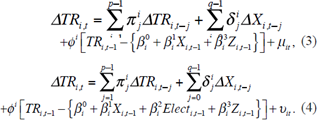
In accordance with eq. (1), the two equations that have been estimated to capture the transfer cycles are as follows:
The errors are respectively captured by μ
it
and
 in eqs. (3) and (4). Notably, PTC has been captured by the difference between the estimated error-correction values (which we get for all the states and years) of eq. (3) without the election dummy variables (pertaining to both the year before the election and the year of the election), and the error-correction values of eq. (4) when the election dummy variables are included in it. That is, we trace PTC as

Since, the election variables are not included in eq. (3), the error-correction values will be higher compared to the values in eq. (4) when the election variables are included, and, correspondingly, the gap will capture the cycles. These equations have been estimated for both the parliamentary and assembly elections. The patterns of state-wise transfer cycles are shown in the diagrams included in Appendix B.
For the variables contained in X it , the corresponding expected signs for Density and Nypp are positive, because more densely populated states require more transfers on account of a higher need for public investment (Arulampalam, Dasgupta, Dhillon, and Dutta, 2009), and, the more experienced is the party in power, the higher is the transfer. The gap between the per capita income of the union and the states (Dpci) is one of the criteria for centre-to-state transfers. The principle is that the union government will transfer higher resources to a state if the state has lower per capita income as compared to the national average. Hence, the expected sign for Dpci is negative. That is, the lower the per capita income of the state compared with the national average, the larger the transfer will be.
Elect is a set of variables around the election year consisting of two dummy variables: year before the election (Yr_bf_Elect) and year of the election (Yr Elect). The variable is defined in a binary form as Yr_bf_Elect=1 if it is the year before the election, and 0 otherwise. Similarly, Yr_Elect=1 if it is the year of the election, and 0 otherwise. The corresponding signs expected for both the coefficients of Yr_bf_Elect and Yr_ Elect are positive. This implies that in the year prior to the election higher transfers to the states are expected so that the state-level (both the parliamentary and assembly) election results could be influenced opportunistically. A similar postulation is done for Yr_Elect.
Furthermore, for the variables contained in component Z it , the explanation for the corresponding expected signs are follows. Veiga and Veiga (2007), and Aidt, Veiga, and Veiga (2011) find that right-wing Portuguese mayors are less opportunist than the left-wing ones. Similar results have been found by Mourao and Veiga (2010) for a panel of 68 countries for 40 years. Van der Brug, Van der Eijk, and Franklin (2007) argued that, being more opportunist, a left-wing government aims more at reducing unemployment, while a right-wing government, being less opportunist, worries more about inflation. In our case, we do not start with a prior for Pidum and hence there are no priors for Pidum*Yr_bf_Elect and Pidum*Yr_Elect as well. If the centre and the states are ruled by the same party or are allied with each other, states can garner more resources from the centre, therefore the expected sign for the coefficient of Allied is positive (Arulampalam, Dasgupta, Dhillon, and Dutta, 2009; Brollo and Nannicini, 2012). A coalition government is considered to be weak because of its excessive dependence on state / regional parties; hence, in general, the transfers will be less (Table 1 shows relatively lower transfers of Gfc and Lfc at national as well as at state level), and Cldum is expected to have a negative sign, but Clal_dum (coalition partner) is expected to have a positive sign, as the aligned parties have to be constantly satisfied by the central coalition government to avoid the fall of the government.
In general, equation (1) can be estimated by three different methods: (i) the mean group (MG) model by Pesaran and Smith (1995); (ii) the pooled mean group (PMG) estimators developed by Pesaran, Shin, and Smith (1999); and (iii) the dynamic fixed effect (DFE). Pesaran and Smith (1995), Pesaran (1997), and Pesaran and Shin (1998) propose the ARDL model, including the error-correction term in a co-integration model. Unlike the cointegration models by Johansen (1995) and Phillips and Hansen (1990), which requires the same order of integration for the estimation and interpretation of the long run relationship, the ARDL model by Pesaran and Shin (1998) confirms that it can be used irrespective of the variables being I(0) or or any combination of the two. Thus, in our model, we are not estimating the unit root test of the variables. This model simultaneously provides consistent and efficient short and long-term relationships among the variables. However, even if the estimators are consistent and efficient, we cannot ignore the endogeneity bias because of the presence of lag-dependent variables in the right hand side.
In our case, the PMG model seems to be more appropriate for the following reasons: (i) it overcomes the problem of endogeneity bias, which is due to the presence of lag dependent variables; (ii) it gives both short and long-run coefficients simultaneously, which makes the analysis more comprehensive, also providing the speed of adjustment to the long-run equilibrium; (iii) the variance of the error term is different for the states, but the longrun slope coefficients are common across states. In other words, it postulates that the short-run characteristics can be different across states, but that they are not different in the long run. Some basic requirements for estimation validity of the PMG model are as follows: (i) for a consistent, efficient, and stable PMG model in the long run, the sign of the coefficient of error correction term should be negative and not less than '-2'. (ii) The error term of the ARDL model should be uncorrelated with the explanatory variables (clear exogeneity), and (iii) the number of the cross sectional units should be large enough, or such that N < T. In the absence of these conditions, the PMG model will not provide efficient results (Samargandi, Fidrmuc, and Ghosh, 2015). Our model satisfies all these conditions.
Pesaran and Smith (1995) propose Mean Group (MG) estimators which yield heterogeneous long and short-run coefficients for each cross-sectional unit as the unweighted means of the estimated coefficients. One of the very important requirements for the MG model is that the number of cross sectional units should be large enough (or at least 20-30). In our case, we are taking only 14 states and find that this model is unsuitable.
The DFE model is similar to the PMG estimators in that it is based on constant slope coefficients and homoscedastic error variances across states in the long run. It differs from PMG because it puts further restrictions of cohesion of the short run coefficients and speed of adjustment. The DFE model also has the endogeneity bias due to the presence of lagged dependent variables. Hence, we proceed with the use of a PMG model and not MG or DFE models for our analysis.
4.2 Results Pertaining to Parliamentary Elections
Tables 2 and 3 show the regression results for parliamentary and assembly elections, respectively. An opportunist incumbent is expected to expand the transfer before the election and induce a downturn in it in the postelection period. A higher opportunistic manipulation is possible in the cases of Gfc and Lfc, as there is a greater scope for the role of the Planning Commission (now NITI Aayog) and the ministries of the Union. This paper deals first with the parliamentary election followed by the assembly elections.
Table 2 Dependent Variables are Gfc, Lfc, and Td (Parliamentary Elections)
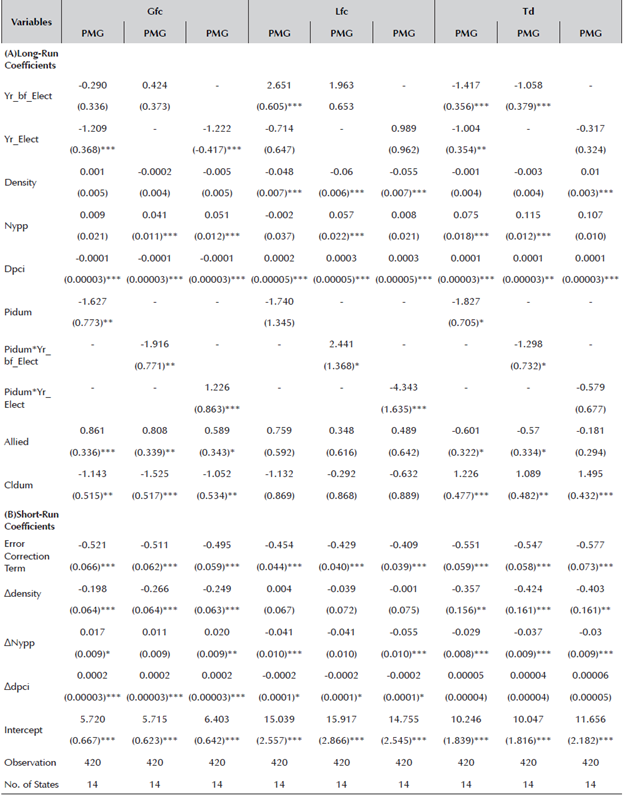
***, **, * Significant at 1.0%, 5.0%, and 10% respectively (standard errors in parentheses).
Source: Authors' calculations.
Table 3 Dependent Variables Gfc, Lfc and, Td (Assembly Elections)
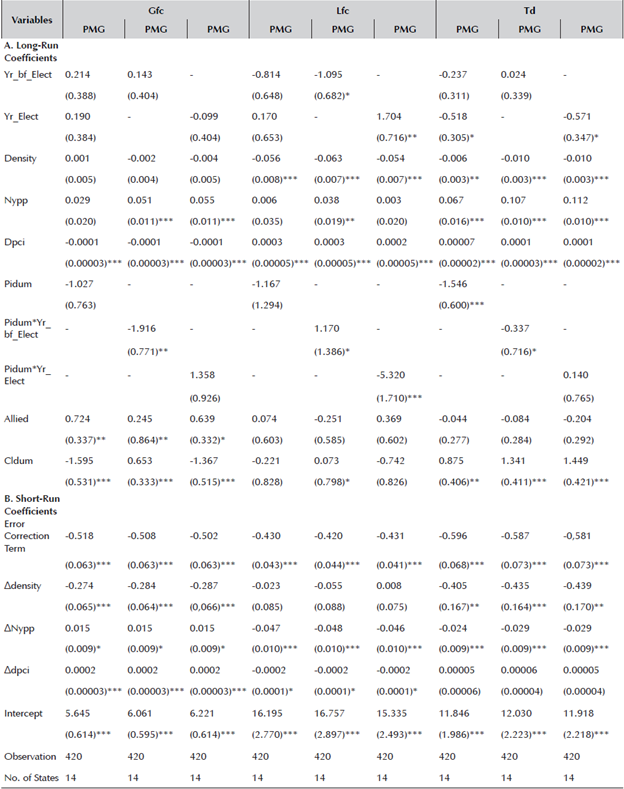
***, **, * Significant at 1.0%, 5.0%, and 10% respectively (standard errors in parentheses).
Source: Authors' calculations.
4.2.1 Baseline Results
The Gfc in the case of parliamentary elections in the year before the elections is not found to be important because this is opposite in sign and not significant; however, if the year of the elections is controlled, then it yields a positive coefficient for the year before the election, but, again, it is not significant. Lfc displays a positive and significant result in the year before the election (also supported by Klomp and De Haan, 2013b; Chortareas, Logothetis, and Papandreou, 2016; and Aidt, Veiga, and Veiga, 2011), having 2.0% higher transfers (Table 1 shows 1.63% higher transfers), but not in the year of the election. The hypothesis related to Td states that it does not show any clear pattern of cycles. This is based on the belief that Td is decided by the FC, which is constitutionally an independent body, and hence, political opportunism is less pronounced in this case. In fact, Td is 0.23% lower in the year before the election, and 0.51% -0.57% lower in the year of the election (Table 1 shows 1% to 1.41% lower). Thus, no clear cycle has been observed in Td from descriptive statistics and regression estimation. In the year of the election, Lfc is positive and insignificant, but Gfc and Td are negative and significant. Interestingly, since a loan entails a liability to be repaid back to the centre, the central government seems to woo the state government, as well as the voters, prior to the election, by providing more loans to the state and thus also transferring the burden, which is not immediately noticed by the voters. Thus, for parliamentary elections, there exists a strong PTC in Lfc in the year before the election, whereas in the year of election Lfc is positive, but not significant.
4.2.2 Political Ideology, Experience, and Form of the Government
This section analyses the behaviour of the three transfers (Gfc, Lfc, and Td) regarding the following variables: Density, Nypp, and Dpci contained in X it . The additional control variable, Z it , consists of dummy variables: Pidum and its interactions with the year before the election and the year of the election, Allied and Cldum. Contrary to our expectations, the coefficient of Density is negative and significant across the transfer variables, both for the short and long runs. In fact, a higher population share in the aggregate is one of the criteria for higher grants and devolution to the states (60% weight is given to the population of the states according to the Gadgil-Mukherjee Formula, 1991).15 However, states with a higher population share do not always have a high population density. High-density states are already advanced in terms of infrastructure and employment opportunities, and have higher levels of urbanization and industrialization; hence, the transfers operated are lower and significant. Furthermore, a more experienced government (higher Nypp) is expected to provide higher transfers from the centre, and this is found to be true in all cases of Gfc, Lfc, and Td in the long run, but not necessarily true in the short run, as it is positive and significant only in the case of Gfc and not Lfc and Td. In case of the Dpci variable, the higher the shortfall in the states' per capita income below the national average, the larger are the transfers received in terms of Gfc, but not in terms of Lfc, in the long run. However, in the short run, this gets reversed. That is, a shortfall in a state's per capita income below the national average entails a lower Gfc, but a higher Lfc. The short and long-run effects of Dpci are always positive, but not significant in the case of Td.
The component Z it consists of Pidum and its interaction with the year before the election and the year of the election Allied, Cldum and Clal_dum. The Clal_dum has been dropped from the regression results because of the multi-collinearity problem. The right-wing (Pidum=1) government exhibits the tendency to transfer less to the states in terms of Gfc, Lfc, and Td. The right-wing government (Pidum=1) significantly transfers less Gfc and Td. Also, the right-wing government provides more Lfc in the year before the parliamentary elections, but less Gfc and Td; however, the opposite happens in the year of parliamentary elections. Furthermore, the states run by the same party as the centre or the allied parties (Allied) in the states, tend to receive more grants and loans, and this is true and significant in the case of Gfc and Lfc (also refer to Table 1). This is confirmed from the results in Dasgupta, Dhillon, and Dutta (2004) and Arulampalam, Dasgupta, Dhillon, and Dutta (2009) as well.
Preferably, incumbents should find new allies in those states where the probability of winning is lower and transfer more resources so that the probability of winning can be improved. This is not the case here, and this may be probably due to varied ideological leanings and local interests of the regional parties. The coalition (Cldum=1) government operates lower transfers in terms of Gfc and Lfc, but a higher Td. Also, if the state-ruling party is a coalition ally of the union government, then the allies have to be happier with the regular flow of resources for the smooth functioning of the union government. If the interest of these regional players is not taken care of, there is the fear of withdrawal of support from the government by the allied parties, which poses a political constraint.
4.3 Results Pertaining to Assembly Elections
4.3.1 Baseline Results
The results are slightly different in the case of assembly elections (Table 3). That is, Gfc is positive but insignificant in both the year before the election and the year of the election. Lfc is negative in the year before the election, but positive and significant in the year of election. Td is mostly negative in the election years and shows a 0.51% - 0.57% lower devolution in the year of election (however, Table 1 shows a 0.23% higher devolution). Hence, Td does not show a clear pattern of cycles from estimation and descriptive statistics, as was also stated in the hypotheses. A PTC can be seen more clearly only in the case of Lfc in the year of the assembly election when transfers are 1.70% higher (though Table 1 shows they are only 0.15% higher). Clearly, it seems that the PTC is more pronounced in the case of parliamentary elections and not in assembly elections. Moreover, the results for the remaining variables such as political ideology, experience of the party in power, and form of the government, provide similar conclusions for both parliamentary and assembly elections. This has been presented in Tables 2 and 3 and analysed in the following subsection.
4.3.2 Political Ideology, Experience, and Form of the Government
The results in this section are similar to those of parliamentary elections. That is, against expectations, the coefficient of Density is negative and significant across the transfer variables, both in the short and long runs. More experienced governments (higher Nypp) are expected to provide higher transfers from the centre, and this is found to be true for all Gfc, Lfc, and Td in the long run, but not necessarily true in the short run, as it is positive and significant only in the case of Gfc and not Lfc and Td. In case of Dpci, the higher the shortfall in the states' per capita income below the national average, the larger are the transfers received in terms of Gfc, but not in terms of Lfc, in the long run. However, this gets reversed in the short run. That is, a shortfall in a state's per capita income below the national average entails a lower Gfc, but a higher Lfc. The short and long run effects of Dpci are always positive, but not significant in the case of Td.
The variables contained in Z it consist of Pidum and its interaction with the year before the election and the year of the election, Allied, Cldum and Clal_dum. The Clal_dum has been dropped from the regression results because of the multi-collinearity problem. As with the parliamentary election, the right-wing (Pidum=1) government exhibits the tendency to transfer less to the states in terms of Gfc, Lfc, and Td in assembly elections as well. The right-wing government (Pidum=1) is significant only for Td in assembly election. Similarly, the right-wing government provides more Lfc in the year before the elections, but less Gfc and Td. That is, the right-wing is more opportunistic in terms of Lfc, but the centre-left displays higher opportunism in terms of Gfc and rule-based Td. However, the opposite happens with the year of the assembly election. As in the case of parliamentary elections, the states run by the same party as the centre or the allied parties in the states (Allied) tend to get more grants and loans in the case of assembly elections as well. This is true and significant in the case of Gfc and Lfc (also refer to Table 1). The coalition (Cldum=1) government at the state level receives lower transfers in terms of Gfc and Lfc, but higher Td, but when the variable for the year of the election is dropped, Gfc and Lfc show as positive and significant.16
4.4 Synthesis
As in the earlier literature on PBC regarding opportunistic budgetary expansion by Drazen and Eslava (2010); Aidt, Veiga, and Veiga (2011); Klomp and De Haan (2013b); and Chortareas, Logothetis, and Papandreou (2016), this paper confirms a higher Lfc in the year before the election (Table 2) and slightly lower but insignificant Gfc for parliamentary elections. Similarly, Table 3 shows that Lfc is higher in the year of election, and positive but insignificant in case of Gfc in assembly elections. The Td does not exhibit cycles for both the parliamentary and assembly elections. Since loans have to be repaid, it is easier for the union government to grant higher loans to the states before the election. Even when Gfc is operated as per the FC's recommendations, interestingly, some components of Gfc are determined by the Planning Commission as well as by the central ministries.
Thus, centre-state transfers display a PTC in the year before the parliamentary elections and in the year of the assembly elections in terms of Lfc. The Gfc experiences positive and weak cycles the year before the parliamentary elections, but both in year before and in the year of assembly elections. Neither case shows PTC in Td. The error correction terms are negative and significant in all cases and well under the threshold value of '-2,' implying stability of the model. This shows that ARDL equations are stable in the long run. Also, intercepts are positive and highly significant in all models for both parliamentary and assembly elections.
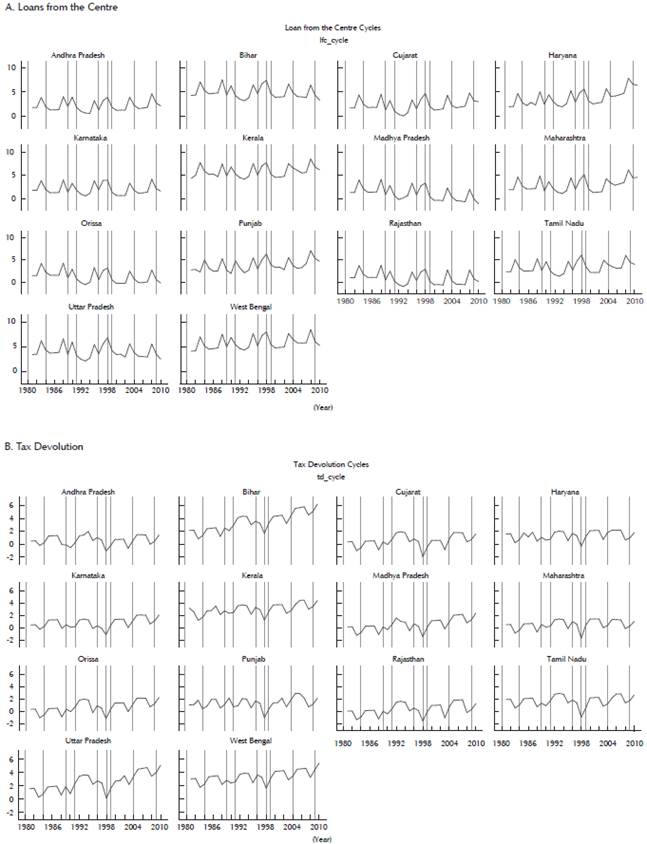
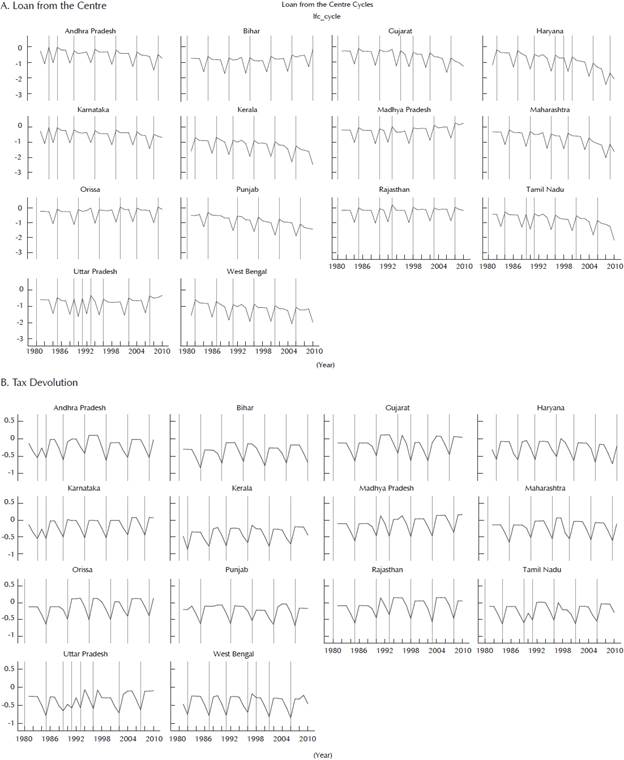
The resultant graphs of the transfer cycles are shown in Appendix B in Figures B.1 and B.2 (B.2a, B.2b) for parliamentary elections, and Figures B.3 and B.4 (B.4a, B.4b) for assembly elections. The pattern of Figures B1 and B.2 (B.2a, B.2b) shows dip in both Gfc and Lfc in the year of the parliamentary election; however, in the year before elections, it shows higher transfers. In fact, figures show relatively higher transfers in the middle of the electoral period than towards the end of the electoral term. In the case of assembly elections, Gfc appears as relatively higher the year before the election compared to transfers in the year of the election, whereas Lfc is higher in the year of the elections. However, Td does not show any clear pattern with respect to parliamentary elections, but it shows dip in the year of assembly elections. Effectively, figures do not display the exact patterns of what the empirical results suggest in the case of parliamentary elections, but somewhat similar in the case of assembly elections. From graphical representation it can be observed that there are cycles in the middle of the electoral term for both Gfc and Lfc in the case of parliamentary elections, but transfer cycles in Gfc in the year before the election and cycles in Lfc in the year of the election have been observed in the case of assembly elections. There is no clear cycle observed in the case of Td for parliamentary elections, but there are cycles in the middle of the electoral term of the assembly election.17
Once the transfer cycles have been traced, an immediate question arises: Do the opportunistic transfer cycles created by the government at the union and state levels help win the parliamentary and assembly elections? That is, since the pre-electoral cycles have been created in the case of Gfc and Lfc, the specific question is whether these pre-electoral opportunistic cycles help the incumbent win the election. The following section attempts to answer these questions.
5. Effect of Transfers on Electoral Outcome
To analyse the re-election prospects that could be ascribed to opportunistic manipulations of transfers by the central government, we examine the parliamentary election based on state level results first, and secondly the assembly elections. In both the cases, we rely on a statelevel analysis. The equation of electoral outcome has been estimated using the same data set as in the previous section for 14 major states covering the parliamentary as well as the assembly elections in India, spanning the period 198081 to 2010-11. The different transfer variants have been taken as independent variables, along with other binary and exogenous variables. The binary variable for victory has been defined state-wise in the following manner:
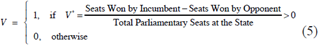
where, V is the limited dependent variable termed as victory, where, V = 1, if V * > 0 (retaining power), and 0 otherwise. That is, V takes the value of 1 if the ratio of the difference between the number of seats won by the incumbent and seats won by the opponent and the total number of parliamentary seats (assembly seats in the case of state level elections) in the state is greater than 0, and takes the value of 0 otherwise. If the variable V * is positive, then the results show the minimum threshold for the majority to form the government.18 For parliamentary elections, the incumbent is the central government, whereas the state government is considered as the incumbent for assembly elections.
5.1 Estimation Method
For estimation purposes, the fixed effects Logit model has been employed for the panel data set for the 14 states. The econometric equation for the fixed effect model can be specified as
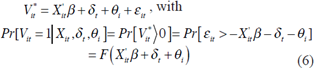
where, F is the standard logistics distribution function, V it is the binary outcome as the dependent variable (victory), which takes a value of 1 if the incumbent party has the state-level majority (re-elected), and 0 otherwise. Often, failing to capture the state and time fixed effects can cause a spurious causal relationship. That is, state-level unobserved characteristics such as caste, religion, gender, genetic inheritance, intelligence, etc., can affect the binary of victory and other independent variables. Accordingly, the correlation between the unobserved characteristics of the states and the explanatory variables is not zero. Thus, considering the importance of the time-invariant features of the states, the fixed effects models are more useful. However, for our purpose of investigating whether transfers help win the elections, we capture both the time and state-fixed effects. The estimable form of the Logit model is as follows:
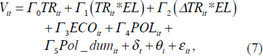
where, i = 1,2,3,...,14, indicates the index of states for variables (Gfc, Lfc, and Td) and t indicates the time series in years. The equation includes both the time (δ
t
) and state-fixed effects (θi), and the random variable is
 which is assumed as
 Our prime objective is to estimate the equation for electoral outcome V
it
.
Our prime objective is to estimate the equation for electoral outcome V
it
.
The vector of variables, TR it , has been used to denote Gfc, Lfc, and Td each as a separate equation, and their respective coefficients in the corresponding equations will be represented by Γ 0 and expected to be positive in each case. The vector TR it *EL refers to the interaction term of the transfer and the election variables (the year before the election and the year of the election). These interaction terms are expected to affect positively the wining probability of the government. Similarly, the vector ΔTR it *EL consists of the interaction terms of the transfer (in opportunistic manipulation form) and election variables (year before the election and year of the election). Opportunistic transfers are expected to yield a positive electoral outcome. Vector ECO it consists of Inflation (we use Inf i for national inflation level and Inf s for the state-level inflation rate) and Density, where their corresponding effect on electoral outcome is expected to be negative and dichotomous, respectively. Next, the vector POL it consists of voters' turnout in percentage (Turn), and the years of experience of the government (Nypp) in the office. Historically, a higher turnout has always been a questionable issue in terms of its effect on electoral outcome. Hansford and Gomez (2010) find that a high turnout produces less predictable electoral outcomes, whereas Grofman, Owen, and Collet (1999) find that a higher voter turnout rate could be bad news for the government. Hence, we do not have any prior knowledge on this. The probability of winning for the experienced party (Nypp) is higher. The vector of dummies is Poldum, which consists of political ideology (Pidum), state ruling party being the same as that at the centre, or an ally (Allied), coalition government (Cldum) at the centre for parliamentary election, and coalition government at the states for assembly elections, and if there are coalition governments at the centre, and the state-ruling party is its ally (Clal_dum). Again, in the three cases, we do not assume any prior knowledge. δ t , and θ i are the time and state-level fixed effects. Since there is presence of the state-invariant characteristics for parliamentary elections such as year of the election, inflation, etc., we use the time trend to capture the time-fixed effect, whereas the usual way is to capture the state-fixed effects. The time and state-fixed effects are captured normally in the case of assembly elections.
The Logit model has been estimated separately for both parliamentary and assembly elections. Appendix B from Table B.1 to B.6 reports the regression results of the Logit model. Columns I, II, III, IV, and V report the coefficients and standard errors in the parenthesis in the first sub-column, whereas the second sub-column reports the odd-ratios along with the average (semi-) elasticities of Pr [V = 1/ X,u ], where X is a vector of independent variables.19,20
5.2 Results Pertaining to Parliamentary Elections
Tables B.1, B.2, and B.3 report the regression results for parliamentary elections, whereas the results for assembly elections have been reported in Tables B.4, B.5, and B.6 in Appendix B. In each case, the dependent variable is a binary variable V, which takes the value of 1 if the government retains power, and 0 otherwise. The remaining variables have been used as independent variables. Both in parliamentary and assembly elections, the transfers variables used as independent variables are: Gfc, Lfc, and Td.
5.2.1 Baseline Results
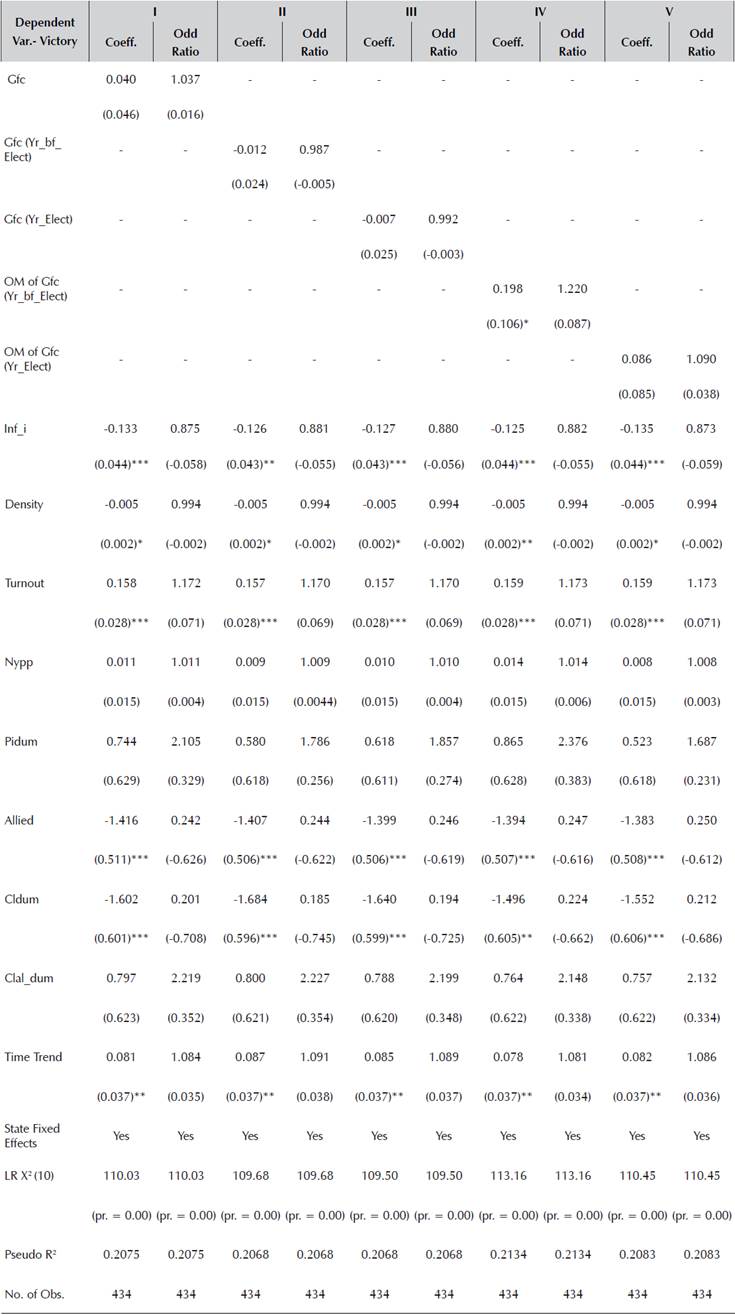
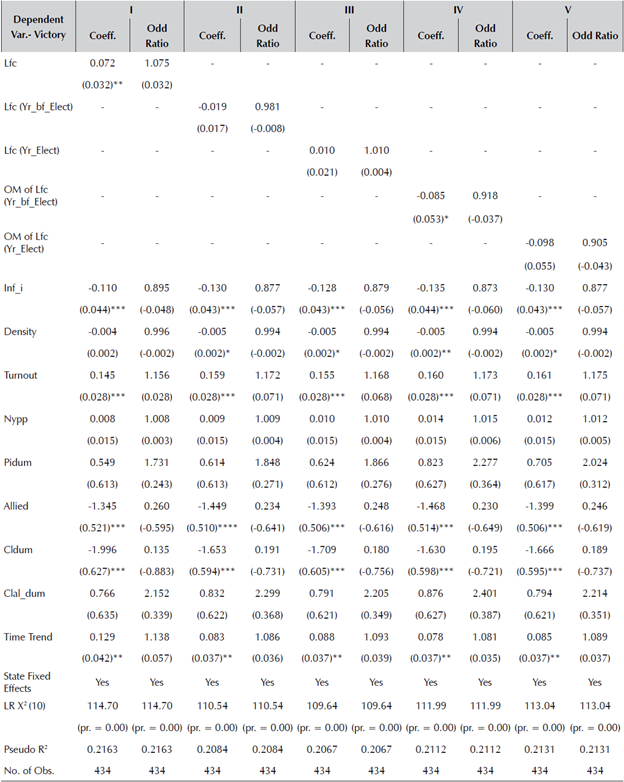
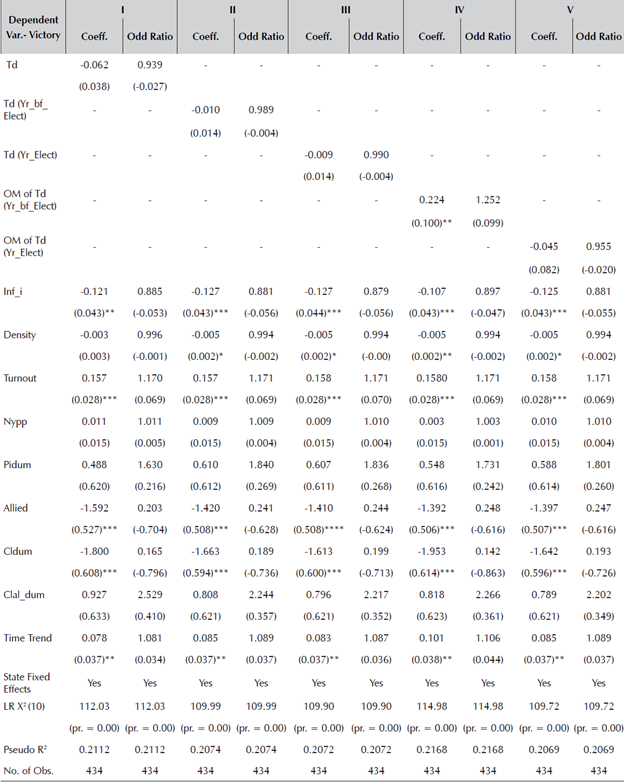
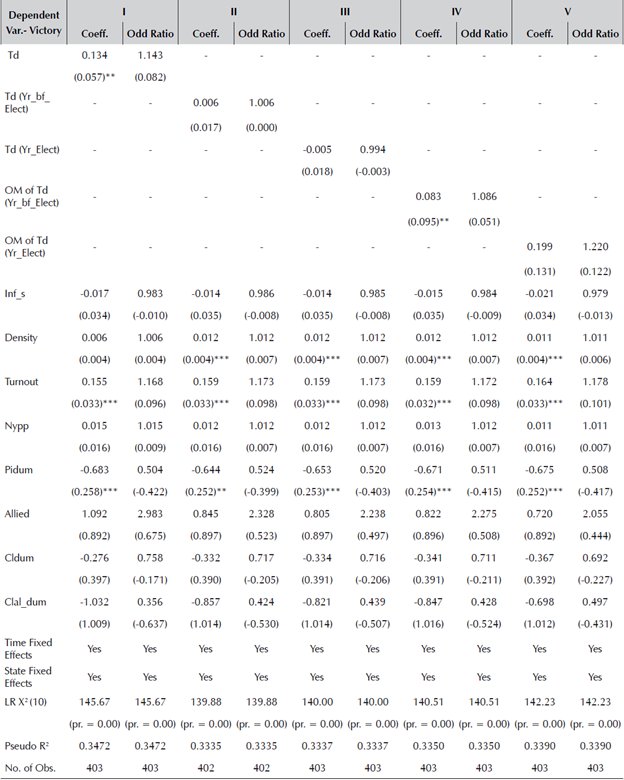
Gfc in levels that do not seem to be important to affect the probability of winning, although its coefficient is positive. It is Lfc in levels that significantly help win the election. That is, each additional unit of Lfc increases the odds of victory by 7.0% (0.072x1.075), with an average (semi-) 3.2% elasticity. Also, the interaction of Gfc and Lfc with the year before the election and the year of the election dummies do not significantly help win the election. However, the opportunistic manipulation of Gfc in the year before the election is found to be significantly helping in winning the election, increasing the odds of victory by 24% (0.198x1.220), whereas it is likely to help in winning, but not significantly, in the case of the year of the election.21 Similarly, opportunistic manipulations of Lfc do not really contribute positively to the possibility of winning. Td has a negative sign and is insignificant. Surprisingly, the manipulation of Td in the year before the election significantly helps the incumbent win the election increasing the odds of victory by 28%. However, this is denied by the proponents of the view that Td is not subject to political manipulations because it is based on formula-based sharing of tax revenue and has also been controlled by the FC as an independent, constitutional body (Rao and Singh, 2001; Mohan and Shyjan, 2009).
5.2.2 Economic, Ideological and other Factors Affecting Victory
This section analyses the behaviour and impact of the following variables on the incumbent's probability of winning: Density, Inf_i, Turn, Nypp, Pidum, Allied, Cldum, and Claldum. In general, the results show that each vector of variables such as ECO it , POL it and Pol _ dum it , have a similar impact on the possibility of winning the parliamentary elections across the models. The vector ECO it consists of Inf_i and Density. In India, a high inflation situation has never been favourable for an incumbent's possibilities to win. That is, the victory prospects are highly sensitive to inflation, Inf_i. For instance, inflation of basic food items such as increased onion prices indeed brought tears to the incumbent BJP in the assembly election in Delhi in 1998, when they lost the power to the Congress. For the same reason, Congress hardly managed to retain its power in the 2010 assembly election in Delhi. The reduction in the chances to win parliamentary election is around 12% (-0.133x0.875). Furthermore, a higher population Density is less likely to win the election by 0.49% (-0.005x0.994). This may be probably because a high-density population does not necessarily mean a higher voter turnout (Chandra and Potter, 2016; Kumar and Banerjee, 2017), and neither does high population density mean that they will vote only for the incumbent.
The vector POL it consists of Turn, Nypp. Generally, it is believed that a higher voter turnout works against the incumbent, but in our case it helps the possibility of the incumbent to win by 27% (0.158x1.72) with an average 7.0% (semi-) elasticity. A higher experienced government (Nypp) is more likely to win the election, although it is not significant. The last set ofvariables Pidum, Allied, and Clal_dum are contained in vector Pol_dum it . The coefficient of Pidum is positive for parliamentary elections, but not significant; hence, the right-wing does not necessarily have a higher probability of winning (Table 1 states that only 19% of the time the union has a right-wing party in power, which substantiates the results, as a matter of fact). Furthermore, if the state and the centre have the same government, or if the state government is an ally (Allied), then the prospects of winning the election are lower. Similarly, a coalition government Cldum is less likely to regain its power, and Clal dum is more likely to win the election although it is insignificant later.
5.3 Results Pertaining to Assembly Elections
5.3.1 Baseline Results
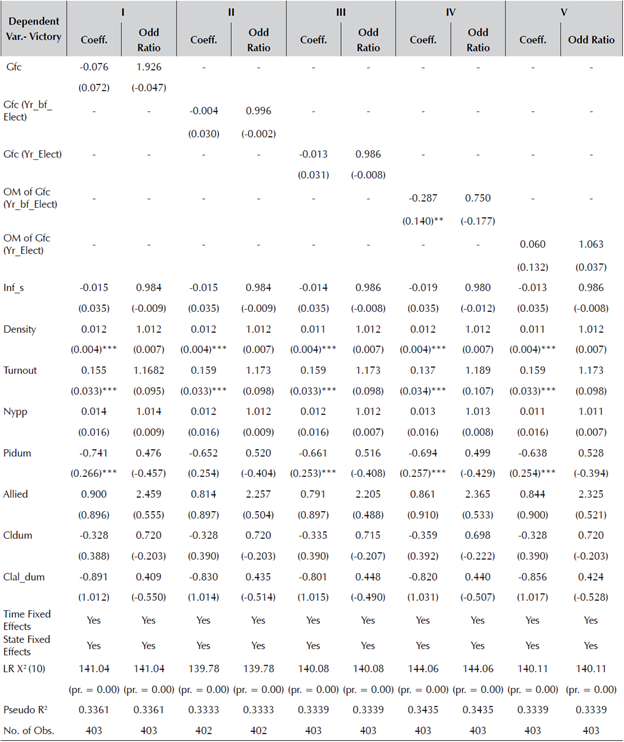
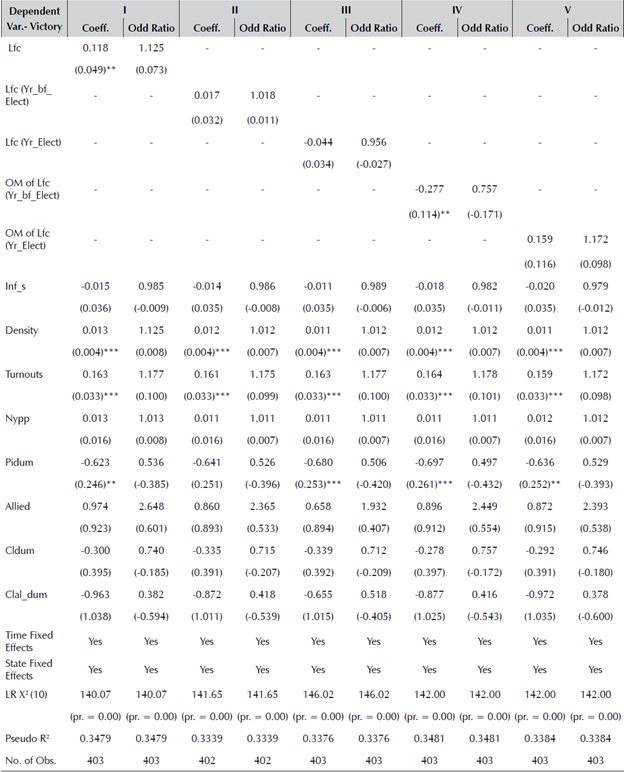
Observing the assembly elections, generally, Gfc does not help to win, but Lfc helps win the elections. Each additional unit of Lfc in level increases the odds of victory of assembly elections by 13% (0.118x1.125). The year before the elections, the year of the election, and opportunistic manipulation in the year before the election Gfc has a less likelihood, but a mostly insignificant possibility, of winning the election. Lfc in the year of election and opportunistic manipulation in the year before the election entail a lower and insignificant likelihood of a win. As in the case of parliamentary elections, Td significantly contributes to the probability of winning by 9.0% (0.083x1.086) if a higher devolution takes place in the year before the assembly election.
5.3.2 Economic, Ideological, and other Factors affecting Victory
As in the case of parliamentary elections, the results show that each vector of the variables such as ECO it , POL it , and Pol _ dum it , has a similar impact on the possibility of winning across the models in the case of assembly elections. The vector ECO it consists of Inf_s and Density. Inflation propels the probability of losing the election, although this is not significant except for parliamentary elections. A higher population Density is 1.21% (0.012x1.012), more likely to help win the assembly elections.
The vector POL it consists of Turn, Nypp. As in the case of parliamentary elections, a higher voter turnout increases the probability of victory by around 18% (0.155x1.17). Similar to parliamentary elections, a more experienced government (Nypp) is more likely to win the election, although insignificantly. The last set of variables, Pidum, Allied, and Clal dum, are contained in vector Pol _ dum it . In the case of assembly elections, political ideology (Pidum) has been ranked from 1 (right) to 5 (left). So if, the coefficient of Pidum is positive for parliamentary elections and negative for assembly elections (because a positive value will show a higher probability of winning for left parties), the result is coinciding and, correspondingly, it implies that a right-wing government has a higher probability of winning the elections. Results show that the probability of the right-wing incumbent to win the election is higher in case of assembly elections, unlike the insignificant Pidum in case of parliamentary elections. The probability of winning for the right-wing party is 35% (0.741x0.476) in the case of assembly elections (Table 1 shows that, most of the time states are ruled by centre-right and centrist parties with value 2.73. This also confirms the results).
If the state and the centre have the same government, or if the state government is an ally (Allied), then the prospects of winning the election are higher in the case of assembly elections, but not significantly. Similarly, Cldum and Clal dum are not really important for the probability of winning in the case of assembly elections.22
5.4 Synthesis
Evidently, the opportunistic manipulations of Gfc in the year before parliamentary elections can help win the national level election, whereas Lfc in levels can help regain power in both the parliamentary and the assembly elections (as was also confirmed by Aidt, Veiga, and Veiga, 2011; Drazen and Eslava, 2010; Chortareas, Logothetis, and Papandreou, 2016; etc.). Also, it appears that being an opportunist in terms of transfers is not enough, as it does not significantly help the incumbent win the election in most of the cases. That is, one cannot deny the role of other uncontrolled variables such as the role of the media, the actual implementation of the schemes for which the transfers are intended, the characteristics of the party and its members, etc. In fact, Dutta and Gupta (2014) and Gupta and Panagariya (2014) show that the candidates having longer years of education, are older and wealthier, and possess at least one serious pending criminal case against them can garner a higher share of votes.
As for additional control variables, the results of parliamentary elections and assembly elections are similar with some differences. For instance, the time trend has been used to capture the time-fixed effects in parliamentary elections because of the presence of stateinvariant characteristics of the variables in the date of the parliamentary election, inflation rate for all India, etc. However, state-fixed effects have been captured properly with state indexes. For the assembly election, both the time and the state-fixed effects have been used because the variables considered are state and time-variant. The additional dissimilarities are: Inflation is significantly harmful with respect to parliamentary elections, but not significant in case of assembly elections; Density and right-wing government Pidum are more likely to win the assembly election, but not the parliamentary election; similarly, Allied does not help to win parliamentary elections, although it is not really important in the case of assembly elections, although coefficients are positive.
6. Conclusion
The governance of sub-national transfers in different forms such as grants from the centre, loans from the centre, and tax devolution involve three important institutions in India, namely: the Planning Commission (now NITI Aayog), the FC, and the ministries of the ruling party.23 Generally, grants from the centre and tax devolution are under the purview of the FC. However, the Planning Commission (NITI Aayog) and the central government have played a more significant role in determining grants and loans from the centre.
The political transfer cycles in the loans from the centre can be traced in the year before parliamentary elections, but these occur in the year of the election for assembly elections, whereas the cycles for grants from the centre are found in the year before the assembly elections only. No clear cycles have been traced regarding tax devolution. These findings are similar to the literature on political budget cycles such as Aidt, Veiga, and Veiga (2011); Drazen and Eslava (2010); Klomp and De Haan (2013b); Chortareas, Logothetis, and Papandreou (2016), among others. A right-wing and coalition incumbent has the tendency to transfer less to the states. However, the former provides more grants to the states in the year of assembly elections. Additionally, if the same party rules at the state level, or if the state is an ally of the centre, the allied state receives more rewards from the centre in the form of grants and loans from the centre.
The paper analysed whether such politically motivated transfers actually impact the probability of winning the elections. Using the Logit estimation method, this paper finds that the opportunistic manipulations of the grants from the centre in the year before the parliamentary election can help the incumbent regain its power. Also, the loans from the centre in levels generally help to win both the parliamentary and assembly elections. The remaining economic and political variables and the political dummies are robust in terms of the key results across models. For instance, inflation is electorally very harmful for the union level government, but not necessarily for the government at state level. However, a higher voters' turnout is more likely to help win the election for the union and state governments, although the year of experience in running the government is not really important, electorally speaking. Similarly, a right-wing government is more likely to win the election, particularly the assembly election, and not really the parliamentary election. In general, the presence of a coalition government reduces the winning possibility in both the parliamentary and state elections.
The questions that emerge from this research and that can lead to further research are the following: how do these transfer cycles behave when the allied parties of the coalition government operate as a special interest group? How will the results be affected if the model is extended to include an industry special interest group, to which the union government provides regulatory benefit, and receives in return bribes to fund the election campaign expenditure? (For details, please refer to Manjhi and Mehra (2017b) for a theoretical analysis of this issue). The third extension of this paper could be an analysis of the effect of decentralization on economic growth. All these constitute scope for future work on this subject.