


 Inglês (pdf)
 Artigo em XML
 Referências do artigo
 Enviar este artigo por email
 Citado por SciELO
  Citado por Google
  Similares em
SciELO
Similares em
SciELO  Similares em Google
 Permalink
1. Introduction
People who work for governmental organizations are important in order to achieve the State’s goals, and their level of satisfaction affects these achievements. The modernization of management and professionalization of public administration and directive practices implies the need to know, maintain and increase job satisfaction of each one of their employees. As a result, systematic studies of job satisfaction become relevant for management.
This article focuses on identifying those attitudes of job satisfaction that bear a statistically significant influence on job satisfaction in the context of Chilean state organizations.
By using models of structural equations, the relationship between different dimensions that determine the job satisfaction of public employees may be studied.
The confirmatory factorial analysis is a technique based on models of structural equations whose purpose is determining whether a group of dimensions specified by the researcher or by a prior exploratory factorial analysis, fits reality (Lévy & Varela, 2006). Therefore, this study will allow to get to know those attitudes within the workplace that determine public worders' job satisfaction and to identify a measurement model that explains them.
1.1. Job satisfaction
Job satisfaction, understood as a factor that determines the degree of wellbeing that a person experiences in their work, is becoming a core issue for the investigation of the organization (Boada & Tous, 1993).
According to Schneider (1985), among the reasons capable of explaining the attention being paid to job satisfaction we should consider that satisfaction in the workplace is an important result of organizational life and that satisfaction has appeared in different researches as a significant predictor of important behaviors, such as absenteeism and the change of positions and switching from one organization to another. On the other hand, we cannot forget that in our country service organizations abound, and in these the worker’s attitude when a certain service is provided gains great importance, as this can decisively affect the quality of such service (Peiró, J.M. González-Romá, V., Zurriaga, R., Ramos, J. and Bravo, M.J., 1989).
Currently, there is no unanimously accepted definition for the concept of job satisfaction. Indeed, on many occasions each author creates a new definition for their own research (Harpaz, 1983).
The concept of job satisfaction has been defined in as many ways as there are authors who have formulated theories on the matter. First, there are a series of definitions that refer to job satisfaction as an emotional state, feelings or affective responses. Authors such as Price and Muller (1986) identify job satisfaction as how much individuals like their work. Other authors like Porter & Lawler, (1991) express that it is the result of motivation regarding performance on the job (the degree to which the rewards satisfy the individual's expectations) and the way in which the individual perceives the effort-to-reward ratio. Newstron & Davis (1993) define it as a group of feelings and favorable or unfavorable emotions by which the employees see their work. Meanwhile, Leal, Alfaro de Prado, Rodríguez & Román. (1999) consider that a worker is satisfied with their work when, as a result, they experience feelings of wellbeing, pleasure or happiness.
Larrainzar, Miñarro, Molinos & Verdú (2001) express that job satisfaction is comprised by the group of behaviors, sensations and feelings that the members of the organization bear for their work; thus focusing on the individual perception, the affective evaluation people give to an organization and the consequences derived from this. Finally, another important definition is the one offered by Davis & Newstrom (2007), who define job satisfaction as a group of favorable and unfavorable feelings through which the employees perceive their work. Job satisfaction is ever changing because feelings of satisfaction rise and fall as the motives of achievement are covered, so the initial intensities are complemented through the conducts by which they are followed.
From these definitions, in our understanding, the one that best fits this term and that is most accepted by the literature is the one proposed by Locke (1976). For this author, job satisfaction is “a pleasurable or positive state, resulting from the valuation of the work or of the subject’s job experiences.” This definition supposes the acceptance that job satisfaction is a global construct, which covers specific facets of satisfaction such as the work itself, the colleagues, salary and benefits, supervision systems, promotion opportunities, work conditions, etc. In this sense, it is assumed that this set of facets is articulated in an integrating concept called job satisfaction.
A second group of authors considers that job satisfaction goes beyond emotions and this is why the former is so important for on-the-job behavior. These authors conceive job satisfaction as a generalized attitude towards work. Schneider & Snyder (1975) define it as a generalized attitude towards work. Harpaz (1983) reviewed the different definitions of job satisfaction and concluded that job satisfaction, among other attitudes, is comprised by affective, cognitive and behavioral elements. These components can vary in consistency and magnitude; they can be obtained from different sources and have different roles for the individual. Likewise, he indicates that people who work usually develop a set of attitudes that may be described by the general term of job satisfaction. For Peiró (1984) this is a general attitude, resulting from many specific attitudes related to diverse aspects of the job and the organization. Schultz (1995) defines satisfaction as an attitude or set of attitudes developed by the person towards their job situation; these attitudes may refer to the job in general or to specific facets of it. And for Brief & Weiss (2001) it is a combination between what affects the feelings and the cognition (thinking). Satisfaction as an attitude is a hypothetical construct that is manifested affectively or cognitively.
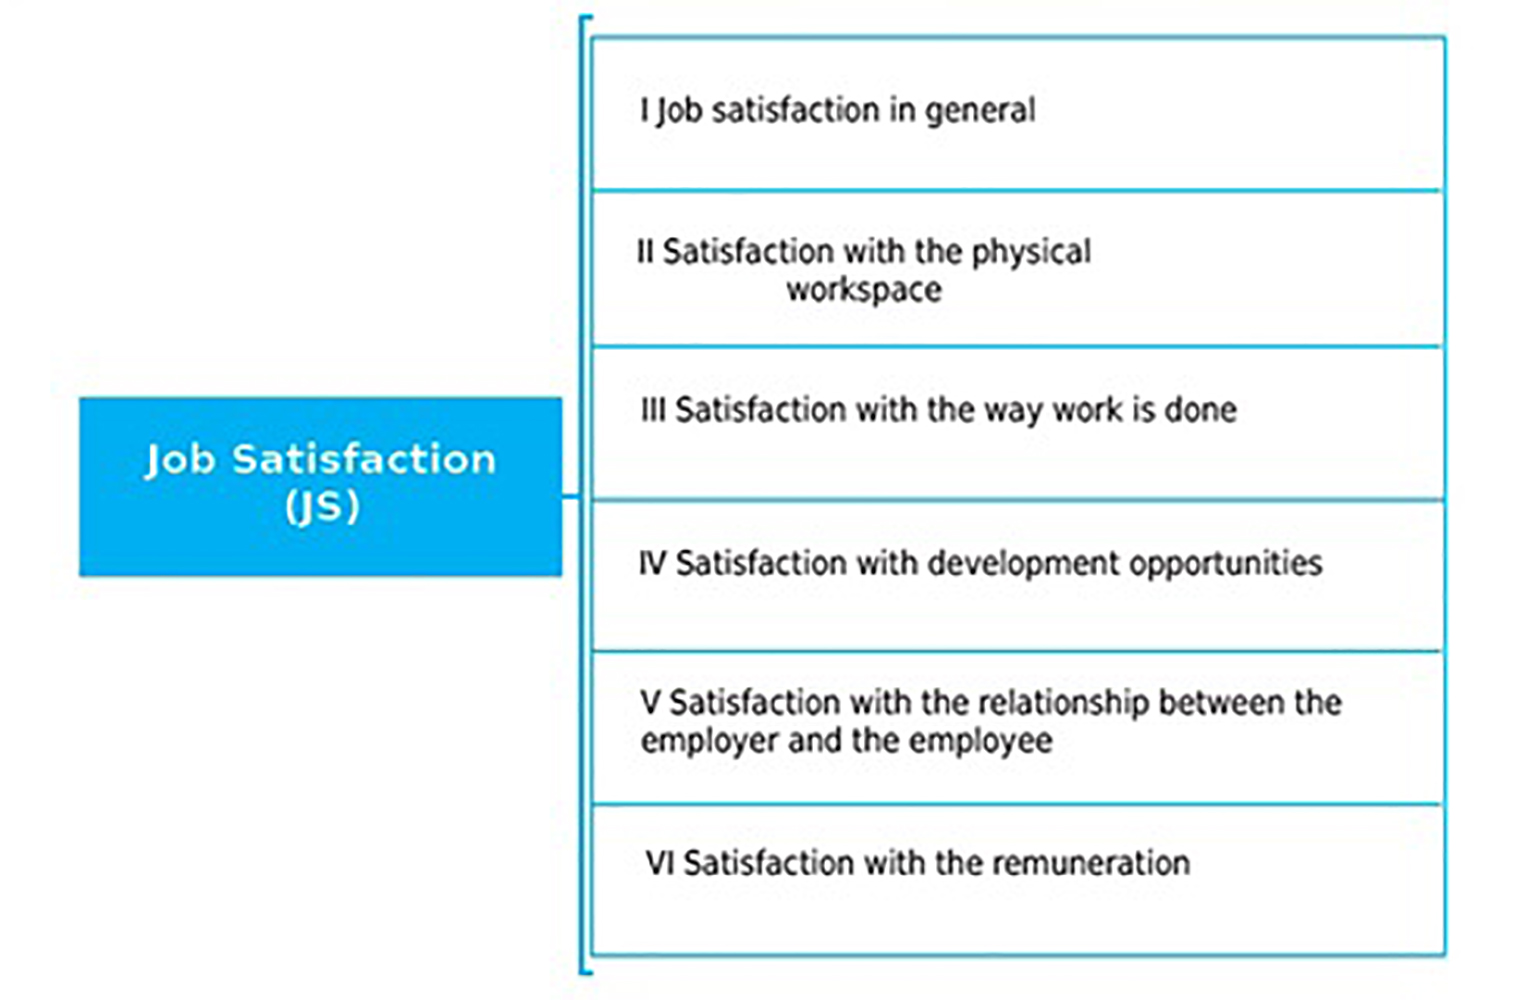
In this way, the study of job satisfaction is framed by the analysis of attitudes towards to working, along with organizational commitments and job implications (Peiró, González-Roma, Bravo & Zurriaga, 1995). Then, it can be concluded with Bravo, Peiró & Rodríguez, (1996), that job satisfaction is an attitude or set of attitudes developed by the person towards their job situation. These attitudes may refer to the job in general or to specific facets of it. Thus, job satisfaction is, basically, a globalizing concept through which reference is made to people’s attitudes towards different aspects of their job. Figure 1 shows this construct.
2. Methodology
This research focuses on characterizing the workers of public entities regarding their job satisfaction using the model presented in Figure 1. The structural equations model is used for this through a first and second level confirmatory factorial analysis.
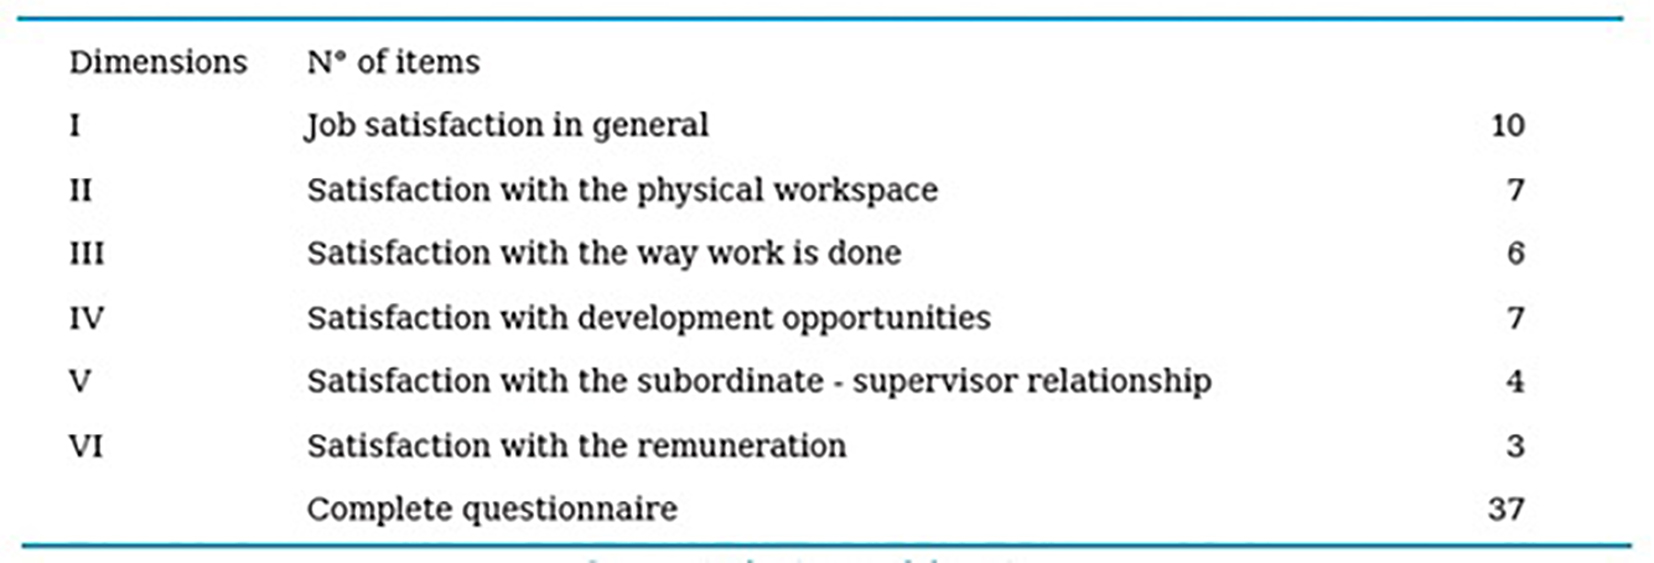
The number of items corresponding to each dimension is presented in Table 1. The study is performed with a sample of 216 Chilean workers from public schools, 70% female and 30% male, aged between 23 and 64, with an average age of 41 years.
2.1. Hypotheses
The following hypotheses are formulated to evaluate the relationship between job satisfaction and the six satisfaction attitudes shown in Figure 1.
H1: Work satisfaction in general generates positive effects on the job satisfaction construct.
H2: Satisfaction with the physical environment of the workplace generates positive effects on the job satisfaction construct.
H3: Satisfaction with the way the work is done generates positive effects on the job satisfaction construct.
H4: Satisfaction from opportunities to grow generates positive effects on the job satisfaction construct.
H5: Satisfaction with the relationship between the employee and the employer, generates positive effects on the job satisfaction construct.
H6: Satisfaction with the salary level generates positive effects in the job satisfaction construct.
2.2. Application of the tool
The questionnaire was handed out to the workers. Their participation was voluntary and anonymous. The application of the questionnaire was done personally, it was self-applied and had no time limit. All subjects received the survey with a cover letter where the research project was explained.
The job satisfaction questionnaire prepared by Chiang & Nuñez (2007) and Chiang, Salazar, Huerta & Nuñez (2008) to meassure job satisfaction in work groups of public organizations. This validated questionnaire consists of 39 items (Table 2). The workers answered each element using a five-point Likert answering format (from “Strongly agree = 5” to “Strongly disagree = 1”). The values of the scales are obtained through the average value of the elements of each scale.
2.3. Analysis of the data
With the purpose of inquiring whether the data collected verifies the hypotheses set out, it was decided to use, on one hand, a Confirmatory Factorial Analysis (CFA), which allows to confirm the relationship between the six dimensions regarding Job Satisfaction and, on the other, to perform a Second Level Confirmatory Factorial Analysis, which allows to see whether Job Satisfaction is actually manifested through the six dimensions presented in Figure 1. Both analyses were done using the free R software’s sem package (Fox, Nie & Byrnes, 2013), taking as entry data the matrix of variances and co-variances of the items involved.
To perform the Confirmatory Factorial Analysis, the relations stipulated for dimensions I to VI were represented, just as shown in Figure 1. The global model was formed by the first six dimensions with their corresponding items (Table 3), being susceptible to modifications based on the quality of the adjustment and the relevance of its parameters. The last two dimensions were not considered as they only include one item.

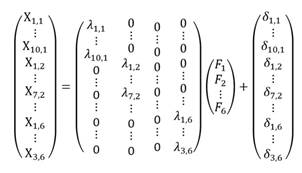
The mathematical formula of the factorial model (measurement model) is given by:
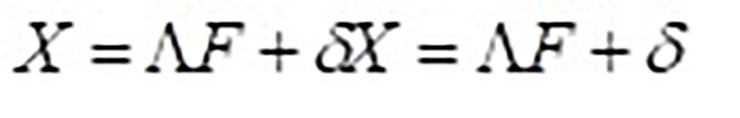 (1)
(1)
where X (37x1) is the column vector of the questionnaire's 37 indicators, Λ (37x6) is the matrix of factorial loads, F (6x1) is the vector which contains the exogenous latent variables, and δ (37x1) is the error vector of the measurement of X. The matrix of factorial loads represents the influence of the latent factor F K , K=1,...,6 on its indicators (items), where in the case of confirmatory factorial analysis, will only have saturation in the column corresponding to the factor that it represents. Within the matrix, it is written as:
The matrix of inter-factor variances and co-variances is given by:
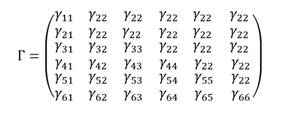
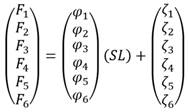
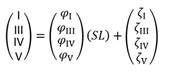
Where the diagonal elements correspond to the variances of the factors. For the second level confirmatory factorial analysis, the structural model is added, which relates the latent factors of the previous part to the “Job Satisfaction” factor, whose matrix structure is explained as:
F = ɸ * SL + Z (2)
3. Results
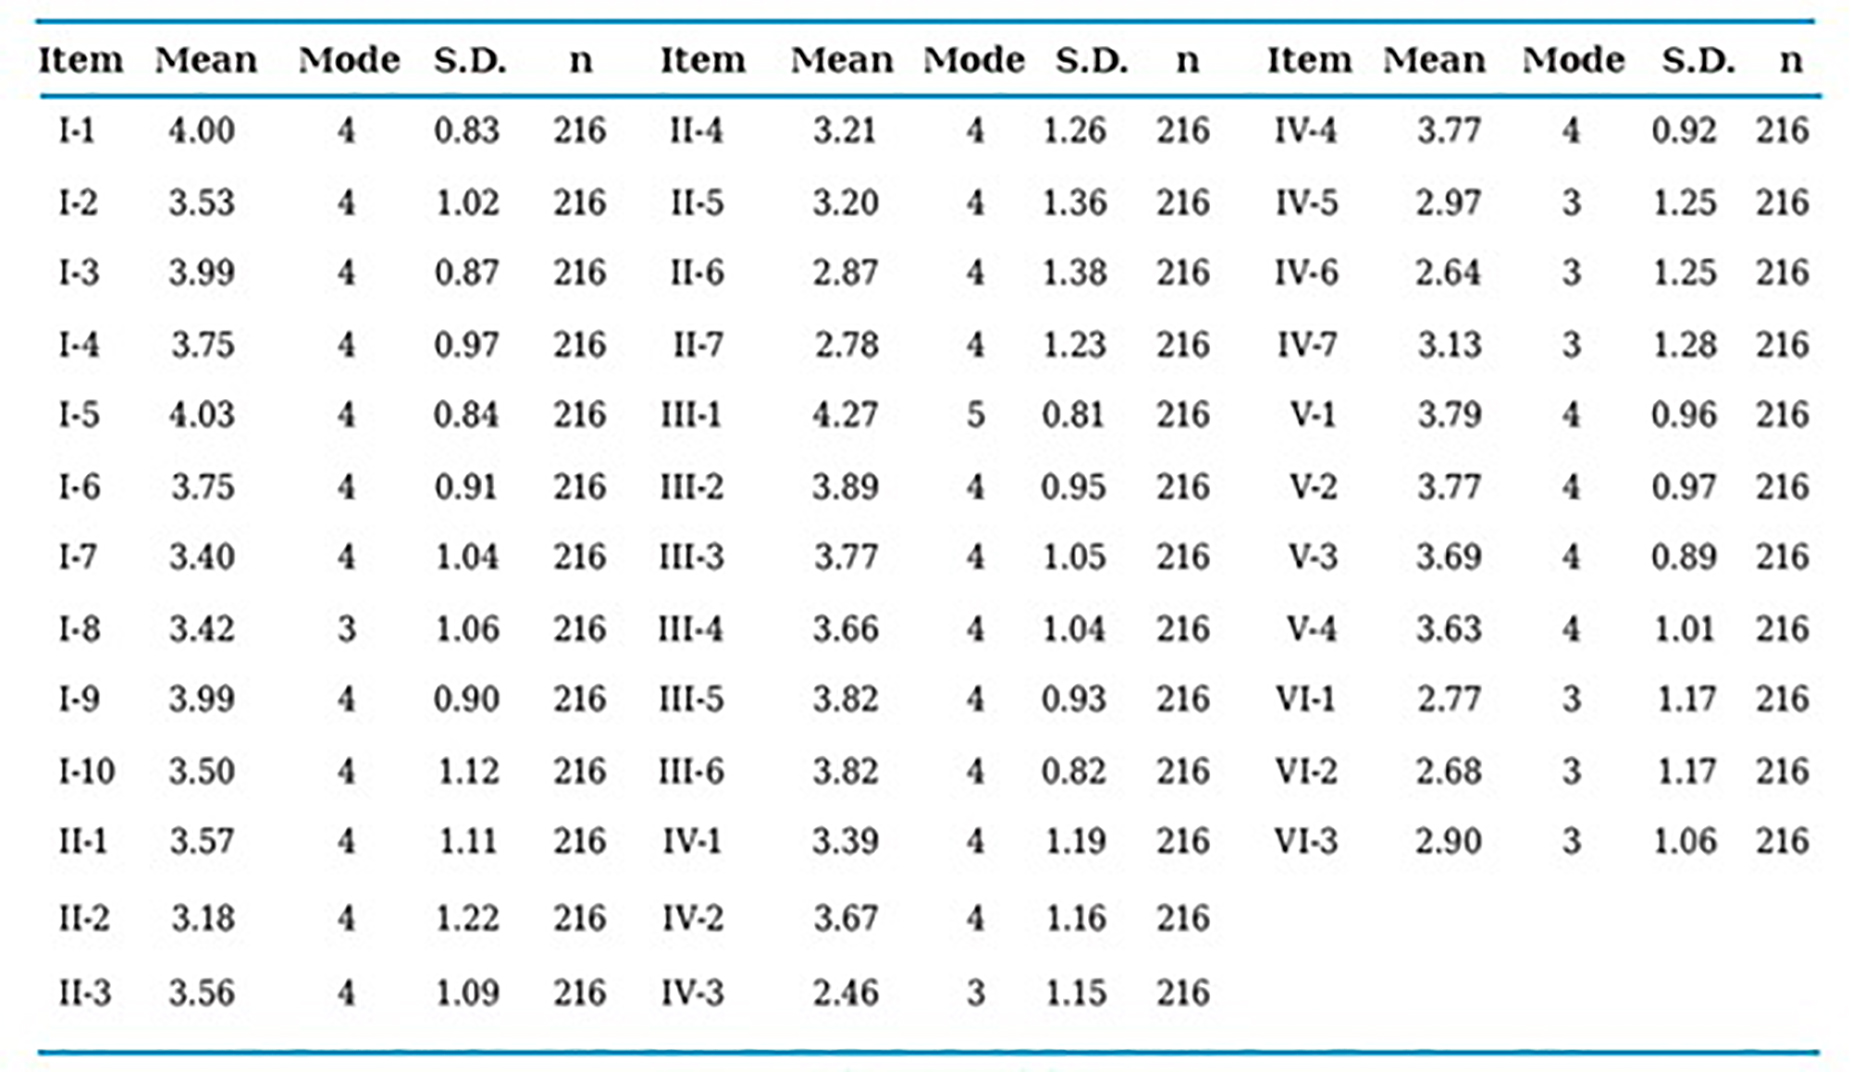
With the purpose of explaining the opinion of the Chilean workers surveyed in this study about the different attitudes of job satisfaction, a descriptive analysis of the items corresponding to each one of the job satisfaction dimensions was made. In Table 2, the average values, most frequent values and the standard deviations of each one of the items analyzed are presented. The results indicate that the average and modal values of most items analyzed are above the average score of the measurement scale used (average score = 3). This shows the existence of positive opinions (which range from “agree” to “strongly agree”) about the aspects analyzed.
The item with the lowest evaluation is the dimension “satisfaction with development opportunities”. Specifically, those surveyed state a low satisfaction with the promotion opportunities the organization has.
In second place, in Table 3, the average scores, standard deviations and Cronbach Alpha coefficient are presented by dimension. The six dimensions have a reliability coefficient above 0.80, with dimensions I, II, IV and V having coefficients close to 0.90, considered as “excellent” according to George & Mallery (2003, p. 231), which is why the global internal consistency of the tool is satisfactory.
3.1. Confirmatory Factorial Analysis
To verify the structure established in the hypotheses, the tool was submitted to confirmatory factorial analysis with R’s sem package, using the sample’s variances and co-variances matrix as entry data and applying the generalized least square procedure (this method allows to make inferences, despite the absence of multi-variant normality). The global model contains six exogeneous latent variables, which correspond to each one of the dimensions presented in Figure 1. The initial results of the analysis for this model presented in Table 4, show that the proposed theoretical model does not suitably fit the empirical data (X 2= 909.79, p= 0.000, g.l. =615). However, it has an improbable fit, which is increased by discarding those insignificant relations by trial-and-error, as well as the incorrect estimations that are typical of an iterative process, such as negative variances (Heywood Cases) or standardized estimations higher than the unit (Lèvy & Varela, 2006).
Table 4 Goodness of fit indexes for the global model and the improved model
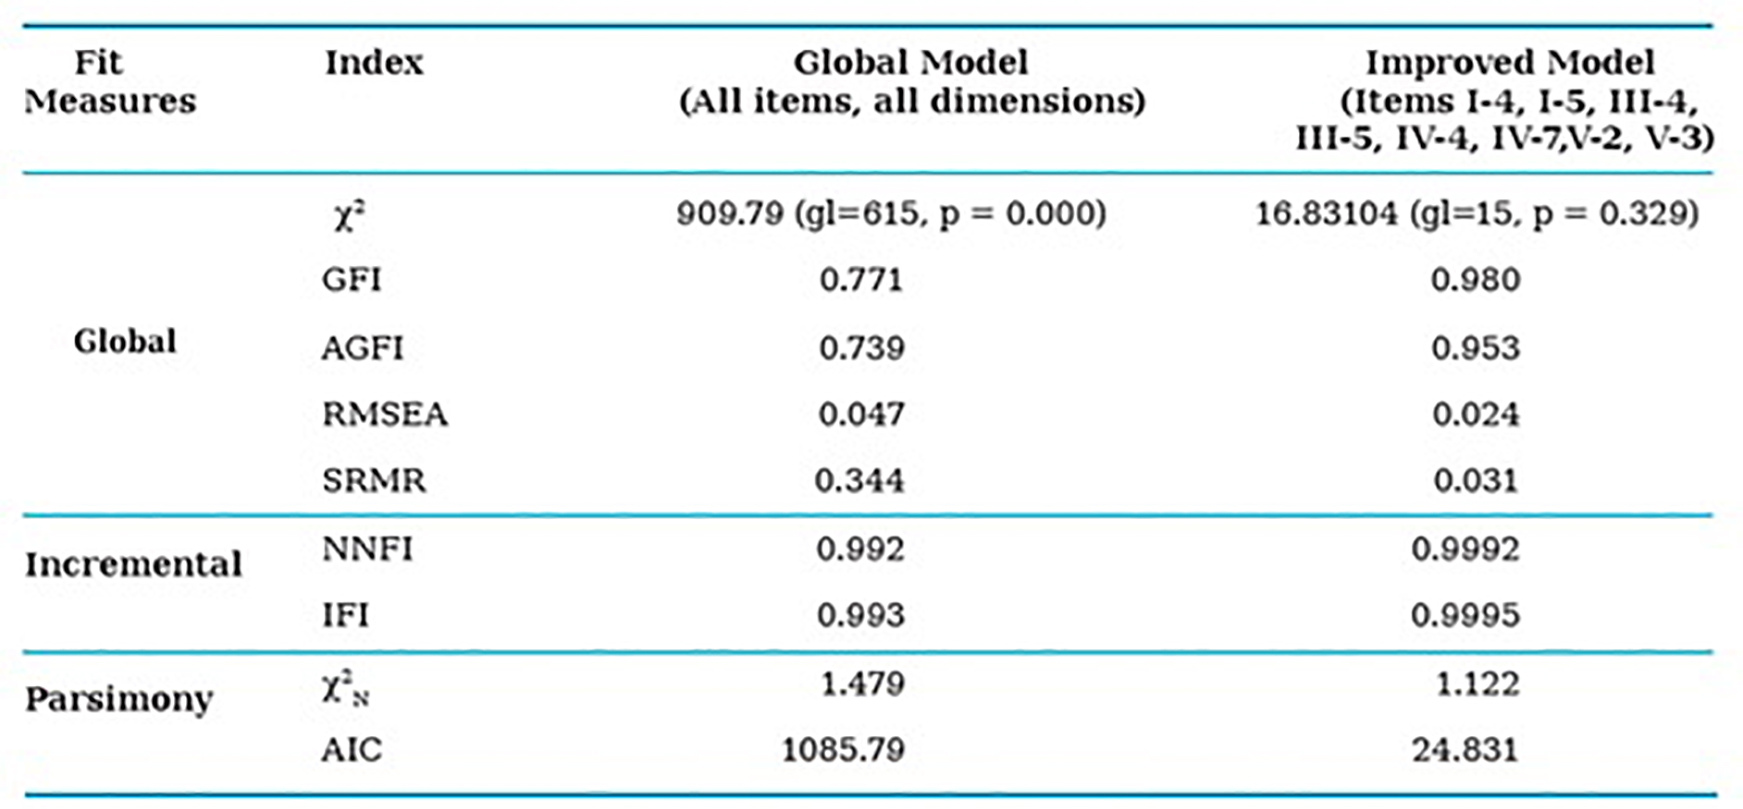
Source: Author´s own elaboration
The outline that the structural equations model shows, after its final adjustment, is presented in Figure 2, where the dimensions with their corresponding correlations are located on the left, the saturations of the variables in each indicator are in the middle and the measurement errors of each item, on the right.
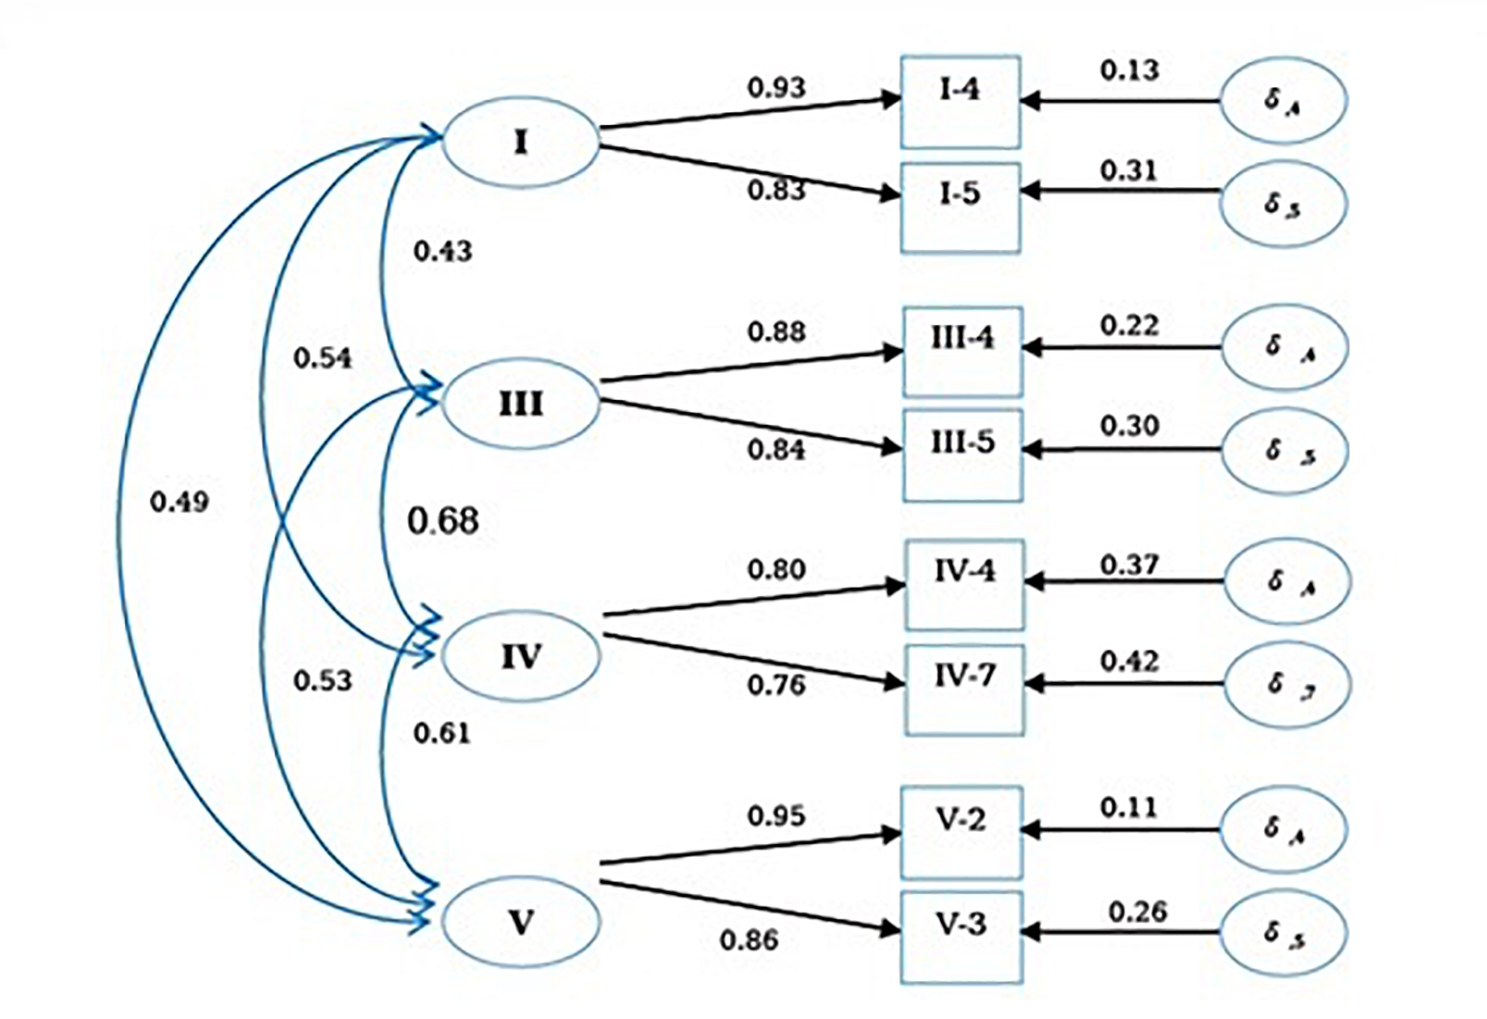
Figure 2 Standardized parameters of the job satisfaction model. First Level Confirmatory Factorial Analysis. Source: Author´s own elaboration.
These results show that all the model’s factors are well expressed by their indicators, exceeding the minimum threshold of 0.6 (Hair & Anderson, 2000, p. 639) and positively reporting the validity of the factors obtained, with “satisfaction with the relationship between employee and employer” (factor V) being the best reflected one by its indicators, which for the sample of Chilean workers corresponds to the satisfaction with the supervision that is exercised over them (saturation = 0.95) and with the proximity and frequency by which they are supervised (saturation = 0.86).
Regarding the relations between factors, the “satisfaction with the way the work is done” (factor III) is the one which has the highest correlation with the “development opportunities” (factor IV) and with the satisfaction with the “relationship between the employer and the employee” (factor V), with the most intense being factor (IV) (correlation = 0.68).
3.2. Model's goodness of fit
To examine the goodness of fit, different authors suggest indexes that reveal whether the sample data supports the theory set out, such as the chi-squared statistic (X
2), the GFI (goodness of fit index), the RMSEA (root mean square error of approximation), the SRMR (square root mean residual), or the AGFI (adjusted goodness of fit index). In terms of the incremental fit, where the proposed model is compared with a null model without any relationship between the dimensions, Lèvy & Varela (2006, p.21-22) proposed the NNFI (non-normed fit index) or the IFI (incremental fit index) to evaluate this aspect. As for the model’s parsimony, namely, the relationship of the model's goodness of fit with the number of parameters needed to achieve said level of fit, we find the AIC (Akaike information criteria) and the normalized chi-squared statistic ( )
)
The indexes obtained in this research are shown in Table 4. As it has already been mentioned, the chi-squared coefficient is relevant for the global model, but it is seen that for the improved model there is statistical evidence favoring the suitability of the model (X 2 = 16,83, p= 0,329, g.l.= 15). This structure was considered for the Second Level Confirmatory Analysis which is presented further on. Likewise, the rest of the absolute fit indexes and the incremental and parsimony fit show the same trend, so it is concluded that the improved model's suitably fits the empirical data.
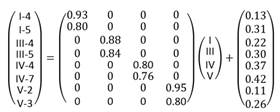
The improved model has the following matrix structure:
The correlations matrix between the dimensions is given by:
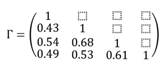
The coefficients of the correlations matrix are all above 0.4, and relevant to 1%.
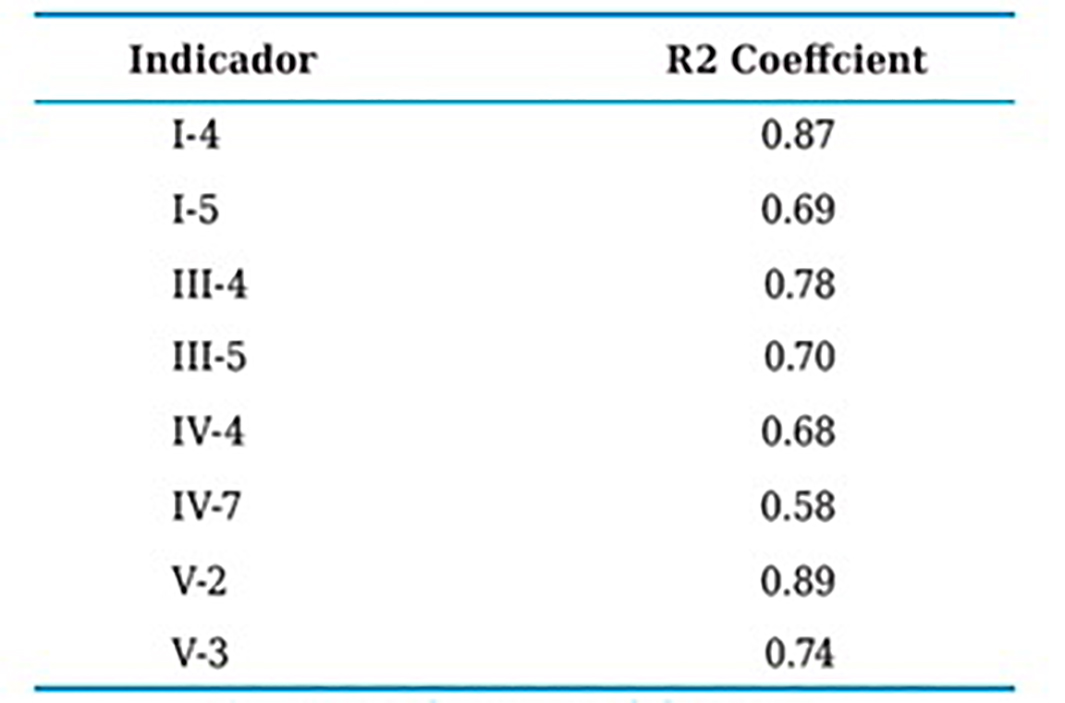
The reliability of the indicators in terms of the dimensions is evaluated through the R² determination coefficient and is obtained as the difference between 1 and the end of the random error corresponding to each item. This corresponds to the indicator’s proportion of variance which can be explained by the corresponding factor(s). That is, the part of the measure that is free from the random error (Bollen, 1989; p.207). The results for the items show percentages that are mainly above 70%. These are presented in Table 5.
Table 5 Variance proportion of the indicator which can be explained by its factor. Improved Model
Source: Author´s own elaboration
In terms of the reliability of the model’s constructs, a similar evaluation to the R² determination coefficient can be obtained, considering the expressions that are presented by Levy & Varela (2006, p.137). The four dimensions obtained record reliability coefficients above 0.75, which are considered suitable. These authors also recommend considering the Variance Taken from each one of the dimensions, seeing over than 60% of the variance is concentrated in the four factors. These results, which are presented in Table 6, show the suitability of the indicators used to explain the behavior of the four dimensions, empirically.
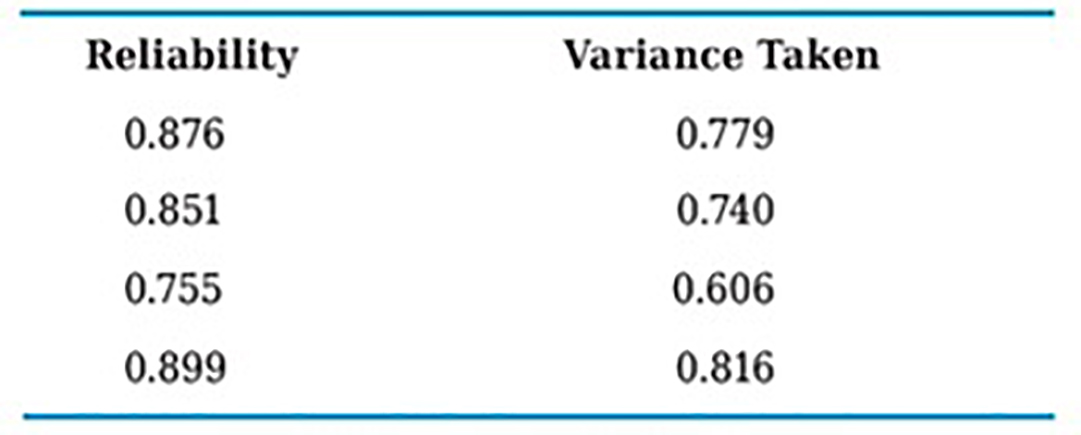
3.3. Second Level Confirmatory Factorial Analysis
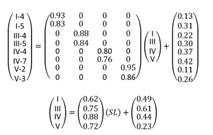
Following the pattern of the factors identified, the next goal is to check whether “Job Satisfaction (JS)” corresponds to a latent construct common to these. Given that the factorial loads are higher than 0.6 and relevant; a second level confirmatory factorial analysis will be tested where “Job Satisfaction” is configured by the four factors of the (first level) improved model. That is, the new variable called JS, represents the “Job Satisfaction” global construct specified from the “job satisfaction in general”, “satisfaction with the way work is done”, “satisfaction with development opportunities” and “satisfaction with the relationship between the employer and the employee.” In turn, these are defined from their corresponding items (I-4: in my unit, information flows and there is a spirit of collaboration and helpness I-5: there is a good relationship among the units’ members; III-4: the opportunities my job offers me to do things where I stand out, III-5: the opportunities my job offers me to do things that I like; IV-4: the degree of general satisfaction with the Organization, IV-7 “equality” and “justice” in terms of the treatment they receive from their organization; V-2: the supervision that they exercise over you and V-3: the proximity and frequency by which you are supervised).
The matrix writing is as follows:
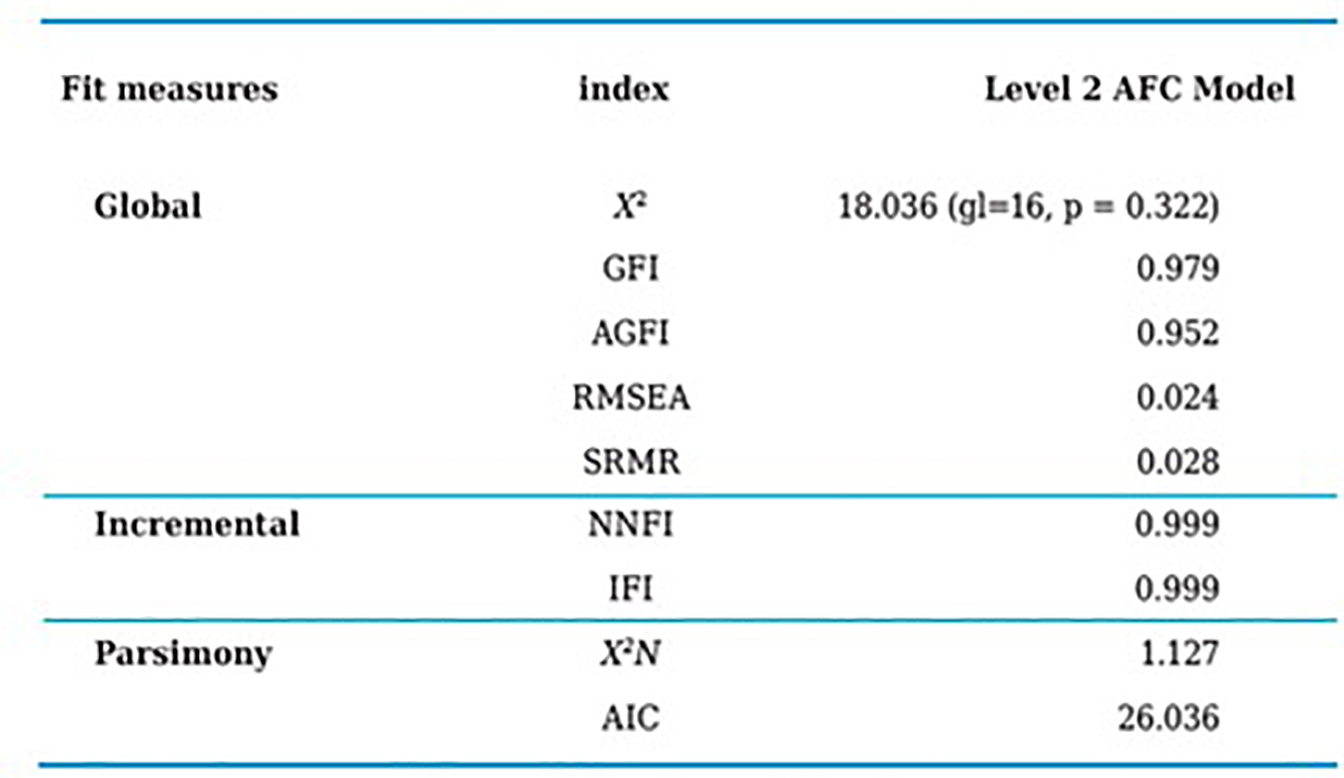
The goodness of fit indexes are calculated in the same way as in the previous analysis. In the model, a good fit has been achieved in the global fit and in the incremental and parsimony ones. Likewise, the chi-squared coefficient provides statistical evidence in favor of the analysis’ hypothesis (X 2 = 18,04, p= 0,322) (Table 7).
Table 7 Goodness of fit indexes for the second level confirmatory factorial model
Source: Author´s own elaboration
The fit models are expressed as a matrix as:
In Figure 3 the outline that shows the structural equations, after their final adjustment, is presented. The dimension of “Job Satisfaction” is located on the left; then the sub-dimensions along with their measurement errors; in the center, the estimated parameters; and to the right, the measurement errors of each item.
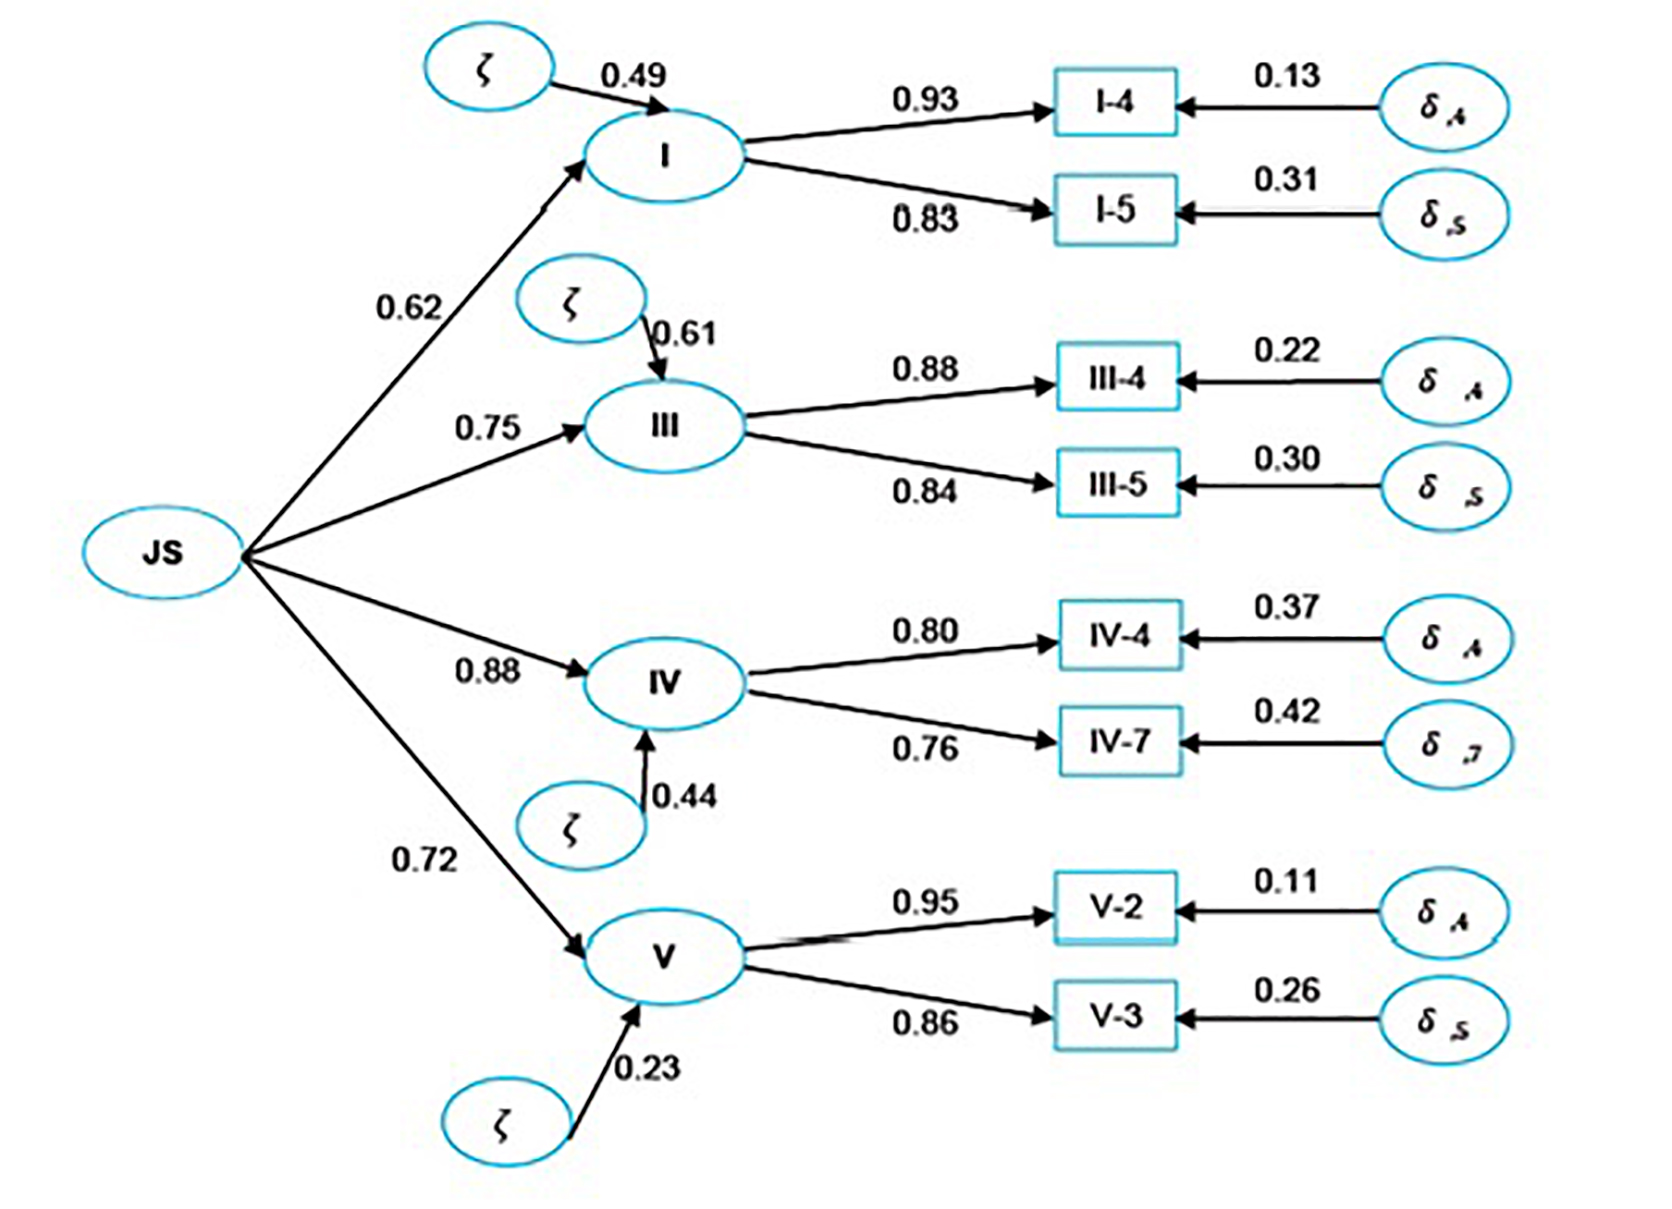
Figure 3 Standardized parameters of job Satisfaction. Second Level Confirmatory Factorial analysis. Source: Author´s own elaboaration
As for the reliability of the JS factor, this corresponds to 0.833 and is considered suitable, while the variance extracted is 0.559. That is to say, it concentrates 55.9% of the variability.
“Job satisfaction in general” has a correlation of 0.62 with JS and 51% of this is explained by the Job satisfaction's upper construct. Likewise, factor III (“satisfaction with the way work is done”) has a factorial load of 0.75 and 39% of this is explained by JS. Similarly, 56% of the “satisfaction with development opportunities” is explained by Job Satisfaction, with a factorial load of 0.88, and 77% of the “satisfaction with the relationship between the employer and the employee” is explained by JS with a load of 0.72.
These results, along with those referring to the goodness of fit indexes, support the model that defines Job Satisfaction as a function of “job satisfaction in general”, “satisfaction with the way work is done”, “satisfaction with development opportunities” and “satisfaction with the relationship between the employer and the employee.”
4. Conclusions
As a first general conclusion, we can say that Chilean public organizations' workers have a positive opinion about the attitudes measured in each one of the six job satisfaction dimensions. They mainly “agree” or “strongly agree” with the aspects analyzed and are satisfied or very satisfied with the difference aspects of their work.
The first level structural equations model, after its final adjustment, chooses four of the six original dimensions. These factors are well expressed by their indicators, exceeding the minimum threshold of 0.6 and positively reporting their validity with “satisfaction with the relationship between the employer and the employee” being the best reflected one by its indicators, which for the sample of Chilean workers corresponds to the satisfaction with the supervision employers exercise over them and with the proximity and frequency that they are supervised: This shows the importance that work aspects in connection with the relations of the worker with the employer have for Chilean organizations. The organizations make sure that this relation is well perceived by both parties.
Regarding the hypotheses made, the second level confirmatory factorial analysis allows to conclude that the satisfaction attitudes for work in general, through items 4 and 5 (I-4: in my unit, information flows and there is a spirit of collaboration and helpness I-5: there is a good relationship among the units’ members), satisfaction with the way work is done (items III-4: the opportunities my work offers me to do things where I stand out, III-5: the opportunities my work offers me to do things that I like), satisfaction with development opportunities (items IV-4: the degree of general satisfaction with the Organization, IV-7 “equality” and “justice” in terms of the treatment they receive from their organization) and satisfaction with the relationship between the employer and the employee (items V-2: the supervision that they exercise over you and V-3: the proximity and frequency by which you are supervised) generate positive effects on the job satisfaction construct. These results show that to improve the worker’s job satisfaction it is important that there are good relationships among team members that there are opportunities to work in what they know and like, that they perceive everyone has equal opportunities within the organization and that they have a good relationship with their employer.
The analysis done did not allow to detect whether the attitudes, satisfaction with the physical workspace and satisfaction with the remuneration have any effect on the job satisfaction construct.
Finally, it is important to highlight that the scales applied work well enough in Chilean public organizations. Just as the scales’ reliability coefficients show, these are clearly high, which means that the global internal consistency of the tool is satisfactory; that is, the scales suitably differentiate the work groups from each other. This result confirms those obtained in the research projects of Chiang et al. (2008) and Chiang et al. (2011) in Chilean public organizations.

