English (pdf)
 Article in xml format
 Article references
 Send this article by e-mail
 Cited by SciELO
  Cited by Google
  Similars in
SciELO
Similars in
SciELO  Similars in Google
 Permalink
1. Introduction
This paper analyses the evolution of Colombia’s foreign trade, disaggregating by economic sector as well as by exports’ region of destination and origin of imports. It will analyze the evolution of adjustment costs derived from the country’s international trade pattern over the period 1991-2015 as well. Adjustment costs refer to the economic costs inherent in the reallocation of labor between different sectors, to re-orientating skills and learning processes thereof, and changes in production technologies. All of the above occurs in order to adapt to new economic situations brought about by competition from international trade, either in the context of new global economic conjunctures or in the context of nationally developed processes of economic opening.
A country that specializes in the production of certain economic sectors over a period does so based on specific patterns of allocation of available resources such as land, capital and workforce. Notwithstanding, in the face of international competition, the country may be forced to reorient its specialization towards manufacturing other types of goods and other economic sectors, and therefore incur in adjustment costs significant at the aggregate level, which might lead the economy -at least temporarily- to being below the scope of its production potential. Hence, high adjustment costs lead to inefficiencies for the economy. It is wherefore vital to analyze the interaction between trading patterns of the economy and the resulting adjustment costs, especially in the case of countries that depend highly on the foreign trade of primary goods, such as Colombia.
The first to shed light on international trade-induced adjustment costs was Balassa in 1966, who introduced the Smooth Adjustment Hypothesis (SAH). This hypothesis posits that if intra-industry trade dominates in the economy, the adjustment costs arising from the processes of economic opening or induced by changes in trade patterns will be lower.
In this sense, with an increasingly globalized world and greater trade agreements, research that links industry and other economic sectors to foreign trade is important, especially when trade patterns such as intra-industry ones can bestow greater impetus to economies of scale, product differentiation and therefore monopolistic competition. Thus, in this research, the analysis of economic sectors, particularly industry, plays a fundamental role, and the aim of the study is to analyze their relationship with international trade. Therefore, the research question is ¿what has been the evolution of adjustment costs for the different economic sectors of the Colombian economy during the period 1991-2015?
Thus, the general objective of the article is to analyze the adjustment costs for the different economic sectors of the Colombian economy during the 1991-2015 period, considering the pattern of international trade. Specific objectives are: 1) To analyze foreign trade flows per economic sector and trade zones in Colombia; 2) To examine marginal intra-industry trade (MIIT) and its relationship with adjustment costs; 3) To evaluate the fulfillment of the Balassa (1966) Smooth Adjustment Hypothesis (SAH) at a descriptive level.
The contribution of this work is twofold. Firstly, progress is being made in the analysis of the evolution and characteristics of trade flows in the Colombian economy, with emphasis on sectoral trade and marginal intra-industry trade patterns. Secondly, progress is being made in the analysis of adjustment costs inherent in the pattern of international trade based on Brülhart (1994) and Azhar y Elliott (2003) methodologies, the latter being novel for the national order. In addition, the Smooth Adjustment Hypothesis proposed by Balassa (1966) is empirically studied.
Among the main results are: first, the trade flow per economic sector shows correspondence between export and import relationships within the same economic sectors, which in general indicates the presence of intra-industry trade. Second, the marginal intra-industry trade and adjustment cost indexes show that the Colombian industry is in potential intra-industry trade scenarios, wherefore adjustment pressures arising from the pattern of trade are lower. Notwithstanding, there is ample scope to further deepen intra-industry relations.
Third, economic sectors such as chemical substances and products, plastic and rubber products, metal products, textiles and clothing, wood products and their derivatives, show lower adjustment costs induced by marginal intra-industrial trade, which is beneficial for Colombia in terms of its productive stakes, world-class economic sectors with high participation in the generation of employment and added value. Fourth, trade relationships in these economic sectors occupy important positions with countries where Colombia shares similar relative factor endowments such as Ecuador, Chile, Brazil, Mexico and Venezuela (Annex 1). Therefore, deepening marginal intra-industry trade with these countries may result in fewer adjustment pressures on domestic production factors.
The article is divided into four sections. First of all, this introduction. The second section presents the theoretical and reference framework on adjustment costs and their relationship to the pattern of international trade. The third section analyzes exports and imports per economic sector of the Colombian economy and the indexes that allow visualizing the evolution of intra-industry marginal trade and adjustment costs from 1991 to 2015. Finally, some conclusions are stated.
2. State of the art
Based on the classic works by Balassa (1966) and Grubel and Lloyd (1975), various investigations were carried out on the effects of the economic opening processes. One of the effects has to do with adjustment costs for changes in the trade pattern. The main result of these analyses was the Smooth Adjustment Hypothesis (SAH) formulated by Balassa (1966) and referred to in Krugman (1981). The SAH posits that adjustment costs are lower when international trade-flows increases occur at the intra-industry level; the opposite happens if the increases tend to occur at the inter-industry level. Therefore, the analysis of adjustment costs induced by expansions in trade flows is framed within the intra-industry trade theory (IIT). This theory has not only had interesting developments at a theoretical level (Helpman and Krugman (1985) and Grossman and Helpman (1991) are unavoidable references) but also at an empirical level, based on the aforementioned works by Balassa (1966) and Grubel and Lloyd (1975).
Adjustment costs refer to the complexity of mobilizing production factors and their properties across economic sectors. For instance, a country or region engaged in the production of dairy products over a period of time has specialized resources to produce such products, but what would happen to the factors of production if, for political or international trade reasons, the country or region were to shift its specialization to the manufacturing of machinery and equipment? This will bring economic and social costs due to the transferring of labor, new knowledge and a changing technology in order to adapt to the new economic situation.
Thus, in the short term, adjustment costs bring about processes of inefficiency within the scope of production possibilities, caused mainly because economies, which differ from one country and region to another, face costly transformations related to various types of economic costs: training costs for personnel transferred from one economic sector to another, costs of coupling supply and demand for labor that generate temporary unemployment and therefore affect the duration of unemployment, costs for relocating and/or adapting technologies, machinery and equipment, and/or purchasing new technologies, among other aspects.
The main references to the literature on marginal intra-industry trade and adjustment costs and the key definitions and indicators are presented below.
A. Marginal intra-industry trade
Hamilton and Kniest (1991) and Brülhart (1994) introduced dynamic indexes of intra-industry trade consistent with movements in factors of production and industry aggregate values. If the simultaneous growth of exports and imports occurs at an intra-industry level, then the reallocations of the production factors take place in the same industry and almost immediately, with minimal adjustment costs. In this sense, these works responded to the need of empirically verifying the SAH, almost 25 years after its formulation.
These kinds of dynamic indicators have since been referred to as marginal intra-industry trade indexes and are most conducive to analyzing trade-induced adjustment costs (Hamilton and Kniest, 1991).
Marginal intra-industry trade (MIIT) denotes parallel increases or decreases in imports and exports within the same industry. Therefore, the coincident changes in trade volumes by industry sector are expected to have a neutral effect on the factors of production. The most widely used indicator of intra-industry marginal trade in the literature is the A index by Brülhart (1994). This index’s definition per industry follows:
Where
The indexes (individual) and (aggregate) vary in the closed range; therefore, if the value is 1, all marginal trade that has originated in the branch of economic activity, country or region is intra-industrial, or the value is 0 when all marginal trade that has originated is inter-industrial.
In general, the index (individual or aggregate) shows the impact of adjustment costs from trade patterns, so that a high value of the index resulting from growth or decline in the same proportion of exports and imports is related to low adjustment costs because the reallocation of production factors is induced within the same industry.
On the other hand, a low rate when the changes in exports and imports operate in the opposite way, points to companies specializing in different products and therefore the reallocation of production factors of some industries would take place in those that survive, thereby turning trade inter-industrial and inducing higher adjustment costs (Brülhart, 1994; Álvarez, 2005).
B. The literature on marginal intra-industry trade
At the international level, estimates of the Brülhart (1994) index have been made for many countries. A summary of the main studies is found in Lovely and Nelson (2002), White and Chen (2012), Rasekhi and Ghaderi (2012). The authors find that the research is inconclusive in favor of SAH or that there are weak links between intra-industry trade and subsequent adjustments in local economies.
In Colombia, the work by Posada, Ramírez and Ruiz (2005) showed the Brülhart (1994) A index for the national order, while at the regional level there are the works by Muñoz and Salinas (2008), Acevedo and Pinto (2011) and Hernández and Raffo (2016).
Posada et al. (2005) analyzed intra-industry trade between Colombia and the US over the period 1998-2002 for the UIIC’s economic sectors at three digits. They conclude that for total trade and for the vast majority of industrial sectors, marginal intra-industry trade is low, thus indicating higher adjustment costs or reallocation of productive factors.
At the regional level, Muñoz and Salinas (2008) analyzed international trade between Valle del Cauca, Ecuador and Venezuela, for the 1980-2006 period at four digits of the UIIC. The authors calculated index A between Valle-Ecuador and Valle-Venezuela, where they find indexes lower than 12%, with an annual average of 6%. In general, they conclude that the new trade generated at the industrial level is low and decreasing in recent years, pointing to greater adjustment pressures for Valle del Cauca deriving from trade relations with close trading partners such as Ecuador and Venezuela.
Likewise, Acevedo and Pinto (2011) calculated the marginal intra-industry trade based on index A for bilateral relations between Santander, Venezuela and the United States, with a six-digit breakdown of the harmonized system between 1995 and 2007. The authors found that despite the annual behavior of marginal intra-industry trade between Santander-Venezuela and Santander and Santander-USA, inter-industry trade described more accurately the dynamics of the trade pattern than intra-industry trade did thence reflecting higher adjustment costs. This is mostly visible for the latter years of the period under analysis, where there was a downward trend in marginal intra-industry trade between the department of Santander and its two main trading partners: the US and Venezuela.
The most recent work by Hernández and Raffo (2016) analyzes international trade in Valle del Cauca, calculating the Brülhart (1994) A index with a four-digit breakdown of the UIIC for the 1975-2014 period. They concluded that SAH is met for an important economic sector in the region such as Chemicals and Substances, while for the Textiles, clothing and leather sector, even though marginal intra-industry trade has grown, the adjustment costs derived thereof have also increased. On the one hand, this is due to the higher increase in imports than exports and on the other to the increase in vertical intra-industry trade. Overall, and for most economic sectors, a pattern of inter-industry trade remains evidenced by low A index values.
C. Adjustment Cost Index
On the other hand, the indicator that directly describes adjustment costs at both the marginal intra-industry and inter-industry levels is the Trade Adjustment Index (TAI) by Azhar and Elliott (2003). This index is described as:
Wherein ∆X= X t -X t-1 indicates the change in exports and ∆M=M t -M t-1 the change in imports between period t and the immediately preceding period, t-1. The S index is in the closed interval .
At the empirical level, researchers have made an arbitrary division of the S index according to condition -0,4<S<0,4 (Devadason, 2011; Azhar, Elliott and Liu, 2012; Erlat and Erlat, 2012; Eshraghi and Wana, 2013) that allows classifying the intra-industry trade that produces induced costs based on bilateral trade. Therefore, and taking into account that the S index can be divided according to limits (-δ,δ) for δ>0, the following cases arise:
Adjustment costs are high for S≤-δ as a result of marginal inter-industry trade, i.e. strong import growth not offset by export growth, or even more so, costs induced by declining exports.
Adjustment costs are high for δ≤S, but the inter-industry trade pattern is highly favorable for the country. In this case, exports grow much more than imports do; indeed, it is possible for imports to be falling, thereby reinforcing better scenarios of job creation and the generation of added value per industry.
For -δ<S<δ, adjustment costs are lower because of marginal intra-industry trade.
Cases (a) and (b) are the result of trade patterns based on comparative advantages, while case (c) is the result of adjustment costs arising from intra-industry trade.
In addition to the S index, Azhar and Elliott (2003) introduce a graphical tool that complements their adjustment cost analysis. The International Adjustment Cost Space (IACS) is a graphical tool for analyzing the evolution of trade flows and illuminating adjustments on the economy resulting from changes in trade patterns (Graph 1).
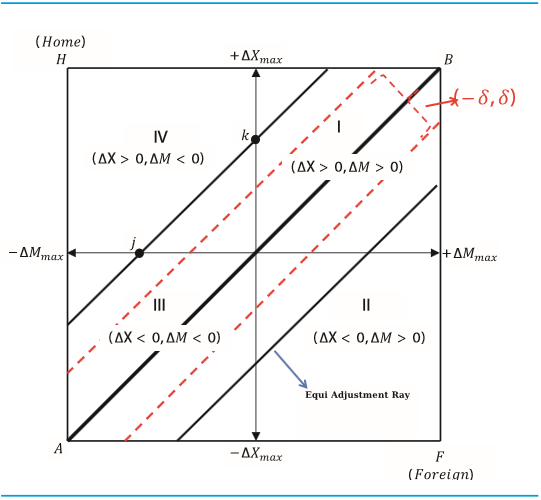
In the IACS, the x-axis measures the absolute change in exports, while the y-axis measures the absolute change in imports. The 45° diagonal shows the absolute changes in exports and imports as being equal and therefore adjustment costs would be zero. The band around the main 45° diagonal reproduces the (-δ,δ) index interval , where adjustment costs would be lower in the presence of increased intra-industry trade.
The space in the lower triangle, generated by the ABF points, shows that the variations of imports grow much more than the variations of exports so adjustment costs appear and therefore unemployment increases and production factors mobilize to other sectors. In contrast, for the upper triangle space (ABH), exports show greater variations than import growth and will indicate that industries are expanding for that period.
In addition, the further away the coordinates from the main diagonal to the right of the IACS are, the index tends to -1. Meanwhile, to the left of the IACS, the index S tends to 1, and therefore the greater the pressures of the trade-induced adjustment will be. For those sectors within (-δ,δ) band calculated for the index, the pattern is one of intra-industry trade and therefore there will be lower adjustment costs, while for those whose coordinates are outside, the pattern of trade is inter-industry and adjustment pressures are higher.
3. Relevant literature on adjustment costs
As for the use of the IACS and the S indicator, two important aspects become identifiable: one related to the costs induced without taking into account the type of intra-industry trade. The other is the scenario taken by the S indicator as an index of dynamic intra-industry trade to classify the marginal intra-industry trade that overlaps to make the differentiation by horizontal or vertical intra-industrial trade in a second stage. The first aspect contains the researches by Azhar and Elliott (2003), Mezo (2004) and Hernández and Raffo (2016); for the second, there are the works by Azhar, Elliott and Liu (2012), Eshragui and Wana (2013) and Devadason (2011).
In Colombia, Hernandez and Raffo’s (2016) research uses the S index and the IACS to strengthen their analysis of adjustment costs. The authors find that for the department of Valle del Cauca, the S index and the IACS reproduce the adjustment costs consistent with the Brülhart (1994) index for marginal intra-industry trade per economic cycle. The S index showed that 65% of economic sectors exhibited adjustment pressures during the 2010-2014 economic cycle, so that in the IACS the coordinates were located to the right and quite far from the main diagonal.
For the total trade flow of Colombia, there is no research analyzing the adjustment costs that it enables a result of the increase in intra-industry trade or inter-industry trade.
4. Empirical methodology and descriptive analysis
The empirical analysis’ basis is the trade flow of the Harmonized System (HS), consolidated by the National Tax and Customs Directorate of Colombia (DIAN by its acronym in Spanish) and reported by the National Administrative Department of Statistics (DANE by its acronym in Spanish). The joining of the HS tariff sections with the Uniform International Industrial Classification (UIIC) from 1991 to 2015 used the DANE Correspondence Tables. Each variable was consolidated at 4 digits of IACS for a total of 129 economic sub-sectors on an annual average. For aggregation to the 15 major economic sectors, equation 2 was used to analyze the trade pattern of the Colombian economy.
4.1. Colombian international trade Pattern
When discriminating imports and exports by origin and destination, Graph 2 shows that approximately 63% of the trade flow (imports and exports) occurs with the countries of Latin America and North America. The United States remains Colombia’s largest trading partner, despite exports having fallen by about 8% from their average for the 1991-2010 period since 2011, while imports have fallen only by about 4%. Latin America is the second most important region in Colombia’s trade flow, with countries such as Ecuador, Venezuela, Brazil, Peru, Mexico and Chile standing out, which are in the top 10 of Colombian exports2and in the top 12 of imports3.

Source: Authors’ own calculations with data from DANE-DIAN
Graph 2 Colombian exports and imports by trade region (1991-2015)
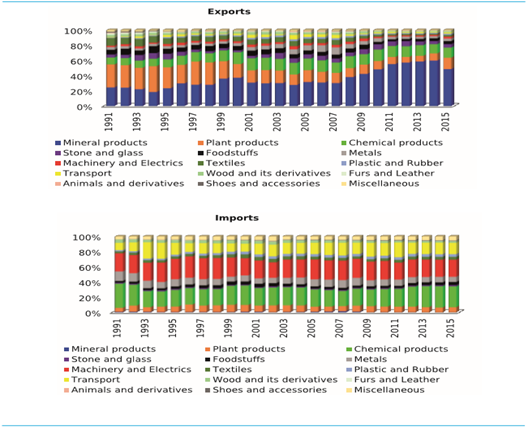
Graph 3 shows that the sector with the highest share of exports is that of mineral products related to the primary sector, which displayed a growing trend from 1991 to 2014, and a greater momentum from 2009 to 2014, when international prices for primary goods and raw materials such as coal, copper, and oil (the latter with significant effects on the Colombian economy) plummeted (Quero, 2016; González and Hernández, 2016). On the other hand, the imports of this economic sector equal 1% annual average of the total of imports; that is to say, Colombia is a net exporter of mineral products, based on an inter-industry type of trade.
Source: Authors’ own calculations with data from DANE-DIAN.
Graph 3 Colombian exports and imports by economic sector (1991-2015)
With regard to the manufacturing industry, which accounts for an average 45% of Colombia’s exports and 92% of its total imports, there is greater diversification of both exports and imports. These range from agro-industry to sectors of high technological content such as machinery, electrical equipment and transport, through raw materials sectors such as chemical substances and products, which are very important for the analysis of intra-industry trade in Colombia and industrial departments such as Valle del Cauca (Hernández and Raffo, 2016). Likewise, the branches of activity with the greatest participation in Colombian imports correspond to capital and intermediate goods, and Chemical substances and products, Machinery and electrical equipment, Metallic products and Transport equipment in that order, which sets up the country’s economic structure as a receiver of intermediate goods and exporter of final goods.
On the other hand, it is important to note in Graph 3 that despite the deficit balance for various sectors within the manufacturing industry, more pronounced in some than in others, the two-way trade flow remains over time. This is how, for instance, Colombia exports and imports goods from the Chemical substances and Products sector, Food and derived products related to agro-industrial processes, Metal products, Machinery and electrical goods, Textiles and clothing, Plastic and rubber products.
This bi-directional and intra-industry trade flow becomes more important when controlled by region or country, so that, for example, for countries with similar relative factor endowments to Colombia’s such as Brazil, Chile, Ecuador, Mexico and Peru (Annex 1), the chemicals substances and products sector maintains a surplus balance where exports are in most cases twice as high as imports. In the Textiles and Clothing sector, there is a surplus two-way trade flow in favor of Colombia with Germany, Brazil, Canada, Chile, Ecuador, the United States, Japan, Mexico, Venezuela, the United Kingdom, the Netherlands and Switzerland, and a deficit with Peru, China, Spain, India and Italy. Likewise, the behavior is similar in other economic sectors, where there is a trade balance in favor, against or balanced for Colombia. In any case, and for analyzing purposes, it is important to note that there are important two-way trade relationships with the different countries, with greater intra-industry participation with countries having similar relative endowments than with those whose relative endowments are different.
Upon considering Graphs 2 and 3, it is possible to deduce in general terms that the economic sectors of greatest relevance for international trade in Colombia presented two-way trade. Moreover, its main trading partners share similar economic structures, for example, in terms of the relative endowments of factors, characteristics of the countries and their international trade patterns, which allow studying intra-industry trade and adjustment costs.
4.2. Marginal intra-industry trade Index
The most commonly used index to liaison adjustment costs stemming from trade flows to intra-industry trade has been the Brülhart (1994) A index. The ranges defined by Durán and Álvarez (2008) for the Grubel and Lloyd index are proposed to interpret this index. So, therefore:
There is inter-industry trade if the index meets: A≤0,10
Potential for intra-industry trade if the index meets: 0,10<A≤0,33
Signs of intra-industry trade if the index meets: 0,33<A
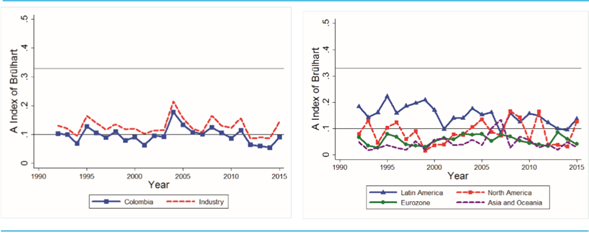
Graph 4 Panel A shows that index A for Colombia’s total calculated year by year, by periods, was in the range of potential, while the manufacturing industry, except for the occurrences of 2012, 2013 and 2014, was in the scenario of potential marginal intra-industry trade. As expected, Brülhart’s A index is higher for the industry than for the country as a whole, basically because two-way trade relations are higher at the industrial level than in economic sectors such as the primary and tertiary sectors, as shown in Graph 3.
Source: Authors’ own calculations with data from DANE-DIAN (2016).
Graph 4 Marginal Intra-Industry Trade for Colombia (1991-2015)
Notwithstanding, the level of index A for the industry remains at a constant level throughout the period, at around 13%. This fact is important for adjustment costs in the industrial sectors, which implies that for Colombian industry, increases in exports and imports of the same industrial category have allowed the adjustment pressures on the productive factors to be lower. Even so, there is ample room for improvement in marginal intra-industry relations and thus in controlling lower adjustment costs.
Likewise, when controlling the marginal intra-industry trade between Colombia and the defined commercial regions, Graph 4 Panel B shows that Latin America is the region that presented the greatest increases in trade flow, which is favorable for production factors such as employment and the use of capital in terms of induced adjustments. As has been said thus far, Latin America is the region with which Colombia shares similar relative endowments and is also the second with whom the country has greater trade relations (Annex 1), whereby opportunities for generating two-way trade with lower adjustment costs are much greater than with other trade regions.
On the other hand, Table 1 shows the Brülhart A indexes for the economic sectors. The index calculations show that the economic sectors with the highest rates of marginal intra-industry trade and therefore the lowest adjustment costs are chemical substances and products, Metal products, Textiles and clothing, Plastic and rubber products, Wood products and their derivatives. These economic sectors represent 28% of Colombia’s exports and 42% of its total imports.
Table 1 Marginal Intra-Industry Trade per economic sector (1991-2015) Figures in %
| Economic sector | 1992 | 1993 | 1994 | 1995 | 1996 | 1997 | 1998 | 1999 | 2000 | 2001 | 2002 | 2003 | 2004 | 2005 | 2006 | 2007 | 2008 | 2009 | 2010 | 2011 | 2012 | 2013 | 2014 | 2015 |
|---|---|---|---|---|---|---|---|---|---|---|---|---|---|---|---|---|---|---|---|---|---|---|---|---|
| Animals and derivatives | 9.7 | 3.2 | 3.9 | 5.6 | 2.4 | 3.7 | 0.9 | 2.5 | 2.0 | 3.7 | 3.1 | 8.7 | 9.4 | 2.6 | 9.5 | 1.3 | 3.8 | 1.4 | 10.3 | 5.6 | 5.9 | 3.8 | 10.9 | 6.5 |
| Plant products | 3.3 | 3.6 | 2.1 | 4.8 | 5.0 | 3.4 | 3.7 | 2.4 | 6.5 | 4.0 | 5.2 | 3.9 | 3.5 | 3.1 | 3.6 | 4.5 | 7.4 | 2.3 | 6.0 | 6.1 | 2.9 | 4.3 | 4.3 | 10.5 |
| Foodstuffs | 7.8 | 7.9 | 6.8 | 16.2 | 14.3 | 5.9 | 6.8 | 6.3 | 8.0 | 4.7 | 10.6 | 12.6 | 3.7 | 6.3 | 6.0 | 5.5 | 5.3 | 6.3 | 13.1 | 7.2 | 10.2 | 6.2 | 12.3 | 9.9 |
| Mineral products | 1.4 | 0.2 | 0.2 | 0.0 | 0.1 | 0.5 | 3.6 | 0.1 | 0.1 | 0.0 | 0.4 | 1.2 | 4.4 | 15.1 | 13.9 | 19.2 | 1.9 | 19.4 | 0.0 | 0.0 | 0.1 | 0.1 | 0.2 | 0.0 |
| Chemical products | 24.0 | 14.1 | 16.7 | 20.0 | 22.4 | 14.0 | 21.8 | 13.3 | 9.1 | 12.0 | 12.5 | 16.8 | 22.3 | 33.3 | 8.1 | 11.8 | 30.3 | 20.1 | 19.2 | 36.6 | 10.7 | 11.0 | 8.8 | 21.2 |
| Plastic and rubber | 17.9 | 22.8 | 18.9 | 28.3 | 19.2 | 22.7 | 26.2 | 21.4 | 52.1 | 13.6 | 20.5 | 19.1 | 35.2 | 34.3 | 28.3 | 16.8 | 29.3 | 30.0 | 25.7 | 32.7 | 13.6 | 16.2 | 13.8 | 19.8 |
| Furs and leathers | 2.8 | 5.0 | 8.6 | 10.4 | 3.5 | 6.1 | 9.8 | 17.0 | 7.9 | 6.0 | 4.2 | 19.8 | 12.4 | 5.2 | 12.0 | 3.3 | 2.0 | 3.1 | 7.3 | 9.6 | 7.7 | 20.9 | 8.2 | 9.0 |
| Wood and derivatives | 18.2 | 19.7 | 10.7 | 26.4 | 11.4 | 18.5 | 15.1 | 13.9 | 10.4 | 10.2 | 13.4 | 19.5 | 15.7 | 21.7 | 12.2 | 9.8 | 14.6 | 14.6 | 8.7 | 13.9 | 18.6 | 6.0 | 13.1 | 11.9 |
| Textiles | 12.7 | 16.4 | 21.9 | 19.9 | 12.1 | 15.8 | 24.3 | 18.1 | 9.8 | 18.2 | 11.2 | 9.3 | 11.9 | 7.9 | 10.9 | 3.6 | 6.1 | 5.4 | 10.7 | 10.2 | 8.7 | 14.4 | 8.9 | 15.1 |
| Shoes and accessories | 8.2 | 9.4 | 9.0 | 5.6 | 15.4 | 6.2 | 12.7 | 5.2 | 10.1 | 17.2 | 15.2 | 13.5 | 18.5 | 7.3 | 3.3 | 4.6 | 2.4 | 2.6 | 2.8 | 6.2 | 3.0 | 9.2 | 3.6 | 19.2 |
| Stones and glass | 7.6 | 4.8 | 3.6 | 5.4 | 3.4 | 8.4 | 8.2 | 16.3 | 14.9 | 8.9 | 3.4 | 5.0 | 10.5 | 6.2 | 4.0 | 4.5 | 3.6 | 3.4 | 6.6 | 4.4 | 2.4 | 1.9 | 5.1 | 6.8 |
| Metals | 10.8 | 8.4 | 9.0 | 16.7 | 14.3 | 10.7 | 9.4 | 8.6 | 23.3 | 18.4 | 12.9 | 16.7 | 18.7 | 19.4 | 21.2 | 28.9 | 9.1 | 21.4 | 15.9 | 6.6 | 7.9 | 14.3 | 10.4 | 19.5 |
| Machinery and electrics | 8.1 | 6.1 | 3.6 | 15.5 | 11.9 | 8.8 | 2.5 | 4.2 | 7.5 | 9.2 | 7.8 | 6.2 | 17.0 | 4.2 | 6.3 | 5.4 | 6.7 | 4.5 | 3.4 | 6.0 | 3.4 | 4.2 | 5.8 | 5.4 |
| Transportation | 8.6 | 13.3 | 5.2 | 4.2 | 8.6 | 10.8 | 21.1 | 18.6 | 4.3 | 2.6 | 9.9 | 2.1 | 28.2 | 8.3 | 15.6 | 1.4 | 17.2 | 6.2 | 4.5 | 1.3 | 6.0 | 4.3 | 2.9 | 4.9 |
| Miscellaneous | 9.4 | 10.8 | 4.9 | 19.5 | 11.1 | 3.8 | 4.0 | 3.3 | 5.6 | 4.2 | 5.3 | 6.4 | 39.9 | 10.5 | 8.0 | 7.0 | 5.0 | 11.0 | 6.9 | 6.7 | 7.1 | 5.6 | 5.5 | 7.0 |
Source: Authors’ own calculations with data from DANE-DIAN.
Furthermore, the aforementioned economic sectors are of great importance for the generation of employment and production in Colombia’s total manufacturing industry. These sectors generate 50% of total industrial production, with 24% of chemicals, 8% of textiles and clothing and 7.5% of Wood products and their derivatives. Regarding employment, the economic sectors with the greatest marginal intra-industry trade generate 53% of total employment, wherein the most labor-intensive industries are textiles and clothing with 20%, chemical substances and products 11% and 8.5% wood products and their derivatives4.
The chemical substances and products, Textiles and Clothing, Wood products and their derivatives economic sectors, in addition to having the largest shares in production and employment generation for the Colombian industry, also hold marginal intra-industry trade relationships. In fact, their exports and imports trade relationships occupy important positions with the countries where Colombia has the largest trade flows such as the United States, China, Ecuador, Chile, Brazil and Mexico.
Table 2 Trade Adjustment Index for Colombia, trade regions and economic sectors (1991-2015)
| Economic sector | 1992 | 1993 | 1994 | 1995 | 1996 | 1997 | 1998 | 1999 | 2000 | 2001 | 2002 | 2003 | 2004 | 2005 | 2006 | 2007 | 2008 | 2009 | 2010 | 2011 | 2012 | 2013 | 2014 | 2015 |
|---|---|---|---|---|---|---|---|---|---|---|---|---|---|---|---|---|---|---|---|---|---|---|---|---|
| Animals and derivatives | -0.63 | -0.75 | -0.50 | 0.80 | -0.69 | 0.89 | 0.52 | -0.41 | -0.14 | 0.36 | -0.43 | -0.50 | 0.51 | 0.22 | 0.53 | -0.41 | -0.55 | -0.49 | -0.58 | 0.51 | 0.50 | -0.51 | -0.51 | -0.68 |
| Plant products | -0.70 | -0.58 | 0.37 | -0.41 | -0.80 | 0.53 | -0.49 | -0.25 | -0.58 | -0.46 | 0.04 | 0.00 | 0.24 | 0.52 | -0.32 | 0.14 | -0.21 | -0.09 | 0.08 | 0.06 | -0.70 | 0.17 | 0.51 | 0.76 |
| Foodstuffs | 0.21 | -0.76 | 0.44 | -0.81 | -0.71 | -0.10 | 0.35 | 0.12 | 0.50 | 0.08 | -0.24 | 0.84 | 0.41 | 0.28 | 0.04 | 0.21 | 0.31 | 0.12 | -0.65 | -0.06 | -0.36 | 0.27 | -0.29 | -0.42 |
| Mineral products | -0.68 | -0.53 | -0.31 | 0.50 | 0.49 | -0.47 | -0.51 | 0.50 | 0.48 | -0.50 | -0.36 | 0.45 | 0.49 | 0.48 | 0.46 | 0.44 | 0.51 | -0.18 | 0.50 | 0.50 | 0.50 | 0.81 | -0.50 | -0.50 |
| Chemica products | -0.51 | -0.42 | -0.28 | -0.28 | 0.63 | -0.39 | 0.19 | 0.88 | 0.10 | -0.19 | -0.96 | -0.36 | 0.05 | -0.15 | -0.24 | -0.25 | -0.10 | 0.07 | -0.15 | -0.18 | -0.46 | -0.55 | -0.97 | 0.19 |
| Plastic and rubber | -0.25 | -0.35 | -0.35 | -0.11 | -0.42 | -0.27 | 0.23 | 0.50 | -0.02 | 0.28 | 0.35 | 0.33 | -0.02 | -0.20 | -0.21 | -0.14 | -0.29 | -0.21 | -0.46 | -0.37 | -0.54 | -0.57 | -0.74 | 0.39 |
| Furs and leathers | -0.54 | 0.42 | -0.64 | -0.98 | -0.50 | 0.21 | 0.58 | -0.26 | 0.31 | 0.17 | 0.39 | 0.92 | 0.35 | -0.67 | 0.27 | 0.43 | 0.45 | -0.48 | -0.30 | -0.19 | -0.56 | -0.41 | 0.45 | -0.12 |
| Wood and derivatives | -0.43 | -0.37 | -0.43 | -0.31 | 0.23 | -0.33 | 0.93 | 0.45 | 0.10 | 0.65 | -0.85 | 0.17 | 0.15 | -0.17 | -0.27 | 0.15 | -0.19 | 0.19 | -0.73 | -0.17 | -0.73 | -0.61 | -1.00 | 0.14 |
| Textiles and clothing | -0.85 | 0.01 | -0.47 | 0.11 | -0.40 | -0.67 | -0.92 | 0.22 | 0.00 | 0.62 | -0.42 | 0.44 | 0.30 | 0.08 | -0.14 | 0.33 | 0.15 | -0.40 | -0.76 | -0.44 | -0.44 | -0.23 | -0.83 | 0.38 |
| Shoes and accessories | -0.73 | -0.95 | -0.65 | -0.91 | -0.45 | -0.85 | -0.42 | -0.82 | -0.36 | -0.33 | -0.03 | -0.22 | -0.13 | -0.26 | -0.37 | 0.34 | 0.20 | -0.53 | -0.96 | -0.48 | -0.50 | 0.49 | -0.01 | 0.47 |
| Stones and glass | -0.24 | 0.44 | 0.18 | 0.45 | -0.45 | -0.62 | -0.31 | 0.78 | -0.36 | 0.35 | 0.38 | 0.53 | 0.12 | 0.27 | 0.39 | 0.17 | 0.39 | 0.58 | 0.41 | 0.40 | 0.44 | -0.52 | -0.57 | -0.50 |
| Metals | -0.56 | -0.58 | 0.36 | -0.30 | 0.40 | -0.42 | 0.22 | 0.55 | -0.26 | 0.90 | 0.37 | 0.00 | 0.03 | -0.20 | 0.10 | -0.05 | -0.98 | 0.27 | -0.24 | -0.55 | 0.57 | 0.08 | -0.69 | 0.32 |
| Machinery and electrics | -0.44 | -0.49 | -0.54 | -0.39 | -0.23 | -0.67 | 0.55 | 0.49 | 0.66 | -0.38 | 0.43 | -0.51 | -0.17 | -0.55 | -0.44 | -0.42 | -0.43 | 0.47 | -0.61 | -0.48 | -0.45 | -0.34 | -0.51 | 0.48 |
| Transportation | -0.47 | -0.46 | -0.63 | 0.86 | 0.51 | -0.59 | 0.46 | 0.44 | 0.33 | -0.32 | -0.91 | -0.66 | 0.29 | -0.69 | -0.44 | -0.32 | -0.85 | -0.66 | -0.36 | -0.45 | 0.41 | -0.13 | -0.68 | 0.49 |
| Miscellaneous | -0.88 | -0.42 | -0.81 | 0.25 | -0.11 | -0.72 | -0.41 | 0.49 | -0.35 | -0.37 | -0.53 | 0.53 | -0.08 | -0.62 | -0.43 | -0.38 | -0.47 | 0.33 | -0.57 | -0.46 | -0.49 | -0.43 | -0.55 | 0.49 |
| Regions | 1992 | 1993 | 1994 | 1995 | 1996 | 1997 | 1998 | 1999 | 2000 | 2001 | 2002 | 2003 | 2004 | 2005 | 2006 | 2007 | 2008 | 2009 | 2010 | 2011 | 2012 | 2013 | 2014 | 2015 |
| Latin America | -0.38 | -0.39 | -0.44 | 0.21 | 0.21 | -0.23 | 0.42 | 0.29 | 0.26 | 0.51 | -0.84 | -0.81 | 0.26 | -0.13 | -0.36 | 0.25 | 0.43 | -0.23 | -0.39 | 0.06 | 0.12 | 0.36 | -0.31 | -0.07 |
| North America | -0.53 | -0.34 | -0.34 | -0.07 | 0.41 | -0.57 | 0.32 | 0.79 | 0.53 | -0.62 | 0.32 | 0.41 | 0.10 | 0.22 | 0.07 | -0.28 | 0.12 | 0.19 | 0.37 | 0.18 | -0.41 | -0.77 | -0.73 | -0.18 |
| Eurozone | -0.63 | -0.66 | 0.28 | -0.33 | -0.76 | -0.38 | -0.74 | 0.20 | -0.41 | -0.73 | 0.54 | -0.12 | 0.34 | -0.14 | -0.04 | 0.25 | -0.44 | -0.35 | 0.10 | 0.23 | 0.99 | -0.35 | -0.37 | -0.42 |
| Asia and Oceania | -0.62 | -0.42 | -0.24 | -0.13 | 0.27 | -0.39 | -0.60 | 0.50 | -0.48 | -0.70 | -0.37 | -0.28 | -0.32 | -0.37 | -0.37 | -0.38 | -0.41 | 0.60 | -0.12 | -0.48 | 0.17 | 0.34 | -0.30 | -0.27 |
| Total | 1992 | 1993 | 1994 | 1995 | 1996 | 1997 | 1998 | 1999 | 2000 | 2001 | 2002 | 2003 | 2004 | 2005 | 2006 | 2007 | 2008 | 2009 | 2010 | 2011 | 2012 | 2013 | 2014 | 2015 |
| Colombia | -0.56 | -0.45 | -0.21 | 0.06 | 0.64 | -0.41 | -0.06 | 0.60 | 0.17 | -0.91 | -0.36 | 0.01 | 0.21 | -0.08 | -0.16 | -0.05 | 0.09 | 0.10 | -0.01 | 0.10 | -0.03 | -0.87 | -0.95 | -0.25 |
Source: Authors’ own calculations with data from DANE-DIAN.
4.3. Adjustment cost index
Azhar and Elliott’s (2003) TAI in Table 2 supplement this. For example, for the Plastic and Rubber Products sector, 75% of the time the TAI was in the lowest adjustment costs range, at 67% for the Chemical Substances and products sector, 63% for Metal Fabricated Products, for the Food sector and its products related to agro-industrial processes it was 63%, for the Wood and Wood Products sector 58%, and 50% for the Stone, glass, ceramics, glass and derivatives sector. In general terms, it is possible to say that these are the industrial sectors with the greatest potential to increase their two-way trade flow (Graph 3) in the presence of lower adjustment costs.
When analyzing adjustment costs by region according to the TAI, Table 3 shows that 75% of the time the index was in the range of lowest adjustment costs between Colombia and Latin America. With respect to Colombia’s total bi-directional flow, 67% of the time, the TAI was in the range of lowest adjustment costs due to increases in intra-industry trade. Overall and descriptively, it is possible to say that based on the TAI and the A index, the Colombian industry fulfills the Smooth Adjustment Hypothesis (SAH), where the Latin American region plays an important role, with the presence of countries with similar relative endowments and high trade flows (Annex 1).
In turn, IACS’s Graph 5 Panel A for Colombia shows that most of the point cloud is located in the first quadrant and around the 45° line. This indicates that adjustment costs have been lower in the 1991-2015 period, due to a simultaneous increase in exports and imports. On the other hand, for the years 1999 and 2014 -visibly shown in Panel A, where there is an inverse trade flow, namely, growth of exports and decrease in imports- there are adjustment pressures on the relocation of production factors, mainly of employment, which is the quickest short-term variable to relocate (Blanes, 2002; Greenaway, Haynes and Milner, 2002). The TAI in Table 2 confirms that Colombia suffered greater pressures in 1999 and 2014, as the index is equal to 0.60 and -0.95, respectively, values outside the -0.4 and 0.4 range where adjustment costs are lower due to intra-industry trade relationships.
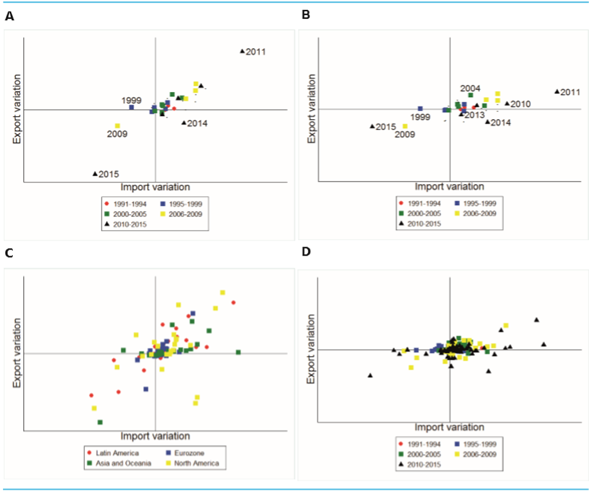
Source: Authors’ own calculations with data from DANE-DIAN.
Graph 5 International Adjustment Cost Space -IACS - (1991-2015)
Regarding the total of the manufacturing industry and the industrial economic sectors, Graph 5, Panels B and D, allows inferring that the commercial flow of simultaneous exports and imports generates lower costs. It is possible to observe that most points are located around the 45° line and in the first or third quadrant.
On the other hand, Panel C from Graph 5, shows that the Latin American region is the one located in the first or third quadrant and around the main diagonal, thereby corroborating what has been said so far: the increases in industrial exports and imports with this region generate fewer adjustment pressures on production factors than the other trade regions such as North America, the Eurozone, Asia and Oceania.
5. Conclusions
In Colombia, there is little research on marginal intra-industry trade and international trade-induced adjustment costs. There is one of national nature such as that of Posada et al. (2005) and three at the regional level, namely: Muñoz and Salinas (2008), Acevedo and Pinto (2011) and Hernández and Raffo (2016). Given the importance of an increasingly globalized world and its effects on national factors of production, it is important to continue this line of research.
On the other hand, the descriptive data on the economic sectors of Colombia allow us to conclude that there are two-way trade relationships, that is, there is both exports and imports per sector, making up the presence of intra-industry trade. Moreover, given the calculations of Brülhart (1994) A index at the sectoral level, especially for manufacturing, it can be said that there is a marginal intra-industry trade.
No less important is to show that Colombia trades goods with countries that share similar economic structures, in terms of relative factor endowments (Annex 1). This is how for the period under study (1991-2015), the Latin American region has remained an important destination for Colombian exports and as a source for imports as well, to the point that within the top 12 partner countries, 6 of them are Latin American countries, namely: Ecuador, Brazil, Peru, Venezuela, Mexico and Chile. On the other hand, when measuring the marginal intra-industry trade, the region with which Colombia presented the best balance for this type of trading relations was precisely Latin America. Our analysis point out that this is the region with the greatest potential to harness economies of scale, product differentiation and, at the same time, derive lower adjustment costs in terms of reallocation of productive factors.
With respect to the analysis by industry, the economic sectors of Chemical substances and products, Plastic and rubber products, Metal fabricated products, Wood products and their derivatives, Textiles and clothing, presented potential for marginal intra-industry trade, in addition to having significant shares in the generation of production and employment for the Colombian industry. Notwithstanding, there is still considerable scope for further deepening into intra-industry relations. Furthermore, the trade relationships of exports and imports of these economic sectors occupy important positions with the countries with which Colombia carries its largets trade flows, such as: the United States, China, Ecuador, Chile, Brazil and Mexico.
Taking into account the adjustment costs measured by Brülhart’s (1994) index A, the economic sectors with the greatest potential for lower transaction costs are: Chemical substances and products, Plastic and rubber products, Metal products, Textiles and clothing, Wood products and their derivatives. Of these sectors, Chemical substances and products and Textiles and clothing hold the best participation in the generation of employment and added value within the total manufacturing industry, in addition to being products commercialized with the country’s main commercial partners. These results are important in terms of economic policies, since they reinforce the idea that productive bets should continue to focus on world-class economic sectors, that generate forward and backward productive linkages.
With regard to Balassa’s (1966) Smooth Adjustment Hypothesis for the Colombian industry in the 1991-2015 period, according to the Brülhart A index, the TAI and the IACS by Azhar and Elliott (2003), it can be said descriptively that there is evidence in favor of this hypothesis. Therefore, the Colombian industry fulfills that increases in intra-industry trade relationships lead to lower adjustment costs; in other words, to fewer reallocations of production factors in the face of two-way trade pressures for the same industrial category. The fact that several of Colombia’s trading partners share similar relative factor endowments plays an important role in this, as mentioned above. This means that in these cases, it is not comparative advantages explaining the presence of trade but other factors such as technological complementarities, productive diversification and economies of scale, factors generally linked to the presence of virtuous circles that mark sustained long-term economic growth.