


 English (pdf)
 Article in xml format
 Article references
 Send this article by e-mail
 Cited by SciELO
  Cited by Google
  Similars in
SciELO
Similars in
SciELO  Similars in Google
 Permalink
1. Introduction
At the end of each fiscal period in Colombia, and once the figures showing the results in profits of the bank are known, the benefits of the banking business and its profitability are perceived, even during periods or stages of crisis such as those that have been occurred during the last decade in particular. This is surprising; during times of crisis, the financial intermedation business would be expected to reduce its margins as a result of loan portfolio deterioration.
These profits can come from the fact that in their desire to establish themselves as solid, prosperous and above all profitable companies, financial institutions have adhered to their main role of financial intermediation the administration of huge portfolios of their own or their clients through trading. Portfolio management allows banks to provide comprehensive attention to their clients, and leads them to participate in business such as the stock market, providing for this purpose, according to the interests of shareholders, commercial forces focused on the sale of risky assets to clients who fully trust their leading banker to manage their investments.
This situation is a consequence of the multi-banking scheme, this concept understood as “banking services under one roof”, which originated in the reforms to the Financial Statute, through Act 510 of 1999 (Clavijo, 2000). This scheme has led the essence of the banking business to have additions and variations, enabling banks to operate as large treasuries, with an enormous bargaining capacity obtained by controlling the resources collected from the general public. This public generally does not have high-risk profiles in managing their money and only want to keep their savings in trustworthy entities with good financial support.
This paper aims to explore, for the case of colombian banks, trade-off between intermediation and treasury or trading operations, laying out their effects on solvency behavior and profitability. For this purpose, a theoretical and conceptual review on banking activity has been made, the diversification of its revenues and its possible connections with solvency and profitability. Taking data from the Financial Superintendency for 13 banks between 2005 and 2014, a panel data model is proposed to study these relations, an analysis thereof is conducted and the conclusions are presented at the end.
2. Theoretical framework
Financial intermediation in Colombia is an industry subject to strict regulation, as confirmed by concept No. 2000048692-1 of June 30, 2000, issued by the then Banking Superintendence11, now Financial Superintendency, which emphasizes non-liberality to create or manage companies that pursue this practice, explaining that “Financial intermediation is an exclusive activity of the entities supervised by this Agency, the former being understood as the professional acquisition of resources from the public through passive operations or the receipt of funds in order to invest them, also in a massive way through active operations or the granting of credits (loans), a procedure that by its nature requires prior administrative authorization.”
Thus, financial intermediation consists of collecting resources in any form and its subsequent placement through loans or credits and investments. This activity involves two factors implicit in the actions of capturing and placing: term and interest rate. Financial intermediation raises funds from the public at an agreed term and interest rate and places them to the public at a different rate and term, thereby performing risk diversification. The difference between the two actions makes it possible to generate the intermediation margin.
In order for the practice of intermediation to occur, there must be two types of agents on the market, surplus agents and deficit agents. Surplus agents are those who have excess resources and seek to invest them in search of the best profitability, avoiding the idleness of the same. While deficit agents are those who, on the contrary, lack resources to fund their operations and require funds for financing.
In addition to financial intermediation, banks can also engage in securities intermediation, which aims to bring together petitioners and bidders in securities trading systems or in the Over-the-counter market, either on their own account or some else’s (BVC, 2014).
Banking establishments, financial corporations and stock market brokerage agents may, when they acquire the status of market makers, place colombian Treasury Gills (or TES by their acronym in Spanish) issued by the Estate by guaranteeing the placement of all or part of these issues.
An entity is a market maker when, in order to reduce volatility and provide liquidity to it, conducts transactions on its own in which it undertakes to sell or buy at a certain price, guaranteeing investors the subsequent purchase or sale at that value.
2.1. Bank solvency
Financial institutions are governed by regulations that compel them to have a certain solvency index; this term is understood as the ability to face their obligations in possible events of enforceability, contributing their assets to this end, that is, that is, that the latter is able to cover the debts of the entity when required.
This means that the more solid an entity is, the more capitalized will be, which in turn guarantees the stability of the economy, and makes it dependent on the standing of credit institutions.
Banks must maintain high solvency rates not only to meet the requirements of supervisors, in the colombian case the Financial Superintendence, but also to avoid the costs brought by the actions of these supervisors when their solvency levels are approaching or fall below the regulatory minimum (Marcus, 1984).
Moreover, due to market disciplines, banks can maintain surplus capital in order to send a signal of solidity to markets and meet the expectations of rating agencies (Jackson, Furfine, Jones, Perraudin, Radecki, and Yoneyama 1999; Shim, 2013).
These solvency requirements have become more important with the implementation of Basel III in order to strengthen the financial stability of banking systems (Shim, 2013).
Allen and Saunders (2003) state that periods of recession undermine the quality of risk and thus increases the likelihood of bankruptcy. With the new capital requirements, anti-cyclical buffers should lead, in principle, to finding that banks keep their solvency levels since buffers would allow to absorb losses due to the portfolio deterioration, which would not at least theoretically restrict credit activities (Shim, 2013). Understanding, in this case, the solvency buffer as the difference between the total solvency of each bank and the minimum solvency required by regulators (Jokipii and Milne, 2008).
In the colombian case, the solvency index is defined as the value of technical reserves, divided by the value of weighted assets plus market risk. Technical reserves, in turn, corresponds to the sum of the core reserves plus the additional reserves. The additional reserves can only add up to 100% of the basic reserves. It contemplates that if the Basic Reserves is greater than the Additional Reserves, the Technical Reserve is equal to 2 times the Basic Reserve.
The Financial Superintendence provides two ways to measure solvency, the basic solvency ratio and the total solvency ratio.
The basic solvency ratio is calculated by taking the value of Ordinary Core Equity divided by the value of the assets weighted by credit and market risk level.
While the total solvency ratio is calculated using:
This ratio cannot be less than nine percent (9%).
Where:
TE = Technical Equity
RWA = Risk Weighted Assets
VaR = Value at Risk
2.2. Profitability
Vinh and Phuong Mai (2016) claim that adopting an income diversification strategy leads to an increase in bank earnings.
Some of the determining variables in the profitability of banks are the size, the extent to which the bank is diversified, the attitude towards risk, the characteristics of the bank’s ownership and the level of competition (Goddard, Molyneux, and Wilson, 2004). A study by Goddard et al. (2004) in European banks, identified a significant relationship between size and profitability, but the evidence of a systematic relationship is not convincing.
Smith, Staikouras, and Wood (2003), Gurbuz, Yanik, and Ayturk (2013), Niu (2012) and Sanya and Wolfe (2011) have studied the impact of banking risk diversification and profitability.
In the case of Smith et al. (2003) notes that a greater concentration on the generation of interest-free income contributes to the stabilization of bank profitability.
The work of Vinh and Phuong Mai (2016) found that commercial banks that diversify their income obtain higher returns; however, taking into account bank risk would result in a lower return rate.
On the other hand, Dietrich and Wanzenried (2014) sustain that “bank profitability is measured by average asset return, equity return and net interest margin, and is expressed in terms of internal and external determinants” (p.338). In this sense, the internal determinants of profitability include size, operational efficiency, and capital index and ownership structure. External determinants constitute the environmental variables that affect the performance of institutions.
2.3. Diversification of banking income
In Colombia, as in the United States and Europe, banks have expanded their spectrum of activities from traditional intermediation to a set of financial services including commission revenue, trading revenue, and other non-interest-related rate income (Shim, 2013). Diversification is a strategy to increase bank revenues that has been the subject of multiple studies (DeYoung, and Roland, 2001; Stiroh, 2004).
In fact, banks find in this strategy the possibility of exploiting economies of scale thanks to the opportunity of diving deeper into a customer by offering new services, in addition to reducing their capital requirements to the extent that these services do not depend on the interest rate (Shim, 2013). However, profits collected at the level of each bank may increase systemic risk (Shaffer, 1985; Slijkerman, Schoenmaker, and de Vries, 2013).
Despite the benefits associated with diversification, some authors argue that diversification can lead to inefficiency on account of cross-subsidies between the different market segments served, due to agency problems that allow targeting the resources of poor segments to feed the segments that work better (Berger and Ofek, 1995). This practice may result in the company value loss at an individual level (Shim, 2013). While other authors argue that although diversification increases exposure to the volatility of new activities, the benefits of diversification are greater than that increase (Stiroh and Rumble, 2006).
2.4. The relationship between solvency and diversification of bank income
A study conducted by Shim (2013) shows evidence that income diversification can bring benefits to banks since it found that the insolvency risk probability decreases as income is more diversified because there is less profit volatility. In addition, banks may be able to obtain capital savings by reducing portfolio risks through income diversification. On the other hand, it was found that increasing the share of income not associated with interest rates can reduce solvency requirements. Key bank indicators such as size, profitability, liquidity, portfolio provisions and active growth, may mediate this ratio.
Taking into account the standpoint of the aforementioned authors, it is possible to infer that the risk of loss due to the high volatility of new activities such as trading does not exceed the expectation of marginal profits that these activities bring about.
In other words, the profit is always greater than the risk of loss due to high volatility and impairment of the individual value of the company.
3. Methodology
To perform the analysis, a database of colombian banks was built with the information reported to the Financial Superintendence. Balance sheets and income statements were used to determine the composition of assets and the provenance of income. In addition to detailed information on the indicators of solvency and quality of the portfolio, reported by the same superintendence. To maximize the number of observations, monthly information between 2005 and 2014 was taken. All the banks that did not endure during the entire analysis period, due to liquidations or acquisitions, or that did not report any data were removed from the sample. Table 1 describes the revised income statement accounts.
Table 1 Book account of income and expenses in trading
| 410200 | Interest and discounts amortization credit portfolio |
| 410400 | Returns on repo operations, simultaneous |
| 410700 | Profit in valuation investments traded in debt securities |
| 410800 | Revenue valuation investments traded in equity securities |
| 410900 | Revenue valuation investments available for sale debt securities |
| 411100 | Utility valuation investments to keep up to maturity |
| 411200 | Carousel value profit |
| 412300 | Profit in short trading positions |
| 412500 | Profit on sale of investments |
| 412800 | Profit in the valuation of spot transactions |
| 412900 | Profit in the valuation of derivatives |
| 413500 | Currency |
| 510400 | Returns on repo operations, simultaneous |
| 510600 | Loss valuation investments trading debt securities |
| 510800 | Loss valuation investments negotiation titles participation |
| 510900 | Loss valuation investments available for sale debt securities |
| 511000 | Readjustment real value unit uvr |
| 511100 | Loss valuation investments to keep up to maturity |
| 511200 | Loss carrousel rating |
| 512300 | Loss in short trading positions |
| 512800 | Loss value spot transactions |
| 512900 | Loss in the valuation of derivatives |
| 513500 | Currency |
| 513700 | Loss in the sale of derivatives - Negotiation |
| 513800 | Loss in the sale of derivatives - for hedging |
| 513900 | Loss in the valuation of derivatives |
Source: Authors’ own elaboration.
3.1. Explained variables and explanatory variables
3.1.1. Explained Variables
ROE (Return On Equity). It allows to measure the profitability of a company against the capital invested by shareholders, that is, it tries to measure the company’s ability to remunerate its shareholders.
It is given by the expression:
ROE = Net profit (after tax) / Own capital
Solvency Buffer. Normally, banks hold more capital than the required regulatory minimum to reduce their likelihood of bankruptcy. The regulatory solvency ratio is the relation between the amount of capital needed to be considered as a viable going concern by creditors and counterparties, while the solvency buffer represent the additional amount of capital that banks retain in excess of the regulatory solvency ratio requirement to resist a stressful period. Similar to Jokipii and Milne (2008), we define bank’s solvency buffer as the difference between the actual solvency ratio and the minimum regulatory solvency ratio of 9%.
3.1.2. Explanatory variables
Diversification of income. Income diversification is associated with changes in risk level and solvency buffer (Shim, 2013), and given the characteristics of the information collected, these revenues can be divided into two broad categories: trading income and intermediation income.
Following the proposal by Shim (2013) this income diversification will be measured using the complement of the Herfindahl Index (HHI), a concentration measure, which is calculated as the sum of the squares of the share of each of the banks’ operational income sources.
Like this:
Thus, banks with fewer sources of income are expected to have a lower value of income diversity, while banks with a wide range of income will have a higher value of diversity.
3.1.3. Control Variables
Cycle. To control the effect of the business cycle on the ROE’s behavior and risk, the actual growth of the Gross Domestic Product is included as an indicator of the same (Shim, 2013).
Size of the banks. The size of banks is included to capture their effect on ROE and risk. Larger banks are expected to have a larger ROE because of their diversification, while smaller banks must have a smaller ROE. And the total assets measure it.
Table 2 shows the variables defined for the study.
Table 2 Definition of the Variables
| Variable | Description |
|---|---|
| ROE | Return on equity |
| DIVERS | Diversification of income |
| SIZE | Natural logarithm of total assets |
| CYCLE | GDP growth rate |
| BUFFER | Solvency buffer |
Source: Authors’ own elaboration
Table 3 shows descriptive figures of the variables ROE, income diversification, size of banks and, finally, cycle (understood as real GDP growth).
Tabla 3 Descriptive statistics of the study variables in the panel
| Variable | Country | Mean | Std. Dev. | Min | Max | Observations | ||
|---|---|---|---|---|---|---|---|---|
| ROE | overall | 9,916579 | 7,051634 | -2,826845 | 4,386553 | N | = | 1559 |
| between | 3,029929 | 5,655036 | 1,784388 | n | = | 13 | ||
| within | 6,421892 | -3,612066 | 3,593823 | T-bar | = | 119.923 | ||
| Diversification | overall | 0.4164792 | 0.1897634 | 0 | 0.809177 | N | = | 1558 |
| between | 0.0411956 | 0.3446502 | 0.4960581 | n | = | 13 | ||
| within | 0.1855833 | -.0174501 | 0.8305563 | T-bar | = | 119.846 | ||
| lnSize | overall | 2,31931 | 0.8100895 | 1,960464 | 2,532786 | N | = | 1560 |
| between | 0.6080846 | 2,253062 | 2,431596 | n | = | 13 | ||
| within | 0.5609838 | 1,848181 | 2,575829 | T | = | 120 | ||
| GDP_trim | overall | 4,7375 | 1,936814 | 0.3 | 8,000000 | N | = | 1560 |
| between | 0,000000 | 4,737500 | 4,737500 | n | = | 13 | ||
| within | 1,936814 | 0.3 | 8,000000 | T | = | 120 | ||
Source: Authors’ own elaboration.
In the case of these variables, and in particular, for the banking institutions that were the subject of statistics, the following is observed:
ROE: Since the ROE indicator is defined as the profit (after tax) on the capital invested, it can be seen that, in the case of the sample, there are no entities that have difficulties in this regard, thus attesting to a strong banking sector in general.
Income Diversification (Divers): the sample analyzed indicates that banks, on average, have similar sources of income, and there is no significant distortion therein, considering that this variable is defined as 1 minus HHI (Herfindahl), where it is expected that the lower source of income the lower the value of the income diversification.
Size of banks: given the large values presented in this variable, the basis of which is the total assets of financial institutions, the natural logarithm of this figure is taken.
The statistics describe closely-related sizes between the financial institutions subject of the study, with an average of 18.94, with a minimum of 18.43 and a maximum of 19.48.
Cycle: is defined as real growth on GDP and seeks to establish the effect of the business cycle on the solvency of financial institutions. For this variable, the mean is far from the minimum and maximum ends, with an important standard deviation, from which it can be inferred that the business cycle affects some entities significantly, while the effect is less for the others, with a minimum close to zero.
The following models will be estimated:
Model 1
Model 2
Where:
ROE = Return On Equity
Diversification = Diversification of income
Size = Size of banks
Cycle = Economic growth cycle
Model 1 seeks to estimate the effects of income diversification on profitability and assumes that each independent variable has the same implications on the variation of the profitability of banks over time.
Β0 and β1 and β2 would be expected to be positive because, following Stiroh and Rumble (2006), income diversification has positive effects on profitability as well as size and cycle (Dietrich and Wanzenried, 2014).
Model 2 seeks to estimate the effects of income diversification on solvency and assumes that each independent variable has the same implications on the variation of the banks’ solvency.
Β0 would be expected to be negative and β1 positive and β2 positive (Shim, 2013).
4. Analysis of the behavior of trading and intermediation revenue
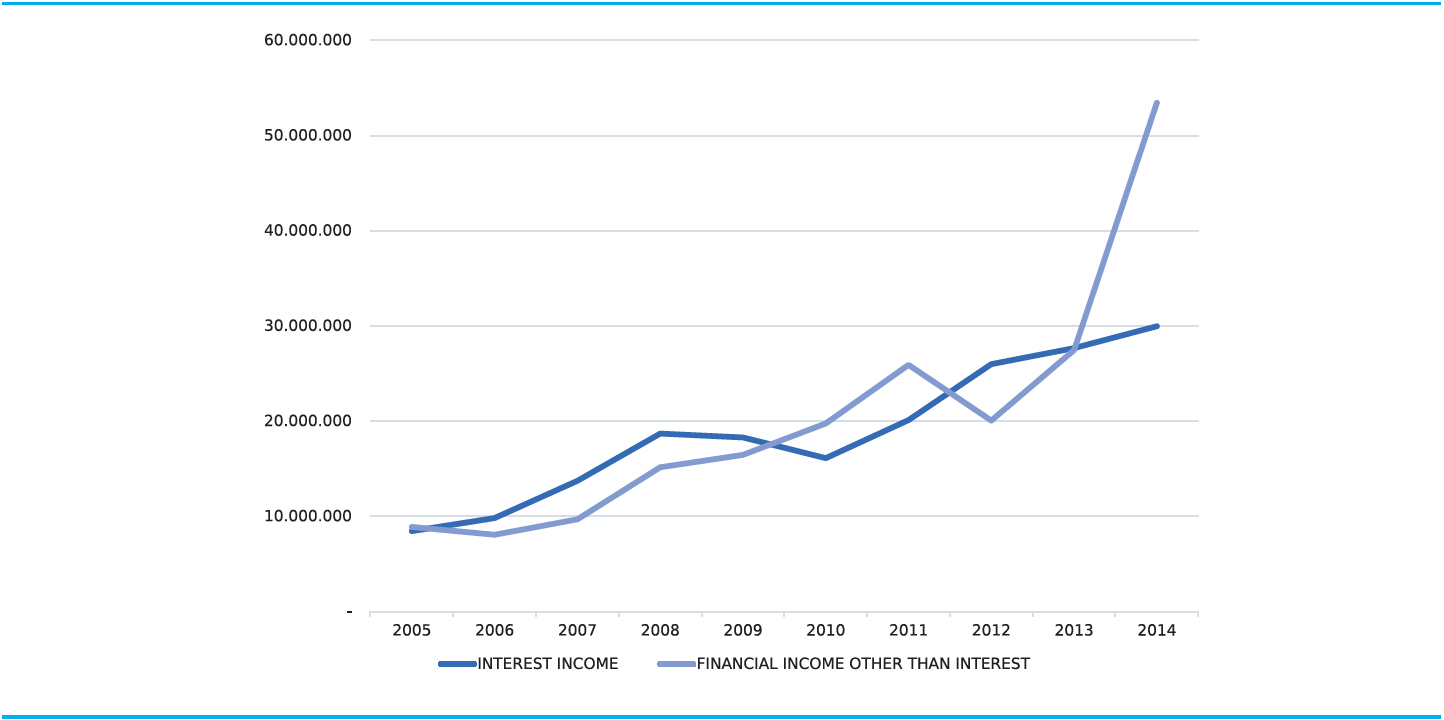
Figure 1 shows that while gross interest income has maintained an average increasing behavior of 16.3%, which led them from $8.4 trillion in 2005 to $30 trillion in 2014, gross trading income went from $8.9 trillion in 2005 to $53 trillion in 2014. These data allow us to infer that the main business of credit institutions has tended to change, complementing intermediation with a second source of income, especially since 2012, which, according to market rate conditions, can contribute significant marginal profits to the core business of intermediation, even more so since 2012, a period that begins to generate a difference in the gradient of the curve.
By plotting the final results of each year of the period, i.e. the profit or loss of the year for each period (Figure 2), it can be determined that the business of the credit institutions is leveraged by the income provided by the trading activity, income that is grouped under the item financial income different from interests and the margins yielded by it. It is observed that the net income of credit institutions increased from $2.9 trillion in 2005 to $7.9 trillion in 2014; included in the figure is the intermediation and trading margins in each period. These results are those reported by the entities to the Financial Superintendence and are understood as the annual conclusion of the management of each establishment included in the report.
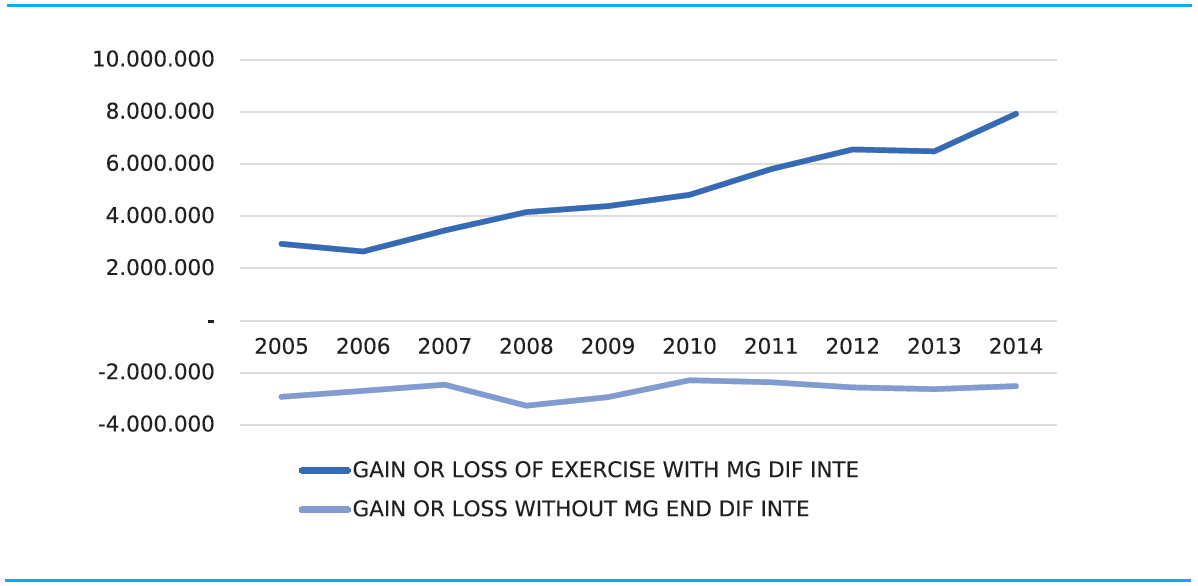
However, by tracking the results submitted to the withdrawal of the margin values generated by the trading activity, the performance of credit institutions shows a stable loss of - $2.9 trillion in 2005 and - $2.5 trillion in 2014 for the same periods. The analysis of this simulation leads to believing that financial intermediation as such, i.e., as a result of the placement and raising of resources, does not bear the cost burden of having a credit establishment and, therefore, they have seen the need to generate income from stock market-oriented activities rather than banking-oriented.
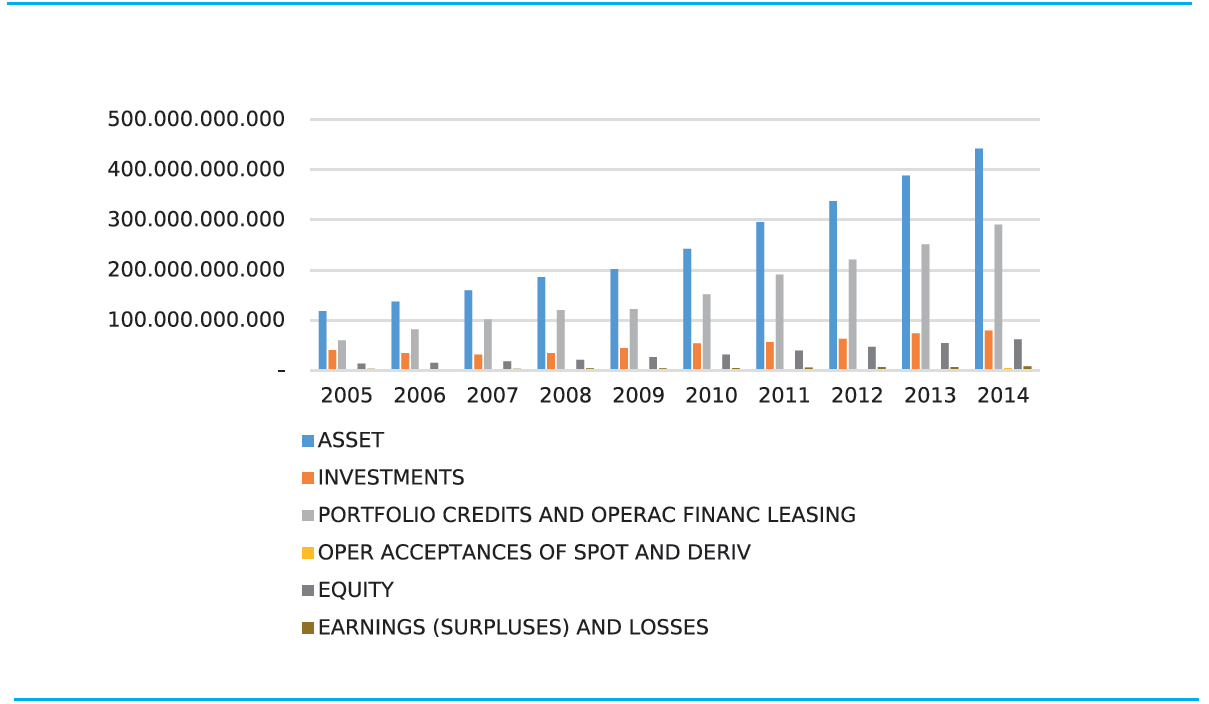
In the decade between 2005 and 2014, banking activity has shown a particular behavior in its core business, which could well indicate that the essence of its business, financial intermediation, has been the main objective of these entities (Figure 3). During this period, we see a steady growth of assets, leveraged mainly by credit portfolio accounts and financial leasing operations, which, at the end of each year, show symmetrical growth with the total assets of the sector. However, and despite this increase in the different accounts of assets, the performance results do not grow at the same pace, thus indicating that the cost structure has been affecting the margin of intermediation of credit institutions’ core business, generating the need to enter into businesses that provide revenue using the same cost structure already implemented within each entity.
4.1. Influence of diversification on solvency
To outline the influence of banks income diversification activities, we ran a panel data model. As can be seen in Table 4, the diversification variable has a negative effect on solvency; however, this is not significant. As for the performance of the economy, that is, the business cycle, it has a significant negative effect on the solvency buffer.
Tabla 4 Regression results with random effects panel data
| Wald chi2(3) = 44.96 | ||||||
| corr(u_i, X) = 0 (assumed) | Prob > chi2 = 0.0000 | |||||
| BUFFER | Coefficient | Standard Error | z | P>|z| | [95% Con f, Interval] | |
| Diversification | -0,4607777 | 0,305518 | -1,51 | 0,132 | -1,059582 | 0,138027 |
| lnSize | 0,5583806 | 0,1010904 | 5,52 | 0 | 0,3602469 | 0,756514 |
| GDP_trim | -0,078647 | 0,0295767 | -2,66 | 0,008 | -0,1366162 | -0,02068 |
| Constant | -7,593579 | 2,409309 | -3,15 | 0,002 | -12,31574 | -2,87142 |
| sigma_u | 1,4867598 | |||||
| sigma_e | 2,2393724 | |||||
| rho | 0,30593499 | (fraction of variance due to u_i) | ||||
Source: Authors’ own elaboration.
This would mean, taking the data literally, that in positive cycles banks reduce the level of their solvency buffer. In practice, it is evident that, in growing economic cycles, banks are more willing to place resources, reducing their risk aversion in response to expectations of timely portfolio attention. When business cycles are decreasing-natured, banks adjust their risk policies, making them stricter, seeking to reduce exposure to portfolio claims that might affect profit due to the high provisions generated, resulting in decreased credit resources placement, which widens the solvency buffer. Thus, the placement behavior of banks seeks to maintain the solvency indexes required by the regulator (Table 5).
Tabla 5 Regression results with fixed effects panel data
| F(3,1542) = 14.87 | ||||||
| Prob > F = 0.0000 | ||||||
| BUFFER | Coefficient | Standard Error | t | P>|t| | [95% Con f, Interval] | |
| Diversification | -0,4514198 | 0,3058264 | -1,48 | 0,14 | -1,051299 | 0,14846 |
| lnSize | 0,5622294 | 0,1021847 | 5,5 | 0 | 0,3617937 | 0,762665 |
| GDP_trim | -0,0784784 | 0,0296001 | -2,65 | 0,008 | -0,1365391 | -0,02042 |
| _cons | -7,687294 | 2,399395 | -3,2 | 0,001 | -12,39372 | -2,98087 |
| sigma_u | 1,3833846 | |||||
| sigma_e | 2,2393724 | |||||
| rho | 0,27621296 | (fraction of variance due to u_i) | ||||
Source: Authors’ own elaboration.
On the other hand, according to these results, size has a significant positive effect on the solvency buffer, given that the larger the institution, the greater its solvency, hoping to generate confidence in its target audience. These results confirm what was expected from the theoretical point of view, i.e., that it would have a positive effect since a more diversified bank should be able to cope better with crisis situations because it would have lower profit volatility. However, there is not enough evidence attesting thereto.
The use of the random effects model on the fixed effects model is determined by the application of the Hausman Test (Table 6). This test compares the β obtained by means of the fixed effects estimator and random effects, identifying if there are significant differences between them. The interpretation of the Hausman test sets off from the null hypothesis that seeks to verify the existence of a correlation between the variables. From there, if Prob > is greater than 0.05 Ho is rejected, there is no correlation and the estimator to use is random effects. If Prob < is less than 0.05, the fixed effects estimator would be used (Labra and Torrecillas, 2014).
Table 6 Hausman test for fixed or variable effects
| Coefficients | ||||
|---|---|---|---|---|
| (b) | (B) | (b-B) | sqrt(diag(V_b-V_B)) | |
| fe | re | Difference | S.E. | |
| Diversification | -0.4514198 | -0.4607777 | 0.0093579 | 0.0137303 |
| lnSize | 0.5622294 | 0.5583806 | 0.0038489 | 0.0149143 |
| GDP_trim | -0.0784784 | -0.078647 | 0.0001685 | 0.0011774 |
| b = consistent under Ho and Ha; obtained from xtreg | ||||
| B = inconsistent under Ha, efficient under Ho; obtained from xtreg | ||||
| Test: Ho: difference in coefficients not systematic | ||||
| chi2(3) = (b-B)’[(V_b-V_B)^(-1)](b-B) = 0.50 | ||||
| Prob>chi2 = 0.9189 | ||||
Source: Authors’ own elaboration.
For the case of the solvency variable, the Hausman test shows a Prob > = 0.9189, greater than 0.05, Ho rejected, there is no correlation between the coefficients. In this case, the random effects estimator shall be used. Since there is no test available in Stata to perform a heteroscedasticity and autocorrelation test, it is assumed that they can arise, then we ran the robust random panel data model that allows correcting these problems.
When running this model, Table 7 shows that diversification, size and economic cycle variables are not significant to determine the solvency buffer behavior in colombian commercial banks.
Tabla 7 Regression panel data - robust
| Wald chi2(4) | = | 3,17 | ||||
| corr(u_i, Xb) | = | 0 (assumed) | Prob > chi2 | = | 0,5298 | |
| theta | ||||||
| min | 5% | median | 95% | max | ||
| 0,3928 | 0,3928 | 0,3928 | 0,3928 | 0,3928 | ||
| BUFFER | Coefficient | Standard Error | z | P>|z| | [95% Conf. Interval] | |
| Diversification | -0.1869875 | .117564 | -1.59 | 0.112 | -0.4174086 | 0.0434337 |
| lnSize | -0.0078448 | .063374 | -0.12 | 0.901 | -.1320555 | .1163658 |
| GDP_trim | .0264585 | 0.0344608 | 0.77 | 0.443 | -0.0410835 | 0.0940005 |
| Constant | 4.996404 | 1.524.778 | 3.28 | 0.001 | 2.007895 | 7.984914 |
| rho_ar | 0.89299742 | (estimated autocorrelation coefficient) | ||||
| sigma_u | 1.075858 | |||||
| sigma_e | 1.0285937 | |||||
| rho_fov | 0.52244787 | (fraction of variance due to u_i) | ||||
Source: Authors’ own elaboration.
4.2. Influence of diversification on profitability
For the case of the variable profitability, and to outline the influence of banks income diversification activities, a panel data model was run. Models with fixed effects (Table 8) and with random effects are run (Table 9). To determine which of the two models best suits the data, the Hausman test was performed (Table 10). The regression with fixed effects was chosen since the Hausman Test showed a probability of -0.13, that means that Ho is rejected, which then assumes that the differences are systematic. This negative value can be assumed as Hausman equal to zero, which leads us to use the fixed effects estimator. The rho of the model is 0.21675252, this means that it explains 21.67% of the panel variations.
Table 8 Regression results with fixed effects panel data
| F(3,1541) | = | 2,05 | ||||
| corr(u_i, Xb) = | -0,0426 | Prob > F | = | 0,1049 | ||
| ROE | Coefficient | Standard Error | t | P>|t| | [95% Conf. Interval] | |
| Diversification | -0.2287553 | 0.8804084 | -0.26 | 0.795 | -0.195568 | 0.149817 |
| lnSize | -0.2691672 | 0.2939213 | -0.92 | 0.360 | -0.8456953 | 0.3073609 |
| GDP_trim | -0.2044376 | 0.0851461 | -2.40 | 0.016 | -0.3714521 | -0.0374232 |
| Constant | 17.21741 | 6.901845 | 2.49 | 0.013 | 3.679412 | 30.75541 |
| sigma_u | 3.0574369 | |||||
| sigma_e | 6.4407522 | |||||
| rho | 0.1839012 | (fraction of variance due to u_i) | ||||
| F test that all u_i=0: F(12, 1541)= 26.59. Prob > F = 0.0000 | ||||||
Source: Authors’ own elaboration.
Table 9 Hausman test for fixed and variable effects
| Coefficients | |||
|---|---|---|---|
| (b) (B) | (b-B) | sqrt(diag(V_b-V_B)) | |
| re fe | Difference | S.E. | |
| Diversification | -0.2303821 | -0.2287553 | -0.0016268 |
| lnSize | -0.2505774 | -0.2691672 | 0.0185898 |
| GDP_trim | -0.2036503 | -0.2044376 | 0.0007873 |
| b = consistent under Ho and Ha | |||
| B = inconsistent under Ha, efficient under Ho | |||
| Test: Ho: difference in coefficients not systematic | |||
| chi2(3) | = | (b-B)[(V_b-V_B)^(-1)](b-B) | |
| = | -0,13 | chi2<0 ==> | |
Source: Authors’ own elaboration.
Tabla 10 Regression with fixed effects panel data - robust
| F(3,12) | = | 1,54 | ||||
| corr(u_i, Xb) | = | -0,0426 | Prob > F | = | 0,2538 | |
| ROE | Coefficient | Standard Error | t | P>|t| | [95% Conf. Interval] | |
| Diversification | -0.2287553 | 0.8739744 | -0.26 | 0.798 | -2.132982 | 1.675.471 |
| lnSize | -0.2691672 | 0.5202364 | -0.52 | 0.614 | -1.402.665 | 0.8643306 |
| GDP_trim | -0.2044376 | 0.109026 | -1.88 | 0.085 | -0.441985 | 0.0331097 |
| Constant | 17.21741 | 12.43709 | 1.38 | 0.191 | -9.880676 | 44.3155 |
| sigma_u | 3.074369 | |||||
| sigma_e | 6.4407522 | |||||
| rho | 0.1839012 | (fraction of variance due to u_i | ||||
Source: Authors’ own elaboration.
Once the fixed effects model was selected, the Wooldridge test was performed to determine if there is autocorrelation in the model. The results of this test show that F (1, 12) = 147,435 and that the probability of F < 0.000, this means that there is an autocorrelation issue that needs to be addressed. On the other hand, to determine whether the fixed effects model has heteroscedasticity issues, the modified Wald test was performed. The results of this test yield a chi2 (13) = 295.66, with a probability of chi2 = 0.0000. This means that the panel has problems of heteroscedasticity. To correct these problems, we ran a fixed effect model in the robust option whose results are shown in Table 11.
Table 11 Regression results with fixed effects panel data
| F(3,1542) = 14.87 | ||||||
| Prob > F = 0.0000 | ||||||
| BUFFER | Coefficient | Standard Error | , t | P>|t| | [95% Con f, Interval] | |
| Diversification | -0,4514198 | 0,3058264 | -1,48 | 0,14 | -1,051299 | 0,14846 |
| lnSize | 0,5622294 | 0,1021847 | 5,5 | 0 | 0,3617937 | 0,762665 |
| GDP_trim | -0,0784784 | 0,0296001 | -2,65 | 0,008 | -0,1365391 | -0,02042 |
| _cons | -7,687294 | 2,399395 | -3,2 | 0,001 | -12,39372 | -2,98087 |
| sigma_u | 1,3833846 | |||||
| sigma_e | 2,2393724 | |||||
| rho | 0,27621296 | (fraction of variance due to u_i) | ||||
Source: Authors’ own elaboration.
As shown in Table 11, diversification and size variables are not significant. As for the performance of the economy, measured by GDP growth, it is significant at 10%, the results of the regression (negative coefficient) suggest the existence of a negative relationship with the profitability of banks. This may mean that the profitability of banks increases in recessive cycles and decreases in growth cycles. These results may have a practical explanation based on the fact that, in times of crisis, banks have a lower appetite for risk and adjust credit rates upward, compensating for the exposure to which they are subject. In other words, in times of economic decline, credit resources are more expensive and can generate greater income for the sector.
On the other hand, the model has a rho of 0.1839, i.e., its explanatory power is limited, so new variables should be proposed to study the performance of banks’ profitability
5. Conclusions
Credit institutions in Colombia, in their desire to provide their clients with specialized services comprehensively, within a broad value offer concept driven by the multi-banking scheme, entered the stock and exchange markets, discovering in them a source of income that would support and aid the generation of profits through financial intermediation, the core activity of banks. That is, the intermediation business has been leveraged by the trading business when the latter can expose it to uncontrollable risks if compared to the intermediation activity.
In this sense, and as a result of descriptive analyses carried out on the financial statements of banks in the period from 2005 to 2014, it was possible to establish that the profits generated by the sector have an important contribution generated by trading activities, an activity that has been increasing its contribution to the overall results of the sector. It can also be said that a non-participation of banks in this activity would lead to losses at the end of each period, given the high burden of costs and expenses demanded by the resource intermediation business, resulting in a large share of models and structures that tend to generate operational and administrative inefficiencies, thus affecting the net profit margin of the intermediation activity, the core business of this type of entity.
As a result of this work, it was possible to find that the practice of income diversification, taken as the possibility of generating income from different sources, is not a variable that significantly affects the solvency and profitability of banks. It was also concluded that, in the case of Colombian commercial banks, size does not affect solvency or profitability. On the other hand, the results of the measurements made appear to indicate that the business cycle has a negative effect on profitability and solvency, contrary to what could be considered from a theoretical standpoint. In this sense, it can be inferred that when business cycles are decreasing-natured banks adjust their risk policies, making them stricter, seeking to reduce exposure to portfolio claims that affect profit due to the high provisions generated as a requirement of the Financial Superintendence. This is for the case of the solvency variable. In the case of the profitability variable, it can be thought that the higher risk generated in the business in times of crisis brings along with it higher placement rates that, together with stricter measures in the allocation of risk, allow banks to maintain their profits with growth or, at least, with stability in the eyes of the investor.
Research can further studies that include other types of variables, such as market interest rate, portfolio provisions, among others. This would make it possible to discuss other scenarios in the analysis of the effects of trading revenues on the profitability and solvency of Colombian banks.

