English (pdf)
 Article in xml format
 Article references
 Send this article by e-mail
 Cited by SciELO
  Cited by Google
  Similars in
SciELO
Similars in
SciELO  Similars in Google
 Permalink
1. Introduction
For the past 15 years, cities have faced multiple challenges regarding urban development. In 2005, Hurricane Katrina highlighted the effects of climate change; in 2007, the world’s population reached 7 billion people, half of whom live in urban areas; and in 2008, there was a crisis that shook the world’s economy. All of these phenomena bring the environment, the economic and social order into question, i.e., the sustainability of the planet (Sachs, 2016).
To address environmental, economic and social challenges, the UN (2015) issued a resolution entitled Transforming Our World: The 2030 Agenda for Sustainable Development, hereinafter SDG-2030. This agenda contains 17 goals that pursue inclusive and sustainable economic growth, in what is called the threefold task of development (ECLAC, 2018), highlighting SDG-11, which seeks to make cities and human settlements inclusive, safe, resilient and sustainable; making it clear that cities are the space where the threefold task will face its greatest difficulties (Martin, Evans, and Karvonen, 2018).
Such a concern is not new. In 1976, 40 years earlier, in Vancouver the Habitat I agenda was conceived, followed by the 1996-Habitat II in Istanbul, and at the Habitat III of 2016 in Quito, the New Urban Agenda for Housing and Sustainable Urban Development (NUA) was enacted. The fact that the SDG-2030 agenda and the NUA happen to coincide as frameworks for addressing Sustainable Urban Development (SUD) in cities nowadays is noteworthy (Yigitcanlar, Foth, and Kamruzzaman, 2019; ECLAC, 2018).
However, the implementation of the SUD agendas faces three specific constraints inherent to cities, for today they are forced to being global territories (Sassen 2001, 2015), sustainable (De Jong, Joss, Schraven, Zhan, and Weijnen, 2015;Loorbach, Wittmayer, Shiroyama, Fujino, and Mizuguchi, 2016) and smart enough to adapt to the pace of technological changes (Campbell, 2012; Martin, 2016 ). To monitor the progress of cities on SUD and the achievement of the agendas, rankings have been built to rate the performance of cities.
From the multiple indexes stands out Arcadis, which assesses sustainability and measures the ability of a city to be equitable, competitive and sustainable. The Cities in Motion Index (CIMI) evaluates the use of urban intelligence (UI) and classifies cities into three groups: high, medium, and low urban intelligence. The Globalization and World Cities Index (GAWC) does the same with globalization, i.e., assesses the ability of a city to link itself to the rest of the world. In this ranking, the cities rated as Alpha are the main trading nodes through which the largest amount of foreign direct investment flows; Beta cities are those that connect the continent where they are located with the rest of the world; while those cities that link their country to the continent are Gamma; and as Sufficient are rated those that are barely linked to other nearby countries.
A review of the three rankings in 2018 allowed us to identify the existence of heterogeneity among cities. By taking the place they occupy in each of the above-mentioned rankings as a reference, some cities were found to occupy similar positions, while others are highly scattered concerning the places in each index. In the first case, there are cities such as Amsterdam, which rated Alpha in globalization, 12th in sustainability and 10th in UI. Another similar city is Singapore, which ranks as Alpha+, 4th in sustainability and 6th in IU. Following the same benchmark, a group of cities was observed to have concentrated more on being good in globalization and on UI, than on sustainability. An archetypal example is New York, which ranks Alpha++ in globalization and 1st in UI, and 14th in sustainability. Another case is that of Beijing, a city rated Alpha+, 8th in UI, and 73th in sustainability.
On the other hand, Latin American cities present highly scattered results in the management of their development aspects. For instance, Sao Paulo is an Alpha city, it is ranked 78th in sustainability and rated 116th in UI. Concerning Colombian cities, Bogotá is a Beta, rank 100th in UI, and does not appear among the cities measured by the Arcadis. The same situation happens with Medellín, which is Gamma in globalization and 129th in UI. Cali is rated Sufficient in globalization, ranked 137th in UI, but has yet to rated as a sustainable city.
The recognition of this heterogeneity in cities is filling the agendas of researchers. May and Marvin (2017) , based on a review of reports from research projects carried out since 2007, whose goal was the sustainability of cities in Europe, found that there are two recurring questions: What is a sustainable city? And how is sustainability achieved in cities within the current framework of climate change, globalization, and boom of knowledge?
The first question elicits a description of the characteristics of sustainable cities, while the second question encourages to explore how citizen participation, governance, sustainability, and social justice are articulated into sustainability. This paper ascribes to these two issues. In this sense, our purpose is to explore and describe coordination among the conditioning factors of SUD (sustainability, globalization, and UI in cities), to assess how prepared cities are to take on the challenges posed by the 2030 SDG and NUA agendas. The objectives set out herein are to establish the degree of consistency between globalization, UI, and sustainability, to classify cities according to the degree of consistency among the three factors, and to determine the probability that a global and intelligent city will become sustainable and capable of taking on the current SUD agendas.
2. The problem of coordinating the conditions of SUD in cities
2.1. The conditions of SUD
It is now recognized that cities, regardless of their income level, face persistent challenges and problems (Loorbach et al., 2016). The pressure of globalization, the speed of technological change, the demographic transition, the catastrophes resulting from climate change, the institutional transformations associated with the convergence of cultures and the reorganization of territories are all phenomena that negatively affect cities (Davis, 2007; Loorbach et al., 2016)
In order to minimize these problems, policy-makers combine into SUD strategies to make their territories globalized, intelligent and sustainable places (Martin et al., 2018; ECLAC, 2018; NUA, 2017). Nevertheless, these three aspects of SUD often rival each other and do not always match at the same time (May and Marvin, 2017; Martinet al., 2018; ECLAC, 2018).
Globalization negatively impacts sustainability when sustainability is affected by increased extractive investment and fossil fuel consumption (Loorbach et al., 2016). Globalization challenges the economic aspect of sustainability when global markets fail to employ domestic businesses or human capital and import prices drop (Sassen, 2015; ECLAC, 2018).
Globalization deepens social inequality when it widens the gap between employees, and rural and urban areas, as well as when it raises land rent fees and generates discrimination between residents and migrants (Sassen, 2015; ECLAC, 2018; UN, 2015; Sklair, 2017),
Even though UI is designed to contribute to sustainability (De Jong et al., 2015; Campbell, 2012) today it is recognized that it may go against (Martinet al., 2018). The use of ICTs tends to increase the concentration of wealth (Sklair, 2017) by removing the poorest part of the population from decision-making, those exposed to digital illiteracy the most (Martinet al., 2018). Similarly, implementing smart cities with smart cars, the internet of things, smart mobility, etc. tends to reinforce consumption cycles (Martinet al., 2018).
At the local level, tensions arise when cities decide to become sustainable. This is because different social classes are placed in conflict-of-interest scenarios (Loorbach and Shiroyama, 2016). The profits of multinationals and domestic companies whose revenue is based on the exploitation of raw materials are questioned (Loorbach, Frantzeskaki, and Avelino, 2017). When clean technologies are selected, it becomes clear that not all technology works (Loorbach and Shiroyama, 2016).
What has been addressed thus far makes it understandable why it is costly for cities to become globalized, sustainable and intelligent at the same time. Yet still, the challenge for policy-makers in the coming years is to make cities sustainable. This means to become the best places to live, work and for recreation by using resources in the present and preserving them for the future (UN, 2015 and UN, 2017).
Thus, the literature recognizes that a sustainable city is one simultaneously described as global (Sassen, 2001), intelligent (Campbell, 2012), sustainable (Martin et al., 2018), green (Latif, Bidin, and Awang, 2013), ecological (Caprotti, 2014), low-carbon (Gossop, 2011), resilient (Jabareen, 2013), quality of life-providing and creative (Florida, Mellander, and Gulden, 2012).
In this regard, Gossop (2011) and De Jong et al. (2015) , based on network analysis exercises where nodes are the keywords in academic articles, have identified that there are at least 12 categories of cities, wherein the sustainable city category predominates, followed by smart city and knowledge, and the city global to a lesser extent. Hence, the theoretical discussion has focused on determining the congruence between city categories.
Following this logic, May and Marvin (2017) have identified that researchers seeking to understand how a city’s degree of sustainability is determined, face questions such as what sustainability in a city under a principle that goes beyond technostructure, and how do the various elements making up sustainability in a city integrate.
This work falls within both lines of research. However, it moves a step forward as it seeks to establish the correlation between the determinants of development, taking the rankings that measure the performance of cities as global, intelligent and sustainable, in order to describe the strength of cities to take on the agendas of the SDGs and the NUA.
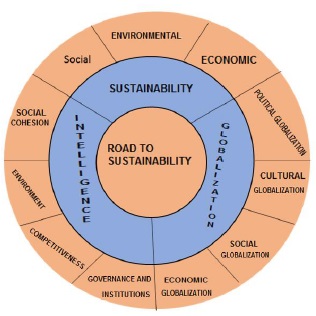
2.2. Sustainable cities: a place where the constraints SUD coincide
A sustainable city is understood as that which, through SUD planning in the framework of the SDG-2030 and the NUA agendas, manages to minimize the existing tensions between globalization and sustainability by using the UI. In short, a sustainable city is one capable of taking on the threefold task of development by making use of knowledge and globalization.
As mentioned above, economic growth is one of three tasks in the agendas. In this sense, globalization is the strategy to increase competitiveness, attract foreign investment, labor, and capital, increase the volume of knowledge-intensive services (Sassen, 2001), encourage the modernization of urban infrastructure (Sklair, 2017), reduce transport costs (Campbell, 2012) and homogenize and integrate citizens across the globe (Ben-Rafael, 2018).
The second task is to achieve social inclusion with equity (Stockholm Resilience Centre, 2016); NUA, 2017). Here, the city seeks to attain a greater balance between social classes, guarantee citizen participation, respect social rights, and provide quality education and access to public services (ECLAC, 2018; NUA, 2017). The third task is to make cities sustainable (NUA, 2017; Stockholm Resilience Centre, 2016). This seeks to make cities resilient (De Jong et al., 2015), green (Latif, Bidin, and Awang, 2013), low-carbon (Gossop, 2011), sustainable and ecological (Caprotti, 2014). All this is synthesized as a city’s ability to guarantee the economic gains of agents, social inclusion under principles of equity, and the sustainability of resources for present and future generations (Brundtland, 1987; Loorbach et al., 2017; May and Marvin, 2017).
All these tasks are achieved or are intended to be achieved, through the implementation of UI (Campbell, 2012). By using intelligence, a city adapts to the territory and the rapidness of technological change (Campbell, 2012; Martinet al., 2018), facilitates the absorption of knowledge (Yigitcanlar and Kamruzzaman, 2018)and encourages creativity (Florida et al., 2012).
An intelligent government ensures citizen participation, increases government responsiveness and facilitates coordination among individuals (Yigitcanlar and Kamruzzaman, 2018). Likewise, the use of technologies to expand the coverage and improve the quality of public services, the implementation of social innovations, and the increase of knowledge in aspects such as caring for adults and children, and in health and recreation services, as well as mobility, etc. (Martin et al., 2018).
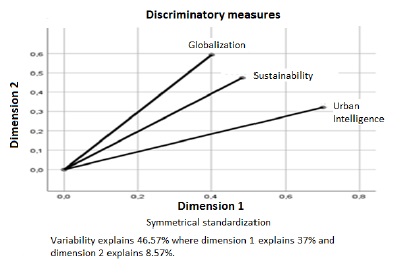
The consistency of all three factors and the agendas is shown in Figure 1. The hypotheses of this work arise from Figure 1:
H1: In the most sustainable cities, there exists complementarity and positive compatibility between UI, globalization and sustainability processes. This complementarity is at the heart of the current SUD in the majority of the most prosperous cities.
H2: A city is more likely to be sustainable the more UI it implements, and the less if it only implements globalization.
3. Methodology
3.1. Selection of the sample
To select the sample to be analyzed, three proxy indexes on the performance of cities were taken into account, i.e., Arcadis that measures sustainability, CIMI that does the same to UI, and (GawC, 2019) which accounts for the level of globalization. Since each index possesses its own cities for evaluation, a matching matrix was drawn up to identify which are evaluated simultaneously. The matrix produced 83 cities where the indexes coincided in 2016.
3.2. Obtaining analysis categories
The categories to classify the cities were obtained by using each index.
Although it is common for researchers to construct indexes that meet the specific needs of each working document, the use of existing indexes or rankings, such as GaWC, CIMI, and Arcadis, is equally valuable. Among the outstanding works in this line is that by Pain (2011) , which, through the use of the GaWC index, managed to identify the profound changes that are modifying the roles and functions of cities and their trade routes in contemporary globalization. More recently, Ahvenniemi, Huovila, Pinto-Seppä, and Airaksinen (2017) analyzed 16 rankings of smart cities and found that these lack environmental sustainability indicators. They conclude that the concept of the smart city must be redefined for it to include such an aspect of sustainability.
This research moves forward a step by adding sustainability to the indexes because this ensures a better description of what a sustainable city is nowadays.
3.2.1. GaWC.
Following the concept of global cities of Sassen (2001) , this index was created in the Department of Geography of the University of Loughborough (Taylor, 2004). It measures the level of globalization based on a city’s links to the rest of the world. The index includes four aspects of globalization: economic, social, cultural and political. (Taylor, 2004)
In this ranking, Taylor (2004) argues that a city is Alpha++ when it links the whole world. Alpha+ cities are a complement or linking bridge to Alpha++. Alpha and Alpha- are world cities that complement the above-mentioned ones. Beta Cities are those that link their region commercially to the global economy. Gamma cities link the exchange of goods between smaller regions or states to the continent’s economy. Meanwhile, the cities rated as sufficient are those in possession of services that allow them to link themselves to the country and its neighbors.
In this study, we proposed classifying cities into three categories: Alpha, which includes Alpha++, Alpha+, and Alpha cities that were assigned a score between 100 and 80. The second category includes beta cities, which contain Alpha-, beta+, and beta, with a rating between 70 and 55 points. Finally, the third category contains the cities known as gamma, and it includes cities rated as beta-, gamma+, gamma, gamma, and sufficient, with a score between 50 and 30 points. This grouping was employed in order to minimize categories and dispersion thereby. Categories may be combined since a city can easily vary in its position from year to year (Taylor, 2004).
3.2.2. CIMI Smart Cities Index.
The strategy department at IESE Business School builds this ranking. It measures the future sustainability of the world’s major cities, as well as their inhabitants’ quality of life. The index is made up of ten key dimensions: economy, human capital, technology, environment, international projection, social cohesion, mobility and transport, governance, urban planning, and public management. These consist of 79 indicators in total.
This index classifies cities into 4 levels according to the score they obtained. A city has high performance (A) if its index is greater than 90, relatively high (RA) between 60 and 90, medium (M) between 45 and 60, and those with an index below 45 are considered to be low-performing (B).
In order to simplify the analysis, in this paper we decided to classify cities into three categories, to wit, those of High Urban Intelligence (AIU), typical of the cities that obtained between 75 and 100 points in the (CIMI, 2019) and those of Median Urban Intelligence (MIU) to include cities whose score was between 45 and 75. Finally, the cities in the Low Urban Intelligence (BIU) category are those that scored between 0 and 45.
3.2.3. Arcadis Sustainable Cities Index.
Produced by Arcadis (2019) and the center for economic and business research. It measures how cities are doing in terms of sustainability, that is, how they are balancing immediate needs without compromising the needs of the future. It is built on three pillars of sustainable development, i.e., people, planet and profits, which represent social, environmental and economic sustainability.
The people sub-index measures social performance, including factors such as education, health, affordability, income inequality, demography, lifestyle (balance between leisure and work) and, finally, crime. The sub-index relating to the planet measures aspects such as environmental risks, green spaces, energy, air pollution, greenhouse gas emissions, waste management, drinking water, and sanitation. While the earnings sub-index assesses the economy’s health by taking into account factors such as transport infrastructure, economic development, ease of doing business, tourism, connectivity, and employment. In short, there are 32 indicators. Each of these sub-indexes is rated from 0 to 100 points. A city is more sustainable the higher the score it gets in the average and it will be less sustainable in the opposite case.
This work calculates the level of sustainability in a city by using the combination of the 20 places occupied by that city in each sub-index as a reference. Given this condition, cities were classified into three groups. Very sustainable cities are those that obtained one of the first 20 places in each of the three sub-indexes, and they receive this qualification because they have managed to achieve social, environmental and economic objectives simultaneously. For their part, cities that received good ratings in at least 2 of the sub-indexes were classified as partially sustainable. Finally, the cities that obtained a good score in only 1 sub-index were evaluated as unsustainable. Likewise, the cities that occupied the last 20 positions in the ranking also entered this category.
3.2.4. Consistency between rankings.
After presenting the indexes through which each SUD determinant is assessed, this work made progress in showing that it is plausible to find coincidences between them, even though they were designed to measure particular elements of cites. Therefore, together they provide a comprehensive picture of what makes up SUD in a city. These coincidences are illustrated in Table 1.
Table 1 Cities’ performance measuring indexes dimensions
| indexes | Dimensions | Sub-indexes |
|---|---|---|
| GAWC | Social globalization | Environmental, humanitarian NGOs |
| Scientific articles | ||
| Cultural globalization | Media Conglomerate | |
| Architectural Engineering Companies | ||
| Architecture associations | ||
| Economic Globalization | Management consultation | |
| Banking and financial sector | ||
| Law firms | ||
| Insurance companies | ||
| Political Globalization | UN Agencies | |
| Embassies, domestic diplomatic branches | ||
| Government, municipal organizations | ||
| Arcadis | Social | Education |
| Health | ||
| Demography | ||
| Income inequality | ||
| Work-life balance | ||
| Crime | ||
| Environmental | Environmental risks | |
| Green spaces | ||
| Energy | ||
| Air Pollution | ||
| Greenhouse gas effects | ||
| Waste management | ||
| Drinking water and sanitation | ||
| Economic | Transport infrastructure | |
| Economic development | ||
| Ease of doing business | ||
| Tourism | ||
| Connectivity | ||
| Employment | ||
| CIMI | Social cohesion | Social cohesion |
| Human resources | ||
| Environmental | Environmental development | |
| Competitiveness | Economic development | |
| Technology | ||
| Mobility and transport | ||
| International presence | ||
| Urban planning | ||
| Governance and institutions | Governance and civic participation | |
| Public administration |
Source: Author own elaboration.
Table 1 shows that all three rankings coincide in measuring dimensions such as human capital, foreign investment, economic growth, environment, quality of life and integration with the rest of the world. Therefore, in principle, the correspondence analysis technique is applicable. Given that the values of all three rankings were taken for 2016, these dimensions are expected to coincide in terms of their dynamics in the same territory, a fact that provides an idea of what SUD is and how it works in a city.
3.3. Application Technique
After corroborating that the indexes do coincide in some measurement dimensions, the next step was to apply the multiple correspondence and simple ACM and ACS analysis techniques. This technique is applied when we need to know if the attributes of an individual are congruent and compatible, and is also used to calculate the probability that a subject gains an attribute given its main trait (Greenacre, 2008).
In this perspective, the technique was used to determine the degree of consistency between the constraints of globalization, UI, and sustainability of cities, as shown in Table 1. To this end, the aim was to identify the conditions that cities experience to take on and meet the SDGs. The correspondence analysis made it possible to obtain the probability that a city is sustainable when it is globalized or smart.
4. Analysis of results: consistency between globalization, UI and sustainability
This section of the document describes the findings derived from the application of the ACM and ACS technique and moves on to contrast the working hypotheses.
4.1. Characterization of global, smart and sustainable cities
As mentioned in the sample selection, 83 cities were identified were all three rankings coincide, that is, only 83 cities meet the condition of being global, smart and sustainable. Table 2 describes the number of cities per category.
Table 2 Classification of cities per category
| Indexes | GAWC | Arcadis | CIMI | ||||||
|---|---|---|---|---|---|---|---|---|---|
| Categories | Alpha | Beta | Gamma | Very sustainable | Partially sustainable | Unsustainable | AIU | MIU | BIU |
| Cities by category | 28 | 39 | 16 | 17 | 51 | 15 | 29 | 44 | 10 |
Source: Author own elaboration.
The table shows that, according to the GaWc index, of all the cities, 28 are Alpha, 39 are beta and 16 gammas. While the CIMI rated them as AIU 29, MIU 44 and BIU 10. And regarding Arcadis classified them as very sustainable 17, partially sustainable 51 and unsustainable 15.
Table 3 presents some descriptive statistics, using the scores the cities obtained in each index.
Table 3 Descriptive statistics
| Indexes | Mean | Stnd. deviation | C.V | Xmin | Xmax | Median | Q1 | Q2 | Q3 |
|---|---|---|---|---|---|---|---|---|---|
| CIMI | 67.51 | 15.20 | 0.23 | 34.54 | 100 | 69.42 | 57.43 | 69.42 | 79.46 |
| Arcadis | 55.73 | 11.15 | 0.20 | 30.80 | 74.6 | 57.8 | 45.90 | 57.80 | 64.55 |
| GAWC | 73.07 | 15.10 | 0.21 | 30.00 | 100 | 80.00 | 60.00 | 80.00 | 85.00 |
Source: Author own elaboration.
A glance at the above table shows the cities experience diversity in ratings in each index. According to the CIMI index range, New York is the city with the highest score, corresponding to 100, while Calcutta holds the lowest score (34.54). Meanwhile, as for the GaWC, the cities that scored 100 are New York and London, and Nairobi scored the lowest, with 30 points. In the Arcadis index, the city with the highest-scoring city is Zurich with 74.6, and the lowest-scoring is Calcutta with 30.8.
The concentration and dispersion of cities around indexes are also important, and the descriptive statistics show the cities tend to present better averages for globalization and UI than they do for sustainability. This is demonstrated by the average and median of the GAWC index, with a value of 73.07 and 80 respectively, and a standard deviation of 15.10, which reflects that the cities in the sample tend to be Alpha and Beta+. Meanwhile, the cities evaluated with CIMI experience a mean of 67.51, a median of 69.42 and a deviation of 15.20. Therefore, it is inferred that cities tend to be of average intelligence with a tendency towards the highest capabilities. In the same analysis logic, the Arcadis index yields a mean of 55.73, a median of 57 and a standard deviation of 11.15, proving that cities concentrate on being partially sustainable with regards to sustainability.
It is noteworthy that the variation coefficient (CV) is 0.23 for CIMI, 0.20 for Arcadis and 0.21 for GAWC. This indicates that the level of dispersion between cities tends to be the same among all three indices.
The data show that the cities ranked as the most sustainable are not necessarily the most globalized, but the ones with the highest UI. The CV proves that heterogeneity exists among the cities, which is why some very well positioned and others are very consistent with their low position in the respective rankings.
4.2. Coordinating Sustainable Urban Development in cities
The aim is to show the existing consistency between the determinants of the SUD. This analysis is shown in Table 4. The determinants are presented in the rows and the contrast statistics are described in the columns.
Table 4 Contrast statistics
| Compatibility among processes | Chi-square | p-value | Likelihood Ratio | p-value | Contingency coefficient | approx. p-value |
|---|---|---|---|---|---|---|
| Degree of globalization Urban Intelligence | 8.567 | 0.073 | 9.986 | 0.041 | 0.306 | 0.073 |
| Sustainability Urban Intelligence | 11.633 | 0.02 | 12.257 | 0.016 | 0.351 | 0.02 |
| Sustainability Degree of globalization | 8.475 | 0.076 | 11.575 | 0.021 | 0.304 | 0.076 |
Source: Author own elaboration.
Table 4 shows that a correlation exists between all SUD determinants evaluated because the value of the chi-square statistic and the contingency coefficient allows us to accept the hypothesis that there is statistical consistency among the contrasting variables. The table shows that the chi-square value for globalization and sustainability is 8.47; CC is 0.304 and the likelihood ratio is 11.57. With a p-value of 0.076, 0.076 and 0.021 respectively.
It is also observed that between UI and sustainability, the chi-square value is 11.63, CC is 0.351 and RV is 12.25. With p-values of 0.02 0.02 and 0.016. Finally, when analyzing the dependency relationship between UI and globalization, a chi-square of 8.56 was obtained, with CC of 0.306 and RV of 9.98, with p-values equal to 0.073 and 0.041. Therefore, in all cases, the consistency between the variables’ hypothesis is approved.
Dependence between sustainability and globalization, sustainability and UI, and UI and globalization, show that a city with sound SUD is one that possesses the attributes of being global, intelligent and sustainable, wherefore they experience the benefits of their interaction and minimize the issues of tensions. Such consistency suggests that for the cities in the sample, globalization contributes to economic sustainability by attracting foreign investment, increasing jobs, qualifying labor, and increasing the benefits promised by free trade.
Dependence and a statistical association between UI and sustainability allow us to infer that intelligence in these cities improves the management and use of resources as well as mobility, urban congestion, the costs associated with pollution and those of agglomeration diseconomies.
Consistency between globalization, sustainability and UI suggests that SUD in cities appears to experience leverage and self-reinforcing mechanisms, which constitute virtuous circles of sustainability where processes as a whole are enhanced. Hence, it is possible to conclude that a city is more likely to be sustainable because of its higher UI; it is smarter because it is more globalized, and it is more globalized because it is more sustainable.
4.3. Cities’ sustainability feasibility
At this point in the analysis, we shall move on to answer the question about what is the feasibility of a city being sustainable when it is global and develops UI or, in the same meaning, how well-prepared are cities to undertake sustainability agendas, given the determinants of SUD. To solve this question, ACS provides sustainability’s probability of occurrence given the conditions of globalization and intelligence.
4.3.1. The feasibility of sustainability in a city depending on the level of globalization.
As shown in Table 4, globalization and sustainability are consistent, so the probability of a city being sustainable can be calculated given its level of globalization. This result is shown in Table 5.
Table 5 Sustainability vs Globalization
| Sustainability/Globalization | Alpha | Beta | Gamma | Total cities Level of sustainability |
|---|---|---|---|---|
| Very sustainable | 0.18 | 0.31 | 0 | 0.2 |
| Partially sustainable | 0.57 | 0.59 | 0.75 | 0.61 |
| Unsustainable | 0.25 | 0.1 | 0.25 | 0.18 |
| Total cities by Globalization Index | 0.34 | 0.47 | 0.19 | 1 |
Source: Author own elaboration.
The conditional probability analysis shows that, of all 83 cities, the 28 rated as Alpha have an 0.18 likelihood of being very sustainable, 0.57 to be partially sustainable and 0.25 to be hardly sustainable. However, there are 39 Beta cities in the sample, the probability that one of these cities is very sustainable is 0.31, partially sustainable is 0.59 and hardly sustainable is 0.10. Finally, there are 16 Gamma cities and the probability that one of these cities is highly sustainable is 0, 0.75 for partially sustainable and 0.25 for hardly sustainable.
Table 5 also shows a city’s probability of achieving a particular level of sustainability given a level of globalization. The probability that a city is highly sustainable given any level of globalization is 0.20, 0.61 that it is partially sustainable and 0.18 to be rayed as hardly sustainable. The table shows that for cities rated Alpha or Beta in globalization, it is feasible to be fully or partially sustainable, while being gamma makes it difficult to achieve higher sustainability levels.
These results justify findings such as those of Davis (2007) and Sassen (2015) , who have drawn attention to the difficulties faced by large and highly globalized cities. For these authors, sustainability in globalized cities such as London, New York, and Sao Paulo remains at risk, because it is a battlefield between emigrants and residents, as well as among citizens of different classes. The above affects the goal of social inclusion, equity and environmental sustainability. These cities are highly polluted due to their economic boom, wherefore it is likely to find Alpha cities in all groups with different results in sustainability.
4.3.2. The feasibility of sustainability in a city as a function of UI.
The literature supporting this document shows that UI sustains a positive relationship with sustainability. Our ACM showed that there is statistical dependence between these two variables; hence, the conditional probability between them can be calculated. Table 6 illustrates the results.
Table 6 Sustainability vs UI
| Sustainability/UI | BIU | MIU | AIU | Total cities Level of sustainability |
|---|---|---|---|---|
| Very sustainable | 0 | 0.9 | 0.31 | 0.16 |
| Partially sustainable | 0.5 | 0.64 | 0.62 | 0.61 |
| Unsustainable | 0.5 | 0.27 | 0.7 | 0.23 |
| Total cities by urban intelligence | 0.12 | 0.53 | 0.35 | 1 |
Source: Author own elaboration.
Of 83 cities evaluated by the CIMI index, 29 were rated as having high AIU. The probability that one of these cities is highly sustainable is 0.31, 0.62 for partial sustainability, and 0.07 that it is hardly sustainable.
However, out of the total number of cities, 44 were ranked as MIU. The probability that one of these is highly sustainable is 0.09, 0.64 partial sustainability, and, finally, the probability to be rated as hardly sustainable is 0.27. On the other hand, out of the total sample, 10 were ranked as UI. The probability that one of these is highly sustainable is 0, 0.5 partial sustainability, and, likewise, the probability to be rated as hardly sustainable is 0.5.
Table 6 also shows that the feasibility that a city is highly sustainable regardless of its UI is 0.16, 0.61 to be regarded as partially sustainable, and 0.23 to be regarded as hardly sustainable. From the results illustrated by the table above, it is inferred that the greater the UI a city produces, the greater the probability that it will be highly sustainable, namely, that it achieves a greater congruence between environmental, economic and social objectives. It also follows that medium intelligence can become sustainable, but it will not achieve the highest levels of compatibility between objectives. Finally, it is practically impossible to become sustainable with low intelligence.
4.4. Classification of cities in terms of sustainability, globalization, and UI
Once consistency among SUD determinants has been verified and their conditional probability calculated, it can be said that such consistency is not equally strong in all sampled cities. The divergence is shown in Figure 2, which is a panel representing two biplots. The first one shows the predominating categories in a given quadrant, whereas the second one describes the predominating cities in each quadrant.
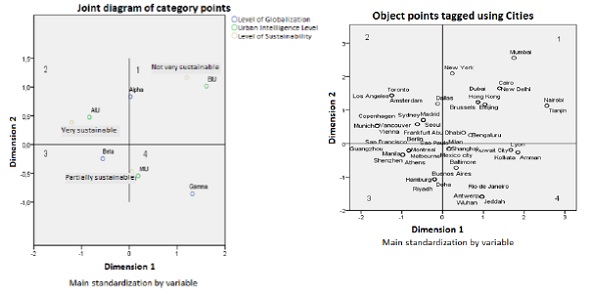
The results of the biplot show that two dimensions explain 46.57%1 of the data, a fact that analysts have accepted as good (Hair, Anderson, Tatham, and Black, 1999). (Annex 1). From figure stems that all 83 cities can be classified into at least 4 classes.
Cities with a highly coordinated SUD
This category includes those located in the second quadrant. Here are concentrated cities that are Alpha, very sustainable and MIU. An example of such cities would be Amsterdam, Vienna, Singapore, San Francisco, and Dallas. Furthermore, some Beta-globalization cities, such as Vancouver and Copenhagen, which are also highly sustainable and high in UI, fall within this category.
Cities in this group are best suited to address the persistent problems and agendas of SDG-2030 and the NUA. A comparison of the cities identified herein as first-degree coordination cities, using data from 2016 and the 2018 results of the Arcadis index, confirms that the model proposed in this study describes relatively well the future sustainability behavior of cities. Thus, in 2016, Singapore was ranked 3rd and 4th in 2018, and in this same period, Vienna moved from the 4th position to the 5th. Meanwhile, Amsterdam was 11th and descended to 12th; Vancouver was ranked 23rd and descended three to 26th; San Francisco was ranked 39th and climbed to 16th place. Finally, Dallas was 56th, lost 3 places and dropped to 59th.
These cities experience a strong virtuous circle, they rely more on their UI than on globalization. It follows that the cities identified as best-coordinated are able to sustain themselves in the medium term while managing sustainability, and are the most prepared to take on the agendas of the SDGs and the NUA.
Cities with a moderately coordinated SUD
These fell in the third quadrant and are characterized by congruence in their levels of development. In terms of globalization, they tend to be Beta and of medium intelligence, and it follows that they have achieved partial sustainability levels. An example of these cities is Hamburg, Baltimore, Buenos Aires, Miami, and Prague. Some high UI cities such as Melbourne entered this category as well because they are Beta and partially sustainable.
To evaluate the predictive capacity of this research, the evolution of these cities was also consulted in the Arcadis index for the period between 2016 and 2018. Thus, in 2016, Hamburg was ranked 8th and in 2018 it moved to 17th; Buenos Aires was 80th, lost one place and fell to 81st; Miami was in the 53rd position and dropped to 63rd; Prague was in the 9th place and descended to 23rd; Melbourne fell from 32th to 56th; Baltimore held 53rd place and fell to the 68th place; Calcutta was ranked 100th and ended up falling out of the ranking.
As has been noted, these cities’ SUD is less coordinated compared to the first group given that they lose between 10 and 15 places, and those in very-low places, such as Buenos Aires and Calcutta, either remain or get discarded. This group of cities is a little less sustainable than the better-coordinated ones in the above section because they are less globalized. These cities have concerned themselves with developing their UI, which supports the levels of sustainability they have achieved.
Cities with a weakly coordinated SUD
These cities are located in the fourth quadrant, which is made up of Gamma-rated cities that are partially sustainable, examples of which are Glasgow, Manchester, and Rio de Janeiro, with medium UI levels. Partially sustainable cities are also found here, of a medium UI and Alpha-rated in globalization. Cities such as Sao Paulo, Milan, and Mexico City fall in this category.
The evolution of the Arcadis index in this group was also compared to what we have proposed. Thus, it follows that the city of Manchester took the 25th place in 2016 and descended to 57th place in 2018; Glasgow was 36th and escalated to 32nd place; Rio de Janeiro was in 82nd place and fell two places to 84th; Sao Paulo moved one place up from the 79th place, thereby occupying the 78th place; Milan was ranked 42nd and rose to 27th, and Mexico City rose from 82nd to 79th.
This set of cities is characterized by being third-level cities in the Arcadis index and yet they make efforts to ascend in their pursuit for better positions, except for Manchester, which has descended places. This is a group of cities where sustainability depends more on UI than on the degree of globalization. These present the greatest difficulties in resolving and addressing persistent problems. They are cities that, due to their size, make greater efforts to integrate agendas into their SUD.
Cities with a very weakly coordinated SUD
These are located in the first quadrant. These cities are classified as hardly sustainable and of low UI, while they are highly dissimilar in terms of their degree of globalization, for there are Alpha and Beta cities, and some with a medium UI level have also entered this category. These cities’ SUD determinants are highly scattered, while they are ranked very well in some respects, but they fail to hold on to it due to their weakness in others.
Cities such as Brussels, Beijing and Hong Kong have fallen into this category; these have been rated with low UI and as hardly sustainable like Cairo and New Delhi. New York is in this quadrant since it has been ranked as hardly sustainable despite being an Alpha city with high UI. There are also a few cities with Gamma-rated globalization levels such as Nairobi and Tianjin, which are both hardly sustainable and present low UI.
Like the previous groups, this group also had its evolution assessed in the Arcadis index of 2018. Hence, it follows that, in 2016, Brussels took the 40th place and fell to 47th in 2018; in that same period, Beijing and Cairo held their positions, namely, 73rd and 99th place respectively; New York fell from the 26th place to 30th, and New Delhi rose from 97th to 89th.
As can be seen, these cities are very scattered throughout the rankings, which explains why they tend to lose positions in the two analyzed, except for New Delhi, which occupied the third-to-last place and won 8 places. These cities possess a non-virtuous sustainability circle, in other words, these are the ones that experience difficulties in addressing and resolving persistent problems, minimizing the tensions among SUD determinants and taking on the agendas.
5. Conclusions
This work made it possible to verify that the most sustainable cities are those that have achieved consistency among SUD determinants. What is relevant in this result is that it was attained by using indexes that were built by entities with different objectives, methodologies, and interests. This finding is far from the presumption the proponents of globalization hold, which posits that simply opening up the economy guarantees sustainability. And the same occurs with smart city analysts, who see intelligence in the intensive use of ICTs and regard it as sufficient to achieve sustainability. This study has shown that it is necessary to work on all three constraints as a whole to make the territories sustainable.
In this study, it was possible to identify four groups of cities, each with dissimilar conditions to cope with the SDGs, and it follows that not all cities are equally prepared to take on the agendas. This, which is apparently obvious, entails important policy-making implications. What is most important is that policymakers should be very cautious when adopting agendas in their government plans, because, as has already been said, balance is required in the allocation of resources for all three constraints, since privileging one can create more tensions than complementarities. That is why the UN (2015) draws attention to the need to consolidate strong governance that serves to coordinate the efforts of all stakeholders.
The second implication of this work lies in the recognition, which contrary to what has been done in the last 30 years, favoring globalization as the main development strategy, nowadays it is paramount to reflect and pay attention to knowledge as a source of sustainability, as it is the intensive use thereof makes it possible to undertake the aforementioned agendas and resolve persistent problems. This implication is supported by the fact that a city’s probability of being sustainable because it is intelligent is greater than if it is globalized.
It is also inferred that a city should renounce degrees of globalization at first, and gain in UI so as to move forward in globalization. The case of New York is significant, for this city ranked 26th in sustainability in 2016, and escalated 12 places in 2018.
Another important finding arising out of the work is that the probability of being very sustainable and able to better address the challenges of the SDGs depends on consolidating a strong or medium UI. This explains why there are so few cities rated Alpha, very sustainable and intelligent. The vast majority of the cities in the sample are generally more likely to be partially sustainable since they are mostly rated Beta with a mid-level UI. It is relevant that for Gamma cities, which include those rated as sufficient, it is very difficult to attain partial or high levels of sustainability, that is to say, successfully coping with the SDGs.
The relevance of the ACS and the MCA as an analysis technique is noteworthy since its use made it possible to verify compatibility and complementarity among the processes of globalization, UI and sustainability. The correspondence analysis was relevant because it made it possible to show that a city is a subject in which all three conditions take place simultaneously. Furthermore, it was evident that, even inside a city, these occur at more or less similar rates. Some cities move faster on globalization than they do with respect to intelligence and sustainability. Meanwhile, the exact opposite happens in other cities, i.e., they move faster on sustainability than they do on globalization, thanks to how quickly they manage to consolidate UI.