


 Inglês (pdf)
 Artigo em XML
 Referências do artigo
 Enviar este artigo por email
 Citado por SciELO
  Citado por Google
  Similares em
SciELO
Similares em
SciELO  Similares em Google
 Permalink
1. Introduction
In recent years, business strategy management has become one of the main challenges for organizations because it is considered a critical factor in their financial performance growth. However, engaging in such a strategy involves serious financial efforts expected to be offset in business profitability.
When analyzing the Colombian industrial sectors, focusing on the Santander department, growth indexes and GDP labor participation place this department as the fourth most important economy in the country, standing out in sectors such as public services, industry, commerce, and construction (Cámara de Comercio de Bucaramanga, 2019). When one delves into the manufacturing industries, specifically chemicals and petroleum derivatives, the rubber and plastic industries’ participation stands out with a 40.86% growth between 2013 and 2018 and an increase of 7.09% in assets, an 8.99% in sales, and a 6.44% in profit (Cámara de Comercio de Bucaramanga, 2020). However, its GDP participation is less than 0.6% (Cámara de Comercio de Bucaramanga, 2015). The latter suggests that the results to-date of this industry have not always been conclusive, resulting in minimal GDP variations that ultimately affect the companies’ wealth that comprise it.
After analyzing national and international paperwork, it was possible to discover previous structural analysis in strategic management developed within the plastic industry in Colombia, which were carried out from a qualitative and quantitative approach, aiming to analyze its behavior from four different tools: overcrowding, perspective, market strength, and competitor analysis (Gómez-Cárdenas, 2010). On the other hand, productivity in Colombian SMEs has also been previously studied. Results indicate that the low level of competitiveness is tied to the industry’s low profitability due to the absence of a strategy standardization (Mayorga-Sánchez and Porras Jiménez, 2015). Internationally speaking, some Mexican research stood out by determining that an accurate definition of financial strategies generates positive results for the industry based on the classification and delimitation of actions that a company can carry out (Álvarez and Abreu, 2008; Cortés, Barraza, and de Jesús Vizcaíno, 2016).
In this sense, even though there is a broad previous literature about this topic, which demonstrates the relevance and relationship that exists between strategic management and the financial behavior of enterprises, Colombian companies have not been analyzed nor profiled, resulting in nonexistent studies or information regarding Santander department under a quantitative and/or qualitative approach. That is why this relationship was studied, using Porter’s strategic methodology, validated by Dess and Davis (1984), in which two types of performance measures are adopted, the ROE and ROA financial indicators and an effectiveness qualitative indicator. This research was divided into three phases: the financial analysis, the definition of the strategies implemented by the Bucaramanga companies, and the variance between the quantitative and qualitative data collected.
2. Theoretical Framework
Several conceptual models consider the term strategy a plan that a company takes to guarantee a course of action and the fulfillment of objectives. Authors such as Contreras Sierra (2013) and Andrews, Boyne, and Walker (2006) agree with the concept established by Ansoff (1987). Contreras Sierra defines the formulation of a strategy as the basis for achieving goals and objectives, while Andrews, Boyne, and Walker consider the idea of a strategy as cooperation and correlation between business units. They also describe the term as the pattern of policies, plans, and goals to achieve objectives in such a way that it is possible to identify the place where the company is at the moment and what type of company it is or is going to be in the future.
From an industrial organization perspective, it is believed that a company’s structure hints at the nature of its competition, whereas the last one determines the results of the organization (Calderón, Álvarez, and Navarro, 2010). The latter suggests the idea of strategic groups that comprise companies from the same area with the same or similar strategies (Porter, 1980). In this scenario, the companies’ profitability depends on the industry structure and its strategic behavior.
After compiling organizational analysis models, the following groups stand out (Quinn and Rohrbaugh, 1983):
Internal process improvement model: focused on operability.
Open system model: focused on customer satisfaction.
Rational model: focused on the increase in market share, profitability, and productivity.
Human interaction model: focused on worker motivation increase.
On the other hand, Caves and Porter (1977) developed a structural model focused on the intra-industry competition, in which the primary role of the industry is outlined to develop a suitable strategy. They also identified generic strategies such as cost leadership, differentiation, and focus, which can be used to place the company in a particular industry and build a competitive advantage. However, this stream of thought regards the absence of an analysis of potentially predominant performance factors such as structure, complexity, and dynamism of an organization as a weakness (Calderón et al., 2010).
Literature has developed some patterns to determine possible outcomes for companies based on the organization’s structure and processes. Miles and Snow (1978) mention that these, regardless of their activity, can be adapted to a competitive environment and sustained in it by applying four strategic typologies as presented in Table 1.
Table 1 Strategic typologies
| Competitive strategies | Characteristics |
|---|---|
| Analyzer | It is balanced, generates broad assessment in existing products of raw materials and supplies, development of new products, high-quality controls, and seeks to retain customers. |
| Prospector | It seeks market opportunities, takes risks, is innovative, and creates new needs for customers. |
| Reactor | It relies on context opportunities and threats. Generally, it does not have a specific or long-term plan of action. Defender companies make high-risk decisions and manage innovative processes. |
| Defender | It seeks stability and cost reduction. It focuses more on production control than quality. It does not seek market growth. Strives to build a reputation and keep current clients. |
Source: Adapted from (Miles & Snow, 1978).
Table 2 gathers 22 so-called competitive factors that help understand the previous strategic typologies. These factors are related to the typologies, according to Dess and Davis (1984), Robinson and Pearce (1988), Ordaz, Alcázar, and Valle (2000).
Table 2 Competitive factors
| Quality of the service or product. |
| Brand new products and services development. |
| Business productivity. |
| Cost reduction continuous effort. |
| Rigorous effort in establishing quality control procedures for products and/or services. |
| Price of the product and/or service. |
| Wide range of products and/or services. |
| Effort to achieve an identifiable brand. |
| Influence distribution channels. |
| Efforts to improve the acceptance of raw materials. |
| Innovation in the manufacturing process. |
| Extensive customer service capabilities. |
| Concrete initiatives to achieve a trained and experienced human team. |
| Maintenance of low inventory levels. |
| Improvement of existing products and/or services. |
| Innovation in marketing techniques and methods. |
| Promotion and advertising above the industry average. |
| Ability to manufacture specialized products. |
| Specialization in geographic segments. |
| Products and/or services in high price segments. |
| Efforts to improve the quality of advertising. |
| Efforts to build a reputation. |
Source: Dess & Davis (1984), Robinson & Pearce (1988), (Ordaz et al., 2000)
On the other hand, successful and unsuccessful companies’ performance evaluation has focused on cost-benefits, cash flow, sales, and profits. However, other authors consider that the evaluation analyzes the organization’s leader’s personality and different exogenous factors from the market, the product, or even variables from its economic sector.
Objectively, it is believed that a performance calculation from a profitability perspective of the assets is the most convenient measure since it allows us to determine the organizations’ success based on real and quantitative results. The latter has become a common competitive practice that groups together similar economic sectors that acknowledge the existence of stable differences between strategies and cost-effectiveness created by the influence that a sector structure has upon its surroundings (Porter, 1980).
Consequently, this performance is obtained from qualitative and quantitative indicators that create various business variables (Sánchez and Bañón, 2005; Delaney and Huselid, 1996; Bou-Llusar, Camisón-Zornoza, and Escrig-Tena, 2001). At a quantitative level, performance is measured through financial indicators, ROI (Sánchez and Aragón, 2002), ROA (Carpenter and Sanders, 2002), profitability (Deshpandé, Farley, and Webster Jr, 1993; Dubey, Hill, Jones, Hightower, Kirkland, Roberts and Sreekumar 2005), and market measures such as growth in sales (Mayondo and Farrell, 2003), and at a qualitative level, through the perception of the effectiveness of organizations. Table 3 details the items for measuring the effectiveness perception factors according to the methodology proposed by Gupta and Govindarajan (2000).
Table 3 Items for measuring the effectiveness perception factors
| Sales |
| Growth rate |
| Operating earnings |
| Sales ratio earnings |
| Operating cash flow |
| Return of investment |
| Cost reduction |
Source: Calderón et al. (2010).
3. Methodology
This research was carried out from a mixed approach and a non-experimental, cross-sectional, and correlational design, which was vital to contrast and later on analyze reality with the indicators reported by large, medium, and small rubber and plastic companies in the Bucaramanga Metropolitan Area (BMA). A 2017 report was taken into account for the sampling stage; at that time, 141 companies in the rubber and plastic industry in the BMA were classified as four large, five medium, 17 small, and 115 micro-enterprises. This research targeted SMEs and large enterprises because the “Compite 360” platform had updated 26 organizations’ reports. Both quantitative and qualitative data collection was obtained throughout 2018 since that was the date where the complete 2017 indicator reports were available.
The data necessary to calculate the financial indicators were collected in the first stage, grouping them into profitability, debt, operational, solvency, and liquidity categories. These indicators were chosen because both national and international studies indicate that they are relevant to assess an economic sector (Olaya, Carvajal, Restrepo, and Fernández, 2015) and are held as crucial financial indicators for adequate management (Correa García , Castaño Ríos, and Mesa Callejas, 2010).
The second stage consisted of analyzing the business strategies from the companies’ perception, which is why those companies were contacted, obtaining a significant response of 19 of them, 73% of the total. In this phase, researchers designed a physical questionnaire to measure the competitive factors that would define the strategies. A competitive factor model modified by Zornoza, Simón, and Marqués (2007) was applied. That previous model has been used in subsequent research (Olaya et al., 2015). The questionnaire consisted of three sections: section A that gathers general data of the company, section B that evaluates the competitive factors, and section C that contains the factors of perception of effectiveness, selected for their relationship with financial performance. The items were evaluated through a 1 to 5 scale, where each participant selected the number that identified their organization according to the results obtained in the last year (2017). Based on these results, a cluster analysis was carried out to categorize the companies’ strategic typologies under study.
Finally, in stage number three, an Analysis of Variance (ANOVA) was performed between the clusters found in the previous phase to discover the relationship between the perception of effectiveness and the rubber and plastic companies’ financial indicators.
4. Results
4.1. Analysis: financial statements and indicators
The first part of this analysis began by accessing the Cámara de Comercio de Bucaramanga and gathering the financial reports delivered by the companies in the rubber and plastic sector in 2017. This data corresponded to 26 companies (large, medium, and small) dedicated to the previous practice.
a. Financial statements
As for 2017, the rubber and plastic subsector presented a decrease in assets ($ 54,050 million), liabilities (11,495 million), and equity ($ 42,555 million) compared to 2016, resulting in variations below results presented by the total number of companies in the country that reported continuous information from 2015 to 2017 (Cámara de Comercio de Bucaramanga, 2019). Figure 1 shows the principal balance sheet accounts from the large, medium, and small companies in the BMA.
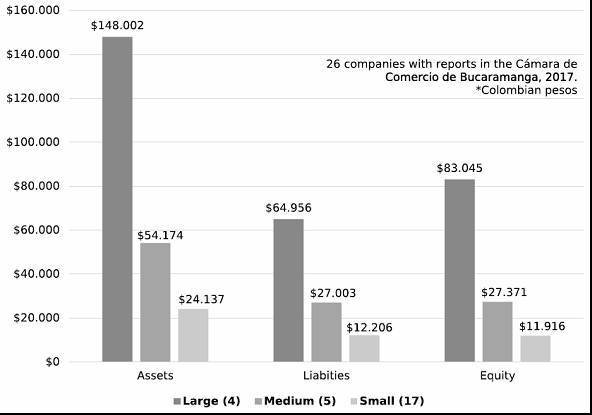
Figure 1 Principal balance sheet accounts of the BMA companies. Source: Compilation based on data collected from the Cámara de Comercio de Bucaramanga, 2017.
To understand the previously represented decrease, researchers analyzed the reported accounts discovering that, regarding assets, it was due to a long-term decrease of $3 million in debtors and $5,944 million in property, plant and equipment between 2016 and 2017. The variation in liabilities is explained mainly by a decrease in current liabilities (especially from the supplier account, representing $7,609 million and financial obligations with $2,185 million). It was possible to observe a significant gap between the gross profit margin and the operating profit margins before the net of taxes, which indicates that the cost of sales represents a high percentage of sales. Additionally, despite the decrease in the cost of sales and the administration expenses, sales did not grow enough to reach the 2016 earnings.
b. Indicators
Table 4 shows the calculation on the indicators after collecting the necessary data.
Table 4 Financial indicator
| Indicator | 2016 | 2017 | |
|---|---|---|---|
| Profitability ratio | Gross margin | 39,37% | 32,21% |
| Net profit margin | 1,23% | -6,81% | |
| Non-operating income | -5,24% | -3,22% | |
| Operating margin | 10,42% | -1,17% | |
| Return on equity (ROE) | 2,17% | -2,41% | |
| Return on assets (ROA) | 1,40% | -1,46% | |
| Debt ratio | Financial leverage | 0,55 | 0,65 |
| Short term liability | 18,15% | 33,90% | |
| Financial debt | 77,91% | 62,86% | |
| Financial sector debt | 0,94% | 7,74% | |
| Short-term debt with suppliers | 4,14% | 6,98% | |
| Debt Ratio | 35,62% | 39,55% | |
| Interest coverage ratio (ICR) | 3,36 | (0,37) | |
| Operating ratio | Assets turnover | 0,27 | 0,33 |
| Inventory turnover | 4,25 | 3,40 | |
| Solvency ratio | Solvency | 2,81 | 2,53 |
| Liquidity ratio | Net working capital (NWC) | $5.646,215 | $2.708,956 |
| Net operating working capital | $946,700 | $1.731,788 | |
| Current ratio | 4,83 | 1,91 | |
| EBITDA | $502,234 | $49,282 | |
| Quick ratio | 4,46 | 1,56 |
The financial indicators were calculated with the financial statements in thousands of Colombian pesos. Source: Compilation based on data collected from the Cámara de Comercio de Bucaramanga, 2017.
Considering that, from the methodological design, it was defined that the interest indicators for the correlational analysis were ROA and ROE, it was possible to observe a decrease in those indicators in the 2016-2017 period. The decrease for 2017 resulted from lower asset turnover and a lower net margin, a situation that is directly related to the decrease in non-operating expenses. Compared to the 2016 period, there is a significant gap between the gross margin and the operating margin. There is also a notable variation in the operating margin before the net of taxes, which indicates that the costs of sales and the administration expenses are not a significant aspect of the operating income.
As for 2016, the debt ratio was at a 35.62%, and for the following term, it showed growth, reaching a 39.55%, which means that the one related to creditors decreased; in the same period, the financial sector debt and the short-term debt with suppliers increased.
The inventory turnover concerning the previous year had a 0.85% decrease. In the same period, solvency decreased by 0.28%, which indicates that the sector is less solvent compared to the previous year. The current ratio went from $4.83 in 2016 to $1.91 in 2017, observing a decrease that indicates that the sector has fewer resources available to pay off its obligations. It was also possible to perceive a decrease in the quick ratio that prevents the sector from having immediate resources availability, without considering inventories. The net operating working capital presented a reasonably substantial growth, going from $946,700 to $1,731,788 in 2016, indicating that the sector has more resources to carry out its operations. Finally, regarding EBITDA, there was a decrease in the sector’s performance from 2016 ($502,234) to 2017 ($49,282) and a variation of $452,952 million.
4.2. Business strategies and perception of effectiveness
With section B results from the questionnaire, the 22 competitive factors were evaluated, finding the most related factors to the strategies developed in 2017 by each of the companies, as shown in Figure 2.
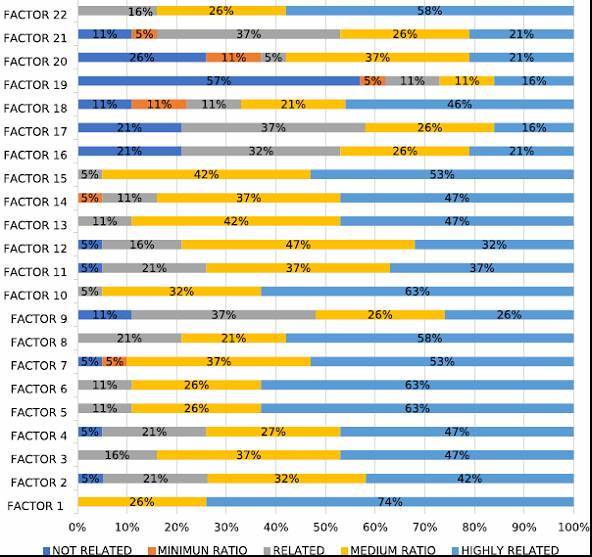
In the first place, we can find the quality of the product and service factor, which was the one that achieved the most positive acceptance (74%). Companies’ efforts to improve the acceptance of raw materials were the second most widely accepted factor by companies (63%). Results also showed that the strategic factors of influence for the improvement of existing products and services stood out with maximum positive acceptance of 53% and a medium acceptance of 42%. In addition, the factor that proposes rigorous efforts in establishing quality control procedures for products and services obtained a maximum positive acceptance of 63%, being these two improvement factors continuously used by companies that stand out for developing analytical strategies for their organization. The lowest accepted factor from the most developed and adopted strategies by companies was the specialization in geographic segments with a maximum positive acceptance of 16%, a medium acceptance of 11%, and a minimum acceptance of 5%.
Having these results and following Dess and Davis model (1984), the factors were classified in each of the strategic typologies, which showed that companies have either an analytical, defensive, or prospective orientation. 50% of the companies have characteristics from the analytical strategy since managers continuously try to keep their products, services, and markets stable and selectively focus their attention on developing each of the previous aspects. 27.27% of companies use defensive strategies since they focus on balancing their products and services, not giving so much importance to developing new products and services; rather, they focus on doing an excellent job with the products they currently handle. While 22.73% of the participating companies affirm that they are prospective since they frequently make changes in their products, services, and markets. These prospective companies focus on innovating new products and services without considering their potential success and are eager to engage in current market needs and opportunities.
Section C of the questionnaire delved into the seven factors that can define the perception of effectiveness from a qualitative perspective to identify the companies’ financial vision. The results’ tabulations are summarized in Figure 3, where it is possible to observe that the factor with the most significant acceptance was operating earnings, with 32% “excellent results” and 42% “good results.” Next, it is the growth rate with “excellent acceptance” (26%), “good results” (48%), and “normal results” (16%). Cash flow and sales factors share “excellent and good results” with a maximum favorability of 69% and a basic acceptance from the remaining 31%.
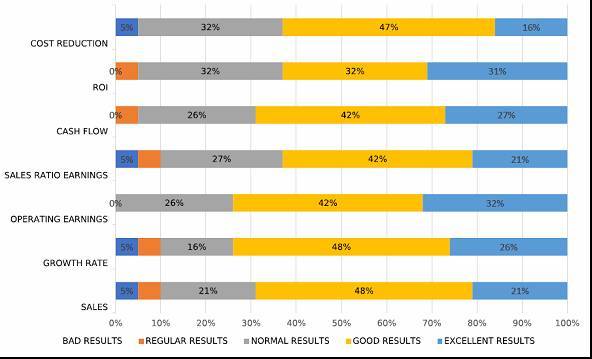
Figure 3 Perception of effectiveness factors of rubber and plastic companies. Source: Authors’own elaboration.
Surveyed participants placed “Cost reduction” as the lowest accepted perception of effectiveness factor with only 16% of favorability and a 32% “normal” indicator for companies. It is crucial to keep in mind that the same factor is widely accepted as “good result” among the BMA rubber and plastic industry.
Based on competitive factors and the perception of effectiveness, clusters were formed from companies that have a similar orientation and some differences between another groups. The previous method facilitates the process of characterizing the strategic typologies of the companies studied. The SPSS software was used with the following tools: distance matrix, cluster history, and dendrogram. The competitive factors from section B were taken as independent variables that seek to explain the results obtained in the seven responses in section C: the factors of perception of effectiveness. Considering these were questions made through the Likert scale, they were defined as ordinal data since they express order in the entrepreneur’s rating. Researchers used the K-means clustering method due to the variables available at the moment and the possibility this method allows to reduce as much as possible the data variance generated by the instrument. This method increases the similarity between groups of data obtained.
First, the initial cluster centers that suggested the existence of three main clusters were obtained. Groupings by competitive factors were observed; in factor number three, the strategic factor was more valued in the first group than in the second and third ones. In factor 7, the strategic factor was more valued in group three than in the first two ones. At this early stage of cluster selection, the competitive factor that presented the most significant variance between groups was the one that values the “product range,” which was the variable less valued by group 3. Subsequently, a cluster history was carried out as presented in Table 5, where 18 stages were required to compare elements that make up each cluster. In its first stage, the model selected the company “case 12” compared to “case 15”, determining a coefficient of 7.0 as the minimum distance so they could be included in the same group. Finally, the model confirmed that cases 1 and 3 showed the most relevant space among groups to classify the clusters; this case’s coefficient result was the highest with a 441.8 value.
Table 5 Cluster history
| Stage | Combined clusters | Coefficient | First appearance | Next stage | ||
|---|---|---|---|---|---|---|
| Cluster 1 | Cluster 2 | Cluster 1 | Cluster 2 | |||
| 1 | 12 | 15 | 7,000 | 0 | 0 | 2 |
| 2 | 10 | 12 | 14,000 | 0 | 1 | 6 |
| 3 | 7 | 11 | 21,500 | 0 | 0 | 8 |
| 4 | 2 | 6 | 29,500 | 0 | 0 | 9 |
| 5 | 3 | 13 | 38,000 | 0 | 0 | 14 |
| 6 | 10 | 14 | 48,500 | 2 | 0 | 11 |
| 7 | 8 | 9 | 62,000 | 0 | 0 | 17 |
| 8 | 7 | 16 | 75,833 | 3 | 0 | 11 |
| 9 | 1 | 2 | 91,833 | 0 | 4 | 12 |
| 10 | 5 | 19 | 110,333 | 0 | 0 | 16 |
| 11 | 7 | 10 | 131,357 | 8 | 6 | 14 |
| 12 | 1 | 17 | 152,607 | 9 | 0 | 13 |
| 13 | 1 | 4 | 179,757 | 12 | 0 | 15 |
| 14 | 3 | 7 | 209,511 | 5 | 11 | 16 |
| 15 | 1 | 18 | 240,111 | 13 | 0 | 17 |
| 16 | 3 | 5 | 276,136 | 14 | 10 | 18 |
| 17 | 1 | 8 | 337,011 | 15 | 7 | 18 |
| 18 | 1 | 3 | 441,895 | 17 | 16 | 0 |
Source: Authors’ own elaboration (SPSS software).
Consequently, the evaluation of each company’s competitive factors was carried out through the correlation coefficient to homogenize the information between groups given the specific strategic orientations that the program determined in the data tabulation process. Subsequently, with the history of interactions (Table 6), researchers determined the number of times calculations had to be performed by adjusting the variances to obtain the clusters. According to the collected data, two iterations were required to generate three specific strategic groups: analytical, defensive, and prospective.
Table 6 Iterations history
| Iteration | Cluster changes | ||
|---|---|---|---|
| 1 | 2 | 3 | |
| 1 | 4,204 | 3,767 | 4,332 |
| 2 | 0,000 | 0,000 | 0,000 |
| Convergence was achieved due to little or no change to cluster centers. The absolute maximum coordinate difference for any center is .000. The current iteration is 2. The minimum distance between the initial centers is 8.426. | |||
Source: Authors’ own elaboration (SPSS software).
The groups’ final organization was established, allowing the chance to identify how close they are to each other, with a 3.7 distance, which indicates a homogeneous trend among companies that consider the competitive factors as elements that finally make up the strategies. The initial distance between data groups originally provided by the companies was 8.4. The final minimum distance was 3.7, which implies a solid relationship between the companies’ preferences and competitive factors. The proximity matrix with the squared Euclidean distance was obtained from the iterations to establish the maximum and minimum differences between cases in each group Table 7.
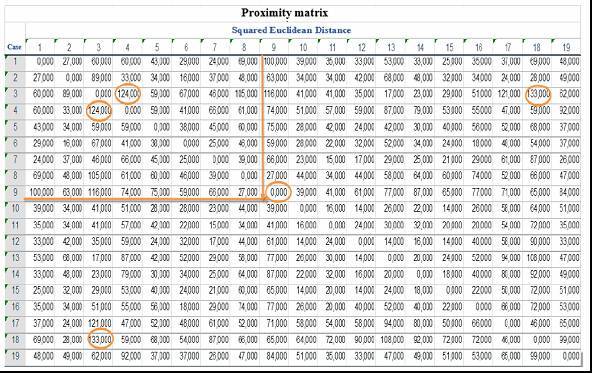
The proximity matrix made it possible to determine the distance between cases and thus establish the companies’ behavior and their strategic orientation. A greater Euclidean distance represents a more significant difference between companies concerning what they believe are the most pertinent competitive factors when applying the strategies they use to define their businesses and activities. The Euclidean distance measured the deviation of the data in relation to the groups’ centers, and therefore, it measured the differences between the strategies’ evaluations. According to this, the most remarkable differences were found between company three and company 18. The Euclidean distance between the strategic factors of these companies was 133. The distance between companies 3 and 4 stands out with a difference of 124 as well as for cases 17 and 3 with a distance of 121. It is relevant to point out that these differences resulted from different strategic orientations the nonrelated groups have. Cases 15 and 10, 15 and 12, 13 and 12, and 12 and 10 have a distance of 14; hence, they were placed in the same cluster.
Subsequently, the number of cases in each cluster was defined, resulting in seven companies with different strategic orientations for cluster number 1, four companies for cluster number 2, and eight companies for cluster number 3. The previous results were obtained even though some clusters assume factors considered familiar to any of the three groups. Competitive factor number 1, “quality of the service or product,” is highly valued by companies, regardless of their cluster. That is why researchers designed a space and included the companies that most valued this factor with those who least valued it in the corresponding cluster.
Finally, the dendrogram was generated, representing the clusters and making a compilation of the cluster analysis process, as shown in Figure 4. It was possible to notice and analyze each of the companies with similar characteristics in their score attributed to competitive factors. The closest cases are companies 12, 15 and 10, followed by companies 10 and 14 with similar values or minimum distances, which made up the first group in cluster number 3.
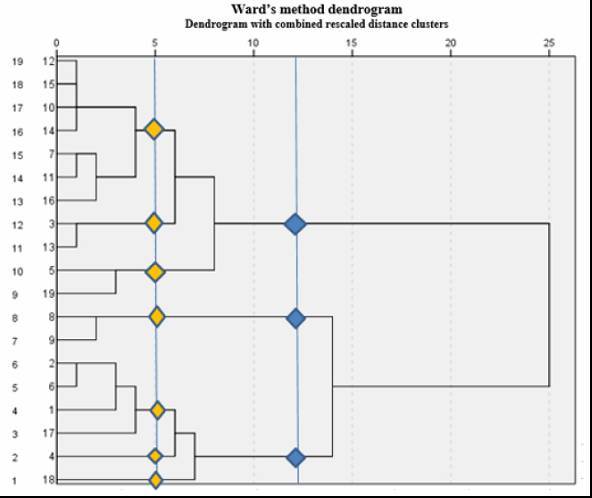
In the initial clustering stages (yellow diamonds), seven distinct groups with different strategic orientations were visualized in stage number 5. The k-means grouping system was responsible for reducing this number of clusters to 3 grouping stages (blue diamonds). Companies number 2, 6, 1, 17, 14, and 18 are in the lower left in the figure, showing the first cluster (cluster 1), companies 8 and 9 (cluster 2), and companies 12, 15, 10, 14, 7, 11, 16, 3, 13, 5, and 19 represent the third cluster (cluster 3).
In summary, it was possible to obtain three clusters, which indicates that the strategies chosen by the companies are three: analytical strategies, defensive strategies and/or prospective strategies. This determination was possible after reviewing the relationship between factors and the characterization of the strategic typologies. It was necessary to reduce the number of clusters obtained during the early stages so to guarantee the shortest distance conditional variation between the companies’ preferences regarding their most valued competitive factors and business strategies.
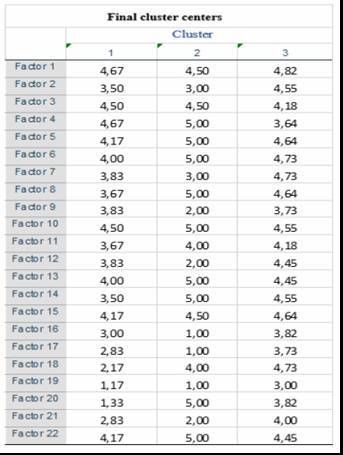
Results were contrasted to the strategic typologies proposed by Miles and Snow (1978), verifying the acceptance degree of the strategies in the cluster center. Each group’s highest values will be taken as a deciding factor to achieve each cluster’s characterization. Table 8 summarizes the final cluster centers. Factor number one, “quality of the service and product,” factor number five, “quality control procedures,” and factor number 15, “improvement of existing products and services” from cluster number three, are part of a competitive analytical strategy. On the other hand, factor number four, “cost reduction,” factor number six, “price of the product and service,” and factor number 10, “acceptance of raw materials,” from cluster number one, are part of a competitive defensive strategy. Finally, factor number 13, “trained and experienced human team,” and factor number 22, “reputation” from cluster number two, are part of a prospective competitive strategy
4.3. Analysis of variance between financial indicators and perception of effectiveness
To determine the relationship between financial indicators and perception of effectiveness, an ANOVA was performed. Researchers compared the perception of effectiveness factors with the financial indicator factors. The null hypothesis (Ho) was defined: “the perception of effectiveness factors are the same for all financial indicators” and the alternative hypothesis (Ha): “there are differences between the perception of effectiveness factors and the financial indicators.” The decision was made based on the F value (Fisher) and the significance level alpha (α). The null hypothesis will be accepted based on the following criteria: if p≥ α, or if p≥0.05 (Table 9).
Table 9 ANOVA
| Sum of squares | DF | Root mean square | F | SL | ||
|---|---|---|---|---|---|---|
| Assets Turnover | Among groups | 0,087 | 2 | 0,044 | 0,155 | 0,858 |
| Inside groups | 4,497 | 16 | 0,281 | |||
| Total | 4,584 | 18 | ||||
| Debt Ratio | Among groups | 152,522 | 2 | 76,261 | 0,342 | 0,715 |
| Inside groups | 3568,988 | 16 | 223,062 | |||
| Total | 3721,510 | 18 | ||||
| External Leverage | Among groups | 45,537 | 2 | 22,769 | 4,230 | 0,034 |
| Inside groups | 86,118 | 16 | 5,382 | |||
| Total | 131,655 | 18 | ||||
| Internal Leverage | Among groups | 3,528 | 2 | 1,764 | 1,788 | 0,199 |
| Inside groups | 15,787 | 16 | 0,987 | |||
| Total | 19,315 | 18 | ||||
| Return on Equity | Among groups | 3,018 | 2 | 1,509 | 8,221 | 0,004 |
| Inside groups | 2,936 | 16 | 0,184 | |||
| Total | 5,954 | 18 | ||||
| Return on Assets | Among groups | 1,096 | 2 | 0,548 | 0,433 | 0,656 |
| Inside groups | 20,251 | 16 | 1,266 | |||
| Total | 21,347 | 18 | ||||
| Operating Margin | Among groups | 0,024 | 2 | 0,012 | 3,212 | 0,067 |
| Inside groups | 0,060 | 16 | 0,004 | |||
| Total | 0,085 | 18 | ||||
Source: Authors’ own elaboration (SPSS software).
5. Discussion
Based on clusters’ results, the strategic orientation carried out during data tabulation was verified according to the information from the surveys. This characterization process initially sought to confront the strategic orientation proposed by Miles and Snow (1978) and later on compare it with the final cluster centers. The results are summarized in Table 10.
Table 10 General w
| Competitive strategies | General characteristics |
|---|---|
| 1. Defensive strategies 31.5% of companies | Strategic reduction of their markets for a stable domain |
| Limited production of products focused on a specific market segment. | |
| Efforts to reduce production costs to achieve competitive prices with high-quality products that would help to achieve high reputation. | |
| Limited product development, establishing itself in its market niche. | |
| Enjoys handling highly efficient technology in its production stage until its final distribution. | |
| Strictly controls the organization in production and costs, seeking to guarantee efficiency. | |
| 2. Prospective strategies 10,5% of companies | Strives to obtain and take advantage of new products and market opportunities. |
| It is essential to maintain a high reputation as innovators in developing new products and markets regardless of profitability. | |
| 3. Analytical strategies 58% of companies | Minimize risk while maximizing the opportunity for profit. (A combination of prospective and defensive strategies). |
| It is balanced looking for new products and market opportunities while maintaining its products and customers. | |
| Income is stable. | |
| It is innovative in products and the market, but ensuring its profitability. | |
| It is highly organized and handles high levels of standardization, ensuring profitability. | |
| Handles strict quality controls. | |
| It is flexible, seeks to satisfy and retain customers. |
Source: Authors’ own elaboration.
Subsequently, when comparing the three clusters formed during the cluster analysis with the financial indicators of each case (operating margin, asset turnover, leverage, ROA and ROE), researches accepted the null hypothesis and rejected the alternative one for assets turnover (0.858), debt ratio (0.715), internal leverage (0.199), return on assets (0.656) and operating margin (0.067), since in each of these cases the significance level is more than 0,05, therefore, the strategies adopted do not influence the results obtained by the entrepreneurs. Whilst, in the case of external leverage (0.034) and return on equity (0.004), the results were less than 0.05, which is why researchers rejected the null hypothesis and accepted the alternative one that proposes that there are differences between some of the factors of effectiveness caused by the development of strategic competitive factors, which indicates that the strategy preferred by entrepreneurs is related to previous variables.
6. Conclusions and recommendations
The research focused on discovering and determining the strategies adopted by small, medium, and large rubber and plastic companies of the Bucaramanga Metropolitan Area (BMA) during 2017. The selection and grouping of competitive factors originating from the surveys allowed establishing that the strategic orientations followed by companies can be analytical, defensive, and prospective. According to entrepreneurs, the most important competitive “analyzer” factor is the quality of the product and service, whereas the most prominent competitive “defensive” factor is efforts to improve raw materials’ acceptance. The perception of effectiveness factors that entrepreneurs used to measure and analyze the results from their activities and businesses are related to their most relevant indicators: sales, growth rate, operating profit, and cash flow.
With the cluster analysis, it was possible to determine the companies’ strategic orientation and group them into three distinct clusters:
58% of companies have an analytical strategic orientation.
31.5% of companies have a strategic defensive orientation.
10.5% of companies have a prospective strategic orientation.
These results differed from what was registered from the qualitative data where the entrepreneurs were classified as follows: 50% analytical, 27.27% defensive, and 22.73% prospective. This difference between the cluster analysis and the data collection instrument results is a consequence of entrepreneurs not being informed about which were the most significant factors for each strategy in order to achieve greater accuracy in the information provided by the participants in regards to knowledge and application of business strategies and competitive factors.
The study of the effects of business strategies on the rubber and plastic industries’ financial performance tried to confirm the existence of a relationship between the competitive factors that make up business strategies, the perception of effectiveness factors, and the financial indicators. Researchers discovered the effectiveness factors that most differentiate the clusters by carrying out an Analysis of Variance (ANOVA) on those groups. On the other hand, the operating margin was the most accepted factor by the entrepreneurs concerning positive results in 2017, while the least valued factor was the growth rate. It was possible to determine that business strategies do not influence asset turnover, debt ratio, internal leverage, return on assets, or operating margin. In contrast, the business sector’s strategic typologies do influence the external leverage and the return on equity. From now on, one could begin to delve into financial indicators specifically, monitoring and tracking each of the clusters, defining more appropriate action routes for the strategies found, and giving continuity to industrial growth, anticipating the changes in the environment and the market.
Finally, this inquiry could be tested on other industrial sectors or from a broader geographical scope that facilitates the analysis of the sectoral behavior from both a quantitative and qualitative perspective. The latter would allow making decisions based on the real reported information, benefiting business people and the sector in general on strategic lines of action.

