


 English (pdf)
 Article in xml format
 Article references
 Send this article by e-mail
 Cited by SciELO
  Cited by Google
  Similars in
SciELO
Similars in
SciELO  Similars in Google
 Permalink
1. Introduction
Research conducted since the 1950s in the field of capital budgeting (henceforth, CB) have highlighted the significance of project evaluation and the tools used to that end (Dean, 1952; Gitman and Forrester, 1977; Arnold and Hatzopoulos, 2000; Ryan and Ryan, 2002) as this process allows budget execution to be prioritized, based on profitability, cost, and resource availability (Verbeeten, 2006).
Despite advances in the financial theory used for CB preparation such as real options, the Weighted Average Cost of Capital (WACC), the Capital Asset Pricing Model (CAPM), Beta analysis, the Internal Rate of Return (IRR), the Net Present Value (NPV), and the Investment Recovery Period (IRP), among others (Arnold and Hatzopoulos, 2000; Brounen, De Jong, and Koedijk 2004; Verbeeten, 2006; Bennouna, Meredith, and Marchant, 2010; Maroyi and Poll, 2012; Singh, Jain, and Yadav, 2012), the procedures firms follow when preparing it evolve slowly, revealing a gap between theory and practice (Gitman and Forrester, 1977; Bennouna et al., 2010), especially in both emerging economies and some BRICS economies (Maroyi and Poll, 2012; Singh et al., 2012).
Correspondingly, until now most of the research works have focused on how large firms and / or those listed on the stock exchange carry out CB. (Gitman and Forrester, 1977; Bruner, Eades, Harris, and Higgins, 1998; Bennouna, et al., 2010; Rigopoulos, 2015), overlooking in their analysis non-listed small and medium-sized companies -which have greater difficulties when defining it. Besides, none of these works has examined whether there is a difference in the way such budgeting is carried out in family 1 and non-family businesses (henceforth, FB and NFB ), an important aspect considering that FBs: (i) represent over 66 % of all businesses worldwide, account on average for 60 % of employment, and contribute on average 67 % to GDP (Family Firm Institute, 2014) 2; (ii) these companies place great value on Socioemotional Wealth (SEW), defined as those non-financial aspects that are key to these organizations (Gómez-Mejía, Haynes, Núñez-Nickel, Jacobson, and Moyano-Fuentes, 2007), which could influence how their CB is determined.
On the other hand, although researched CB-related topics include the use and calculation of the discount rate (Gitman and Forrester, 1977; Bruner, et al., 1998) and viability indicators (Gitman and Forrester, 1977; Perlitz, Peske, and Schrank, 1999, Bennouna, et al., 2010; Rigopoulos, 2015) few studies make a distinction between the CB procedures followed by firms when conducting expansion, replacement, merger and acquisitions projects, except for Brigham (1975) and Graham and Harvey (2001), where those procedures are singled out, although only for some of these types of projects.
Regarding the discount rate, several studies have investigated the rate used by firms to assess the viability of their projects (Block, 1999; Arnold and Hatzopoulos, 2000; Bennouna et al., 2010), mainly the use of the WACC and / or the cost of equity (henceforth CE). However, many of those studies neither deal with how it is calculated (Block, 1999), nor inquire whether any type of adjustment is made for additional risks, for example, size (Banz, 1981; Fama and French, 1993), and if they do, they rarely look into the type of adjustment made (Bruner et al, 1998; Hermes, Smid, and Yao, 2007; Nurullah and Kengatharan, 2015).
Moreover, other research studies have generated controversies around the calculation of the CE through the CAPM, proposing either adjustments to it or none at all (Fama and French, 1992; Lessard, 1996; Damodaran, 2003; Estrada, 2007) including, for example, adjusting for size premium or size effect (Banz, 1981; Fama and French 1993, Ibbotson Associates, 2003; Asness, Franzzini, Israel, and Moskowitz, 2018). However, the methods that firms use when calculating that adjustment have been studied sparsely.
Similarly, authors such as Kengatharan (2018) raise the need to assess the influence that CFOs´ knowledge, the incentive structure, the allocation of decision rights, and financial structure may have on CB practices, thus providing a focus for this proposal given that these aspects are covered when the differences between FB and NFB are established.
Consequently, the main aim and contribution of this research is to identify and analyze the implications of the CB techniques relating to the use and calculation of the discount rate that are implemented by large, medium, and small companies, with emphasis on the cost of equity -adjusted for size premium- and on how the latter is calculated by means of differentiating the procedure used in FB and NFB and project types.
This proposal is structured in six sections as follows: first, the introduction; second, the literature review, third, the methodology; fourth, the study results; fifth, the discussion of the result, and finally the conclusions.
2. Literature review
2.1. Discount rate in capital budgeting
CB is the process of identifying investment projects in order to maximize shareholder value (Dayananda, Irons, Harrison, Herbohn, and Rowland, 2002) and it is linked to investments in long-term assets (Brickley, 2006). Risk is an important factor that should be analyzed within this process (Brigham and Ehrhardt, 2002) as it is introduced by some CFOs via the discount rate (Graham and Harvey, 2001) and is calculated differently among firms due to aspects such as size, their participation in international markets and public listing.
In this respect, studies conducted in large and small companies in the United States show the progress in the use f techniques such as the CAPM, going from 6 % to 73.5 % in a 26-year span (Brigham 1975; Bruner et al.,1998; Block 1999; Graham and Harvey, 2001). Conversely, Arnold and Hatzopulos (2000) noted in their study involving 300 companies from the United Kingdom that only 16 % of large companies and 8 % of medium-sized companies use the CAPM as a discount rate, while Brounen et al. (2004) indicate it is used by only 55.6 % of the firms surveyed in the Netherlands, and it is not as widely used in other countries. A similar picture emerges in China, where according to Hermes et al. (2007), 65 % of 300 listed and unlisted companies use it.
In the case of emerging economies and some BRICS, the use of stylized techniques for calculating the discount rate is also limited. According to Batra and Verma (2017), only 33 % of 500 companies listed on the stock market use the CAPM, akin to Maquieira, Preve, and Sarria-Allende (2012), who concluded in their study that only 38 % of companies use it.
Despite progress on the use of the CAPM in some economies, the same is not true for adjustments made to it on account of additional risks. In the case of size premium adjustment, although the model has been criticized since Banz,(1981), research on it has been scarce. For example, Graham and Harvey (2001) found size adjustments are made by 14.57 % of firms, a fact later confirmed by Brounen et al. (2004), who indicated said adjustment is carried out in the countries studied and is greater than that made by American firms. This reality shows that size adjustment to the CAPM not only pertains to small companies in emerging economies (Table 1).
Table 1 Firms that use CAPM and add risk adjustment
| Author | Unit of analysis | Country | % of the sample that uses CAPM | % of the sample that makes risk adjustments to the CAPM | % of the sample that adjusts CAPM for size premium |
|---|---|---|---|---|---|
| Bruner et al. (1998) | 27 high-prestige corporations, 10 financial advising leaders | USA | 81 of firms and 80 advisors | 26 firms, 0 of financial advisors | N/A |
| Graham & Harvey (2001) | 392 financial managers of main large and small firms | USA | 73.5 | 34.29 | 14.57 |
| Brounen et al. (2004) | 313 large and small public and privately owned firms | UK, The Netherlands, Germany and France | 47.1 in UK, 55,6 in The Netherlands, 34 in Germany and 45.2 in France | 27.3 in UK, 15.4 in The Netherlands, 16.1 in Germany and 30.3 in France | 21.88% in UK, 17.02% in The Netherlands, 9.91% in Germany and 23.64% in France |
| Maquieira et al. (2012) | 290 small and medium-sized non-listed firms from Latin America | Argentina, Chile, Colombia, Ecuador, Peru, Uruguay, Venezuela and others | 38 | 24.6 | N/A |
| Hanaeda & Serita (2014) | 214 small and large firms from Japan stock market | Japan | 49.4 | 8.6 | N/A |
Note. N/A indicates the studies were not queried for adjustment by size premium.
Source: Authors’ own elaboration.
2.2. Cost of equity from CAPM in asset valuation
Sharpe’s (1964) CAPM model is one of the most used to determine CE (Bruner, et al., 1998; Pereiro and Galli, 2000; Brounen, et al., 2004; Nurullah and Kengatharan, 2015). However, several authors have raised a series of criticisms of this model. For instance, Banz,(1981) pointed out additional important factors for determining the price of the expected return and the market risk of an asset are not considered by the model in proposing a simple linear relationship between them; he also argued market inefficiency can lead to an incorrect model specification. On the other hand, Fama and French (1992) point out that asset returns are not adequately explained by Beta while Dickson and Giglierano (1986) argue it cannot be used in new ventures because the information from the statistical distribution of returns is not available a priori. Based on the criticisms, a series of models derived from the original CAPM are proposed, adding a country risk premium (Damodaran, 2003), different unsystematic risks such as shareholding, illiquidity and size (Pereiro and Galli, 2000) or incorporating Beta adjustments (Lessard, 1996; Estrada, 2007).
Regarding size, studies applied in emerging and developed economies show the existence of a size effect, considered in the asset valuation models (Asness, et al., 2018) currently developed (for example, Fama and French, 2015). In this sense, Banz’s (1981) findings acknowledge it, highlighting that the NYSE-listed stocks with the smallest capitalization obtain higher average returns than stocks with the largest capitalization. Chan, Chen, and Hsieh (1985) also confirmed it in the same market as well as Fama and French (1993) in NYSE, NASDAQ and AMEX through their three-factor model. This situation is corroborated in turn by Ibbotson Associates (2003), who found in their study a size premium ranging between 3.7 % and 9.6 %. This effect was also identified by Rubio (1988) with a monthly 3.2 % in Spanish stocks. Finally, more recent studies in the United States and various developed economies in Europe continue to claim that the size premium exists and that it is significant and positive (van Dijk, 2011; Hou and van Dijk, 2018; Asness et al., 2018).
In emerging markets, Fama and French (1998) found a size effect on portfolio returns with equal and different weight in 11 of the 16 countries in their sample. In turn, Rouwenhorst (1999) identifies the presence of a size premium in 7 of the 20 emerging countries that are part of his study, when the assets and the percentage of investment in the countries are equal. Pereiro and Galli (2000) proposed a model of stackable premiums and adjustments built from the CAPM in which a size discount was included, obtaining a 15.8 % premium in Argentina (Table 2).
Table 2 Some studies that evidence the effect of size in asset valuation
| Author | Period of analysis | Market | Value of size premium |
|---|---|---|---|
| Developed markets | |||
| Banz,(1981) | 1936-1975 | Firms in NYSE | 1.52 % month |
| Chan et al. (1985) | 1958-1977 | Firms in NYSE | 12% year |
| Rubio (1988) | 1963-1982 | Firms in Spain Stock Exchange | 3.2% month |
| Fama & French (1993) | 1963 and 1990 | Firms in NYSE-AMEX-NASDAQ | 0.46% month |
| Ibbotson Associates (2003) | 1926-2002 | Firms in NYSE, AMEX, NASDAQ | 3.7%-9.6% |
| Van Dijk, (2011) | 30 years after 1981 | Literature review | It is premature to indicate that size effect disappeared |
| Hou & van Dijk, (2018) | 1963-2014 | Firms in NYSE-AMEX-NASDAQ | 1963-1982: 10% year. 1983-2014: 0.68% a 0.74% month |
| Asness et al. (2018) | 1926 -2012 | 30 industries from the USA and 24 international capital markets | 0.42% for profitability, 0.35%-0.44% for security or payment and 0.20% for growth. |
| Emerging markets | |||
| Fama & French (1998) | 1987-1995 | 16 emerging markets | 8.7% to 14.89% |
| Rouwenhorst (1999) | 1990-1999 | 20 emerging markets | 0.69% to 0.7% |
| Pereiro & Galli (2000) | 1993-1998 | Firms and consultants from Argentina | 15.8% year |
| Barry, Goldreyer, Lockwood, & Rodríguez (2002) | 1985-2000 | 35 emerging markets | 30% annualized |
Source: Authors’ own elaboration.
2.3. Indicators to assess project viability
Although by the end of the 1970s the use of indicators such as the IRP ranked first among small businesses in the USA (Block, 1977), it is evident that this reality changed in such a way that the studies carried out from year 2000 onwards lead us to conclude the greatest advance in CB techniques is the use of indicators such as the NPV and the IRR ( between 74.6 % and 85 %, and between 75.6 % and 76.7 % respectively) by large firms (Graham and Harvey 2001) and medium and small firms (Ryan and Ryan, 2002) from the USA, as also confirmed with 87 % in large and medium-sized companies in the United Kingdom (Arnold and Hatzopulos, 2000) and in Australian companies with 94 % (Truong, Partington, and Peat, 2008).
On the contrary, Brounen et al. (2004) conclude IRP is the most used variable by firms (between 50 % and 69.2 %) while NPV and IRR come in second and third place respectively, similar to Hanaeda and Serita’s (2014) finding in Japan. Authors Singh, et al. (2012) found that although IRR is the preferred technique (78.57%), IRP is the second most used indicator (64.28 %) by non-financial BSE 200 (Bombay Stock Exchange Index). Meanwhile, in their comparative study on the CB practices of Dutch and Chinese firms, Hermes et al. (2007) determined that the former choose NPV (89 % of companies) and then IRP or Pay Back (PB) and IRR, while the latter first use IRR (89 %), then IRP (84 %) and finally NPV (49 % of companies). The drawback of using IRP or PB is the time value of money is not included, and cash flows are also not taken into account after the investment has been recovered (Graham and Harvey, 2001; Bennouna, et al., 2010).
2.4. Family businesses
FBs, defined as those that are controlled by family (e.g., father, mother, sister, brother, son, daughter) where two or more directors are family-related and family members own or control at least 5 % of shares with voting rights (Gómez- Mejía, Lazarra-Kintana, and Makri, 2003), are of great significance worldwide (Schulze, Lubatkin, Dino, and Buchholtz, 2003; Gómez-Mejía, et al. 2007), mainly in emerging economies in which they are considered a motor of the economy (Carney, 2005; Kachaner, Stalk, and Bloch, 2012). They are used as a unit of analysis because of how differently they behave in comparison with other organizational forms and how heterogeneous they are (Berrone, Cruz, and Gómez-Mejía, 2010; Chrisman, Chua, Pearson, and Barnett, 2012). Perhaps the most important FB characteristic concerns SEW, seen as the main interest within this type of businesses and the basis on which several decisions are made (Gómez-Mejía et al., 2007; Berrone et al., 2010). This is the reason why, in an effort to guarantee SEW preservation -through maintaining their identity, the ability to exercise family control and influence, and perpetuating the family dynasty (Gomez-Mejia et al., 2007)-, these firms avoid either hiring staff outside the family (who may be better qualified) or resorting to external credits since this can lead to the loss of company control by the owner family and therefore compromise their SEW (Jones, Makri, and Gómez- Mejía, 2008).
3. Methodology
To achieve the research aims, the methodology takes a positivist-quantitative focus, for which a questionnaire was designed and applied to the firms in the sample. Data were taken from firms from the different economic subsectors from the Department of Antioquia which were registered in the Superintendence of Companies (3227), from which those meeting the following parameters for the period between 2010 and 2015 were selected: (1) Keeping then same business activity (as per CIIU code). (2) Firms that retained their size (large, medium or small), based on Law 905 of 2004 regulating Micro and SMEs. (3) Firms had to be reporting their financial statements for each and every year to the Superintendence of Companies. This resulted in a population of 898 firms, of which 11% are large, 48.3% medium and 40.6% small.
Initially, the questionnaire was sent to the people in charge of evaluating the projects of the firms, which yielded only 9 correctly completed surveys (1% of the sample). Subsequently, the remaining 889 were contacted by telephone, which allowed adding 173 correctly completed surveys (19.3% of the sample), reaching a total sample of 182 usable surveys (20.3% of the contacted sample)
Following Graham and Harvey (2001), the questionnaire questions include variables such as viability indicators, discount rates, CE calculation, adjustments to the cost of capital and differentiation among some type of projects. Besides, in order to meet the objective regarding adjustment by size premium, the questionnaire inquires about the making of such adjustments in the CE, about the methodology used for calculating them (presenting, among other options, the models of Banz, 1981; Fama and French, 1993; Ibbotson, 2003, Pereiro and Galli, 2000) and about the value (or range of values) used as adjustment, differentiating between FB and NFB.
For the data analysis, the SPSS 25 software was used, allowing to create, as statistical technique, contingency tables and standardized residual and corrected standardized residual test, which enabled to analyze the existing relationship between categorical variables. Once standardized, the corrected standardized residuals follow a normal distribution. If they are greater or lower than 1.96 in absolute value, it indicates that there is a 95% reliability that the results are significant at a confidence level of 0.95. Besides, in some relationships, control variables are used to observe the incidence of these variables in the relationship of the categorical variables and define the existence or not of spurious relationships. Listed firms or those from the financial sector were not included in the sample.
4. Results
A characterization of the sample was possible thanks to the statistics obtained from its data. It was found that 11% (20) out of the 182 firms surveyed are large, 54.4% (99) are medium-sized and 34.6% (63) are small; 67.6% are FB and 32.4% are NFB. The sample was also characterized according to whether the firms evaluated their projects or not, as shown in Figure 1. In this sense, the preliminary findings raise the alarm on the way in which firms are making their investment decisions given that only 61.54% (112) of the 182 surveyed firms evaluate their projects (Figure 1A), and the majority are family businesses (70%, equivalent to 78 firms - Figure 1B). As expected, it is large firms (100%, - Figure 1C) that perform their project evaluation most regularly. Additionally, expansion projects are the most evaluated type of projects by FBs (64, accounting for 82% of the projects evaluated - Figure 1D). The same characteristics are evidenced in the NFBs that conduct project evaluation (Figures 1C and 1D). It is worth noting that the majority of firms that do not evaluate their projects or whose projects are evaluated by a third party are SMEs (98.5% of those that do not carry out project evaluation).
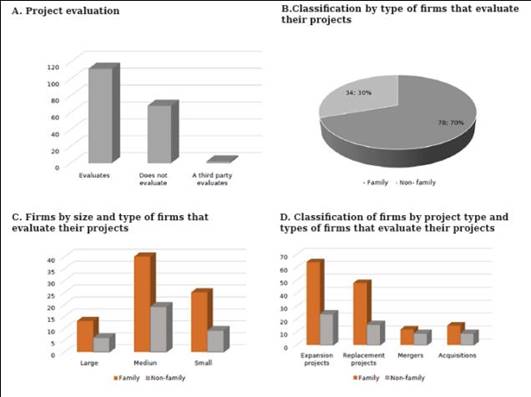
Figure 1 Characterization of firms from the sample Project evaluation B. Classification by type of firms that evaluate their projects. Source: Own elaboration from survey data of 182 firms.
Regarding the discount rate 3, on the whole firms mainly use CE (23.2%), followed by WACC and CE (21.4%) and finally by the use of WACC only (17%), equivalent to 69 firms. When making comparisons based on business type, CE is most used by FBs (24.4%) while 26.5% of NFBs use both WACC and CE.
On the other hand, it is highlighted that 11.6% of firms use a rate suggested by an expert, 10.7% do not use any discount rate and 16.1% use an intuitive rate. In this respect, 9% of FBs do not use a discount rate and 20.5% define it intuitively whereas a total of 20.6% of NFBs do not use one or define it intuitively.
Finally, if the analysis is performed based on project type, and overlooking business type, the rate suggested by an expert, CE, WACC or both are the most used as a discount rate in expansion and replacement projects (74 % and 75% respectively), whereas intuitive rates or lack of a rate are most used for mergers and acquisitions. If company and project types are differentiated, FBs either make no use of rates or use intuitive rates more often than NFBs in three of the four types of projects (Table 3).
Table 3 Discount rates used to evaluate projects
| Type of business | Project type | Total use of discount rate | |||||||||||||
|---|---|---|---|---|---|---|---|---|---|---|---|---|---|---|---|
| Expansion (88) | Replacement (64) | Mergers (21) | Acquisitions (24) | ||||||||||||
| Firm | Firm | Firm | Firm | Firm | |||||||||||
| Family (78 firms) | * | ** | *** | * | ** | *** | * | ** | *** | * | ** | *** | * | ** | *** |
| Cost of equity | 4 | 7 | 5 | 3 | 5 | 3 | 0 | 2 | 2 | 0 | 5 | 1 | 5 | 9 | 5 |
| Does not use rate | 0 | 3 | 2 | 0 | 1 | 2 | 0 | 0 | 1 | 0 | 1 | 1 | 0 | 3 | 4 |
| Intuitive rate | 0 | 9 | 4 | 0 | 6 | 5 | 0 | 1 | 3 | 0 | 2 | 0 | 0 | 9 | 7 |
| Suggested rate | 1 | 3 | 1 | 1 | 3 | 1 | 1 | 0 | 0 | 0 | 0 | 0 | 2 | 4 | 1 |
| WACC | 2 | 7 | 3 | 0 | 7 | 3 | 0 | 1 | 0 | 2 | 2 | 1 | 2 | 8 | 4 |
| WACC - Cost of Equity | 4 | 7 | 2 | 2 | 3 | 3 | 0 | 1 | 0 | 0 | 0 | 0 | 4 | 7 | 4 |
| Non-family (34 firms) | |||||||||||||||
| Cost of equity | 0 | 3 | 3 | 0 | 3 | 2 | 0 | 0 | 1 | 0 | 0 | 1 | 0 | 4 | 3 |
| Does not use rate | 0 | 1 | 2 | 0 | 1 | 0 | 0 | 2 | 0 | 0 | 2 | 0 | 0 | 3 | 2 |
| Intuitive rate | 0 | 2 | 0 | 0 | 1 | 0 | 0 | 0 | 0 | 0 | 1 | 0 | 0 | 2 | 0 |
| Suggested rate | 3 | 1 | 0 | 0 | 1 | 0 | 0 | 0 | 1 | 3 | 0 | 0 | 3 | 2 | 1 |
| WACC | 0 | 2 | 2 | 0 | 1 | 1 | 1 | 0 | 0 | 0 | 1 | 0 | 1 | 2 | 2 |
| WACC - Cost of Equity | 1 | 3 | 1 | 2 | 3 | 1 | 1 | 3 | 0 | 1 | 0 | 0 | 2 | 6 | 1 |
*Large firm **Medium-sized firm ***Small firm. The column “Total use of discount rate” does not differentiate values by project type.
Source: Own elaboration with research data.
In parallel, a negative association relationship between large firms and the defining of the discount rate intuitively was found with the contingency tables as well as a positive association relationship between such firms and the definition of the discount rate on an expert′s advice (Table 4).
Table 4 Relationship of the rate used as discount rate and firm size
| Firm size | Total | |||||
|---|---|---|---|---|---|---|
| Large | Large | Small | ||||
| Discount rate used | Intuitive rate | n | 0 | 11 | 7 | 18 |
| RT | -1.7 | 0.5 | 0.7 | |||
| RTC | -2.1 | 0.8 | 0.9 | |||
| Suggested rate | n | 5 | 6 | 2 | 13 | |
| RT | 1.9 | -0.3 | -1.0 | |||
| RTC | 2.2 | -0.5 | -1.2 | |||
Note. Other relationships with the rest of the categories were identified but are not presented in the table since they are not significant.
Source. Own elaboration with research data.
In respect to how CE 4 is calculated by firms (as shown in Table 5), in general terms firms first use industry′s profitability -IP- (35%; 13% of which are large, 56% medium-sized and 31% small), followed by a method established by the firm itself (22%; 11% of which are large, 67% medium-sized and 22% small) and thirdly the CAPM (17%; 60% of which are large, 30% medium-sized, and 10% small).
Table 5 Models or rates used for calculating cost of equity
| Type of business | Project type | Total models used | |||||||||||||
|---|---|---|---|---|---|---|---|---|---|---|---|---|---|---|---|
| Expansion (56) | Replacement (42) | Mergers (12) | Acquisitions (14) | ||||||||||||
| Firm | Firm | Firm | Firm | Firm | |||||||||||
| Family (48 firms) | * | ** | *** | * | ** | *** | * | ** | *** | * | ** | *** | * | ** | *** |
| CAPM | 6 | 3 | 0 | 1 | 3 | 1 | 0 | 2 | 0 | 2 | 2 | 0 | 6 | 3 | 1 |
| Industry’s profitability (IP) | 1 | 7 | 4 | 2 | 2 | 3 | 0 | 1 | 2 | 0 | 4 | 0 | 2 | 9 | 5 |
| Defined intuitively | 1 | 3 | 1 | 1 | 3 | 1 | 0 | 0 | 0 | 0 | 0 | 0 | 1 | 3 | 2 |
| Established by the firm | 1 | 6 | 2 | 1 | 5 | 1 | 0 | 1 | 0 | 0 | 1 | 2 | 1 | 6 | 2 |
| IP - CAPM | 1 | 0 | 0 | 0 | 0 | 0 | 0 | 0 | 0 | 0 | 0 | 0 | 1 | 0 | 0 |
| IP-Established by the firm | 0 | 1 | 2 | 0 | 1 | 2 | 0 | 0 | 0 | 0 | 0 | 0 | 0 | 1 | 2 |
| IP-Intuitive | 0 | 1 | 1 | 0 | 1 | 1 | 0 | 0 | 0 | 0 | 0 | 0 | 0 | 2 | 1 |
| Non-family (21 firms) | |||||||||||||||
| CAPM | 0 | 1 | 0 | 0 | 1 | 0 | 0 | 1 | 0 | 0 | 0 | 0 | 0 | 2 | 0 |
| Industry’s profitability (IP) | 1 | 2 | 2 | 1 | 3 | 1 | 1 | 1 | 0 | 1 | 1 | 0 | 1 | 5 | 2 |
| Defined intuitively | 0 | 0 | 2 | 0 | 0 | 1 | 0 | 0 | 0 | 0 | 0 | 0 | 0 | 0 | 2 |
| Established by the firm | 0 | 3 | 2 | 0 | 2 | 2 | 1 | 0 | 1 | 0 | 0 | 1 | 1 | 3 | 2 |
| IP - CAPM | 0 | 2 | 0 | 1 | 1 | 0 | 0 | 1 | 0 | 0 | 0 | 0 | 1 | 2 | 0 |
| IP-Established by the firm | 0 | 0 | 0 | 0 | 0 | 0 | 0 | 0 | 0 | 0 | 0 | 0 | 0 | 0 | 0 |
| IP-Intuitive | 0 | 0 | 0 | 0 | 0 | 0 | 0 | 0 | 0 | 0 | 0 | 0 | 0 | 0 | 0 |
*Large firm **Medium-sized firm ***Small firm. The column “Total models used” does not differentiate values by project type.
Source: Own elaboration with research data.
When differentiating by company type, although both FBs and NFBs follow the general trend, mainly using IP (33% and 38%, respectively), CAPM is the second most used rate by FBs (21%) whereas NFBs use a model established by the firm (29%) as a second alternative to calculating CE.
In addition, a positive association relationship is observed between firm size and the use of the CAPM model as per the contingency tables; in fact, this association improves when the Business Type is introduced as a control variable, specifically for FBs. Similarly, a positive relationship was found between small firms and the use of intuitive rates to define CE (Table 6).
Table 6 Relationship between firm size and the model used for calculating cost of equity, controlled by type of business
| Type of business | Methodology for calculating cost of equity | |||||||||
|---|---|---|---|---|---|---|---|---|---|---|
| CAPM | Calculated from IP | Intuitive | Established by the firm | IP-CAPM | IP- established by the firm | IP-Intuitive | ||||
| Family | Size | Large | n | 6 | 2 | 1 | 1 | 1 | 0 | 0 |
| RT | 2.4 | -0.9 | -0.3 | -0.7 | 1.6 | -0.8 | -0.8 | |||
| RTC | 3.1 | -1.2 | -0.4 | -0.9 | 1.9 | -1.0 | -1.0 | |||
| Non- family | Size | Small | n | 0 | 2 | 2 | 2 | 0 | ||
| RT | -0.8 | -0.2 | 1.9 | 0.2 | -0.9 | |||||
| RTC | -0.9 | -0.3 | 2.4 | 0.3 | -1.2 | |||||
Note. The relationships with the rest of the size categories were identified but are not presented in this table because they are not significant.
Source: Own elaboration with research data.
Conversely, only one medium-sized NFB includes it. 6 out of these 9 firms where a size premium is included calculate CE based on the CAPM model, and the addition of such premium is most frequently found in large firms´ expansion projects (Table 7).
Table 7 Does your company adjust by size the model used for calculating the cost of equity?
| Type of business | Project type | |||||||||||||||||||||||||||||
|---|---|---|---|---|---|---|---|---|---|---|---|---|---|---|---|---|---|---|---|---|---|---|---|---|---|---|---|---|---|---|
| Expansion (56) Firm | Replacement (42) Firm | Mergers (12) Firm | Acquisitions (14) Firm | Total adjustment by size premium Firm | ||||||||||||||||||||||||||
| Family (48 firms) | L | M | S | L | M | S | L | M | S | L | M | S | L | M | S | |||||||||||||||
| * | ** | * | ** | * | ** | * | ** | * | ** | * | ** | * | ** | * | ** | * | ** | * | ** | * | ** | * | ** | * | ** | * | ** | * | ** | |
| CAPM | 5 | 1 | 0 | 3 | 0 | 0 | 1 | 0 | 0 | 3 | 0 | 1 | 0 | 0 | 0 | 2 | 0 | 0 | 2 | 0 | 0 | 2 | 0 | 0 | 5 | 1 | 0 | 3 | 0 | 1 |
| IP | 1 | 0 | 0 | 7 | 0 | 4 | 1 | 1 | 0 | 2 | 0 | 3 | 0 | 0 | 0 | 1 | 0 | 2 | 0 | 0 | 0 | 4 | 0 | 0 | 1 | 1 | 0 | 9 | 0 | 5 |
| Established by the firms | 0 | 1 | 1 | 5 | 1 | 1 | 0 | 1 | 1 | 4 | 0 | 1 | 0 | 0 | 0 | 1 | 0 | 0 | 0 | 0 | 0 | 1 | 1 | 1 | 0 | 1 | 1 | 5 | 1 | 1 |
| Non-family (21 firms) | ||||||||||||||||||||||||||||||
| CAPM | 0 | 0 | 1 | 0 | 0 | 0 | 0 | 0 | 1 | 0 | 0 | 0 | 0 | 0 | 0 | 1 | 0 | 0 | 0 | 0 | 0 | 0 | 0 | 0 | 0 | 0 | 1 | 1 | 0 | 0 |
*Adjusts **Does not adjust. L, M and S stands for large, medium-sized and small firm, respectively. The column “Total…” does not differentiate the values by Project type. Besides, models on which no size adjustments are made are not included in the table.
Source: Authors’ own elaboration.
In this way, through contingency tables, it was possible to establish a positive association relationship between firm size and size adjustment, and between the latter and the CAPM model (Tables 8 and 9).
Table 8 Relationship between firm size and adjustment by size
| Firm size | Total | |||||
|---|---|---|---|---|---|---|
| Large | Medium | Small | ||||
| Adjust-ment by size | adjusts | n | 6 | 2 | 1 | 9 |
| RT | 3.1 | -1.2 | -0.9 | |||
| RTC | 3.7 | -1.9 | -1.2 | |||
| does not adjust | n | 8 | 34 | 18 | 60 | |
| RT | -1.2 | 0.5 | 0.4 | |||
| RTC | -3.7 | 1.9 | 1.2 | |||
| Total | n | 14 | 36 | 19 | 69 | |
Source: Own elaboration with research data.
Table 9 Relationship between the model used for calculating the cost of equity and adjustment by size
| Methodology for calculating the cost of equity | |||||||||
|---|---|---|---|---|---|---|---|---|---|
| CAPM | Calculated from IP | Intuitive | Established by the firm | Industry’s profitability-CAPM | IP- established by the firm | IP-Intuitive | |||
| Adjust-ment by size | adjusts | N | 6 | 1 | 0 | 2 | 0 | 0 | 0 |
| RT | 3.5 | -1.2 | -1.0 | 0.0 | -0.7 | -0.6 | -0.6 | ||
| RTC | 4.2 | -1.6 | -1.2 | 0.0 | -0.8 | -0.7 | -0.7 | ||
| does not adjust | N | 6 | 23 | 8 | 13 | 4 | 3 | 3 | |
| RT | -1.4 | 0.5 | 0.4 | 0.0 | 0.3 | 0.2 | 0.2 | ||
| RTC | -4.2 | 1.6 | 1.2 | 0.0 | 0.8 | 0.7 | 0.7 | ||
| Total | N | 12 | 24 | 8 | 15 | 4 | 3 | 3 | |
Source: Own elaboration with research data.
A finding that further shows the gap between theory and practice is the explanation that respondents provide when inquired about the reason for not including the size premium. 43 firms (62.3%) assert they do not know it and 10 firms (6.9%) acknowledge they indeed know the concept yet do not know how to calculate it.
As for the model or method for calculating the size premium and its value, the most used is intuition (56%) while Fama and French’ model (1993), Ibbotson’ model (2003) and the calculation based on models taken from financial institutions are all at the same level (22.2%).
Although large firms using the CAPM are mainly the ones adjusting for size, only one of them makes use of a stylized model to define it, while 6 of the 9 companies that adjust for size (those using the CAPM), make an adjustment that ranges between 1% and 5%.
It is worth mentioning that 12 of the 112 firms that carry out project evaluations but define the discount rate intuitively (8 firms), or through an expert (4 firms), usually adjust this rate for size. However, 5 of the respondents argue not to know what the value used as premium is, while the value ranges between 1% and 10% at the remaining 7 firms.
In general terms, with regard to the use and calculation of indicators for evaluating project viability 5, the most widely used is CBR followed by NPV and IRR (64.3%, 60% and 53% of the projects, respectively); when differentiating by firm type, NFBs mainly use NPV and IRR (67.7% each), which is also true for each project type, except for mergers where CBR is used more (100%). In addition, it was possible to establish a significant, positive association relationship between IRR and NFB; this may be due to the fact that these firms are likely to have more skilled staff in these areas than FBs, where relatives are usually hired regardless of whether they possess the skills required.
In turn, CBR is more often used (in different project types, except for expansion projects) by FBs (60.3%), followed by the use of NPV and IRP (56.4% each). A similar scenario emerges when these firms are categorized by size, disregarding project type. Finally, it was found that 10.7% of the firms calculate the indicators without taking into account the time value of money. (Tables 10 and 11).
Table 10 What indicators does your company use to measure the viability of projects
| Type of business | Project type | |||||||||||||||||||||||||||||
|---|---|---|---|---|---|---|---|---|---|---|---|---|---|---|---|---|---|---|---|---|---|---|---|---|---|---|---|---|---|---|
| Expansion | Replacement | Mergers | Acquisitions | Total use of financial indicators | ||||||||||||||||||||||||||
| Firm | Firm | Firm | Firm | Firm | ||||||||||||||||||||||||||
| Family | L | M | S | L | M | S | L | M | S | L | M | S | L | M | S | |||||||||||||||
| * | ** | * | ** | * | ** | * | ** | * | ** | * | ** | * | ** | * | ** | * | ** | * | ** | * | ** | * | ** | * | ** | * | ** | * | ** | |
| NPV | 8 | 3 | 17 | 19 | 8 | 9 | 4 | 2 | 9 | 16 | 11 | 6 | 0 | 1 | 2 | 3 | 3 | 3 | 2 | 0 | 3 | 7 | 0 | 3 | 9 | 4 | 19 | 21 | 16 | 9 |
| IRR | 7 | 4 | 14 | 22 | 8 | 9 | 3 | 3 | 8 | 17 | 6 | 11 | 0 | 1 | 1 | 4 | 1 | 5 | 2 | 0 | 3 | 7 | 1 | 2 | 7 | 6 | 16 | 24 | 12 | 13 |
| IRP | 9 | 2 | 16 | 20 | 12 | 5 | 4 | 2 | 12 | 13 | 10 | 7 | 0 | 1 | 1 | 4 | 3 | 3 | 2 | 0 | 1 | 9 | 3 | 0 | 9 | 4 | 18 | 22 | 17 | 8 |
| C/B | 7 | 4 | 18 | 18 | 11 | 6 | 5 | 1 | 12 | 13 | 12 | 5 | 1 | 0 | 5 | 0 | 6 | 0 | 0 | 2 | 8 | 2 | 1 | 2 | 9 | 4 | 21 | 19 | 17 | 8 |
| Non- family | ||||||||||||||||||||||||||||||
| NPV | 4 | 0 | 8 | 4 | 4 | 4 | 2 | 0 | 6 | 4 | 3 | 1 | 2 | 0 | 5 | 0 | 0 | 2 | 4 | 0 | 4 | 0 | 0 | 1 | 6 | 0 | 13 | 6 | 4 | 5 |
| IRR | 4 | 0 | 9 | 3 | 7 | 1 | 2 | 0 | 5 | 5 | 3 | 1 | 2 | 0 | 1 | 4 | 1 | 1 | 4 | 0 | 1 | 3 | 1 | 0 | 6 | 0 | 10 | 9 | 7 | 2 |
| IRP | 1 | 3 | 7 | 5 | 3 | 5 | 2 | 0 | 5 | 5 | 1 | 3 | 1 | 1 | 3 | 2 | 0 | 2 | 1 | 3 | 3 | 1 | 0 | 1 | 2 | 4 | 10 | 9 | 3 | 6 |
| C/B | 1 | 3 | 11 | 1 | 4 | 4 | 2 | 0 | 7 | 3 | 2 | 2 | 2 | 0 | 5 | 0 | 2 | 0 | 1 | 3 | 4 | 0 | 0 | 1 | 3 | 3 | 16 | 3 | 6 | 3 |
*Uses the indicator **Does not use the indicator. The column “Total use of financial indicators” does not differentiate the values by project type.
Source: Own elaboration with research data.
Table 11 Relationship between the use of IRR and business type
| Business type | Total | ||||
|---|---|---|---|---|---|
| Family | Non- family | ||||
| Use of IRR | Uses it | N | 35 | 23 | 58 |
| RT | -0.8 | 1.3 | |||
| RTC | -2.2 | 2.2 | |||
| Does not use it | N | 43 | 11 | 54 | |
| RT | 0.9 | -1.3 | |||
| RTC | 2.2 | -2.2 | |||
| Total | N | 78 | 34 | 112 | |
Note. Other relationships with the resto of the categories are identified but are not presented in the table since they are not significant.
Source: Own elaboration with research data
5. Discussion
The informal approach adopted by Colombian companies in the use of CB techniques, for example, the lack of use of a discount rate or calculating it intuitively, leads to their projects either being overvalued or undervalued, resulting in missed investment opportunities or, in the worst case, exposing firms to financial losses. However, defining CB through more objective techniques also implies risks. For example, calculating CB from Market returns exposes investors to using inadequate values as the discount rate, and therefore to possible financial losses, since the information available in Colombia is not enough, is not of quality, or is not disaggregated to enable the use of a CB proxy for most of the different economic activities developed in the country.
Under this scenario, one might think using the CAPM to calculate CE would be a better option; however, despite its widespread use, if implemented in emerging economies in its original version, it would lead to projects being overvalued since it has been designed for developed economies where companies are much larger. In this respect, not adjusting said model for additional risks, such as size, would translate into those risks being undervalued and, consequently, to overestimating the added value of projects. However, it is reassuring to see that the percentage of companies that add the size premium in Colombia is similar to that of the other economies.
But making the adjustment is not enough. In this study, it was concluded firms may be overestimating or undervaluing their projects by determining size adjustment intuitively. However, most of the models employed for this purpose use publicly listed companies which, interestingly enough, are large companies from developed economies (indicating that the size issue is not only a concern for small companies or emerging economies). Along this vein, it is considered more appropriate for companies to use models such as Pereiro and Galli’s (2000) for calculating CE and the size premium since it is built based on companies that are not publicly traded, like most Colombian firms, and whose characteristics resemble Colombian ones.
On the other hand, according to the evidence found in this study, it is worth noting the adjustment is made by large companies mainly, which is contradictory given that SMEs are the firms facing the greatest risks due to their size (Fama and French, 1993; Pereiro and Galli, 2000).
Finally, the preferential use of indicators such as CBR and IRR by family SMEs shows the lack of awareness of the benefits that the implementation of adequate techniques in their investment decisions can generate for the growth and stability of the company. Nevertheless, FBs cannot be judged lightly. Their concern for preserving SEW over financial objectives may provide support for the level of informality in CB practices: in adopting an altruistic stance, they prefer to hire relatives (who may not possess the financial knowledge) rather than qualified external employees, which increases SEW but can affect performance. The fact that CE is used more by FBs as a discount rate actually provides an explanation for their concerns about SEW; they hardly resort to external credits or participate in mergers and acquisitions in an attempt to keep control of the company.
This study is not without limitations. The data cannot be generalized due to the size of the sample, so future studies could improve on this aspect of the research in addition to carrying out the survey in person, if possible, in order to avoid likely biases in the results. Finally, since causal analyses are not determined in this investigation, future research could examine the effect the use of the different CB practices has on performance, and conduct longitudinal analyses that account for the progress in the techniques used in CB.
6. Conclusions
The aim of this research is to generate new evidence on the CB practices of Colombian FBs and NFBs so that the quality of the discussion and research in this field in emerging economies be enhanced; new evidence which can be contrasted with the results obtained by previous studies conducted decades earlier is provided.
In this sense, the use of discount rates within CB techniques shows the gap between theory and practice given that they are either not used or calculated intuitively by a significant percentage of the companies in the simple. This gap is more evident in terms of the use of models such as the CAPM and the WACC, widely disseminated from classrooms, guidebooks and research studies - since the number of (mainly large) firms using them in Colombia today is similar to that indicated by Brigham (1975) 45 years before and is far below Graham and Harvey’s (2001) findings from almost 20 years earlier. As expected, SMEs are the most informal in the use of discount rates and FBs are the firms which resort the most to defining these rates intuitively or simply not using them. Interestingly, FBs are the ones which utilize the CAPM the most when determining the CE model; in addition, expansion and replacement projects are the most rigorously evaluated and either no discount rate or more intuitive rates are used for projects such as mergers or acquisitions.
Size adjustment to CE, a procedure recommended by several authors, is a scarcely observed practice in Colombia, and large FBs carry it out the most in their expansion projects. Despite this, the percentage of firms that adjust for size in Colombia is on par with that of other economies. However, informality prevails when determining the value of said adjustment: most of firms calculating it do so intuitively, evidencing the gap between theory and practice. The fact that most of the companies not implementing the adjustment claim not to have knowledge about the subject, or knowing about it but not being able to calculate the adjustment, serves as confirmation for the above.
The value of the size premium employed by Colombian companies which use the CAPM to define CE is very close to the values recommended by authors such as Rubio (1988) and Ibbotson Associates (2003) for developed economies, which calls for a review when considering the size of Colombian companies.
FBs carry out the least sophisticated CB process in terms of the type of indicators to determine project viability and the way to calculate them, so they overlook the time value of money. Many of the evaluations do not include a discount rate, and although this work identifies NPV as one of the most used techniques in Colombia, it is worrying that the percentage of use of this indicator is far below the percentage of use found almost 20 years ago by Graham and Harvey (2001). Furthermore, the preference for the use of indicators such as CBR and IRR by SMEs shows the financial ignorance of those in charge of project evaluation.

