


 English (pdf)
 Article in xml format
 Article references
 Send this article by e-mail
 Cited by SciELO
  Cited by Google
  Similars in
SciELO
Similars in
SciELO  Similars in Google
 Permalink
1. Introduction
Human Resources and Human capital are fundamental components in an organization, and they are needed to accomplish the goals of the company.
Work absenteeism is a main problem that affects organizations by disrupting its normal functioning, which affects productivity and the whole economy. To understand this problem, workers compensations are a variable to analyze since it could be affecting absenteeism at work. Another variable that affects the level of work absenteeism is equity.
In view of the above, we attempt to explain the relationship between work absenteeism, compensation, and equity between workers within an organization.
The value on this research is in the lack of previous studies searching for these relationships between the 3 variables among workers. However, we can mention Purcell (2011), who stablished ties with incentives and compensations, and line up executives’ behaviors with long term value creation, all this within a sample of executives. The research made by Barroso (2012), links different variables of life quality in relation to each other, where equity and absenteeism are present, but there is no clarity of the type of workers considered on his research.
The sample on this research is made with works on every level; therefore, the results will be a contribution to the subject, and it will be useful to further researches and for management of organizations. Authors such as Dolan, Shuler, Randall, and Valle (1999), Chiavenato (2000), Wayne and Noe (2005), indicate that compensation is related to the workers financial and services perceptions, and these compensations are linked to a personal contribution and work performance. Also, equity is defined as a person’s perception between what he/she gives to the company goals and what is considered a fair compensation; compared with what his/her coworkers give and receive. Regarding work absenteeism, it definitely has negative implications for everyone; the worker is the one who suffer the disease or the problems that force him/her to be away from work; on the other hand, the company lose productivity of this worker; and the society gets involved, because all this delays it´s economic and social grow.
2. Theoretical Framework
2.1. Work Absenteeism
According to the “International Labour Organization” (1991), Work Absenteeism is defined as the lack of attendance of a worker who was supposed to attend, excluding vacation periods and strikes. And work absenteeism due medical reasons is defined as a medical leave period caused by the individual incapacity, except for regular pregnancy or prison.
Chiavenato (2011), states that absenteeism designates the lacks or absences of employees at work, it is the summatory of the periods when the workers are absent at work.
According to Hoffmeister, Vidal, Vallebuona, Ferrer, Vásquez, and Núñez (2014), absenteeism caused by work accidents, or occupational diseases is an issue on the rise, it is calculated that a 5% of the work force is absent on a work day, although this calculations can change between 2 and 10% depending on area, cultural organization, and kind of (p. 21).
According to William (1983) when there is a full employment regime the trend towards absenteeism increases, probably because employees are not afraid of leave the workplace without been dismissed; and, if that happened, there will be other employment opportunities available. Another factor is wage, employees satisfied with their earnings could trigger the increase of absenteeism when earning increase.
García and Martínez (2016) state that no matter the approach companies use to face absenteeism, the first step they should take is to restate how they see absenteeism and finish the existing paradigm where the organization has no influence over general disease absenteeism, as well as acknowledging the fact that emotional wellbeing creates an impact on the organization competitiveness, maybe even more by analyzing the non-traditional ways of work like teleworking (p. 24)
2.2. Compensation
Compensation is a relation of exchange or payment, that might have financial purposes or not; compensation has different meanings for the employee and the employer. For the employee compensation is a payment for the effort and the investment he/she did on education and training. For employers, compensation is an implementation cost. The remuneration includes financial returns and tangible services, plus employee benefits as part of employment relationships (Milkovich and Newman, 1996).
When organizations offer compensations to the employees that satisfy important needs for them, like developing opportunities, face new challenges, and economic bonuses; they feel valued and motivated, which increases the probability of accomplish work schedules, initial budgets, and clients’ needs (Project Management Institute, 2013).
According to WorldatWork (2016), compen-sation is composed by three fundamental elements: direct monetary retribution, its benefits (indirect payment), and intangibles.
Authors Fernández and Baeza (2000), point out as functional targets of compensations, strategic alignment, the compensations interweave directly an organization´s goals and values with the employees´ motivation and performance, therefore compensation is a communication platform between employees and the organization. Workers can understand why they are getting paid, and what is expected from them, acknowledging what the company values by what they are getting paid (Lawler, 1990).
2.3. Equity
According to Méndez-Ramírez (2013), the concept of equity comes from the legal field, the use suggests and implies value and moral judgments for its execution, the concept appeals to at least six substantial components: Value judgment of who applies it (or who acts with equity), Consideration of regulations and/or laws needed to apply it, Equality and willingness on the intension of who applies it, trend towards justice, trend towards equality, trend towards inclusion (p. 9).
Cohen (1989), states that there is equity if there is equality in the “access to advantages”. To get in to the “access to advantages” means that there must be equal opportunities to be able to obtain social status, but mainly to acquire the needed qualifications to compete for a position. In addition, Cohen states that advantage is an individual´s very dissimilar ensemble of desired states, and when resources and wellness are deficient that is a disadvantage. Equity is a cause for satisfaction, while inequality is not (p. 906).
According to Robbins (2005), equity fulfills an important function on motivation. Employees usually compares their contribution to work (effort, competence, experiences, education) and its outcomes (wages, raises, acknowledgment) with the contributions and the outcomes of their coworkers. If this relationship is considered equal, there is an equity state, in other words, same contributions, same outcomes. However, if the relationship seem unequal, it is considered a state of inequality and it can influence in the amount of effort employees put on their work.
Authors Sánchez, Rivera and Velasco (2016), consider that in educational public institutions as trainers of research personnel, they still reproduce and legitimize the patriarchal discourse, since women and men are located and distributed on places with different value, and there are still segregation and discrimination mechanisms in the access and consolidation of their scientific work, as well as sexist practices (p. 112).
2.3.1. Equity Measurement, Gini Index (1912)
. The Gini Index is a measurement of inequality conceived by Italian statistician Corrado Gini (1884-1965) and it is used to gauge the existing inequality on incomes between the citizens of a territory, within a country, but it can be used in any organization or company. The coefficients range between 0 and 1, 0 been maximum equality and 1 maximum inequality. The index has a simple, very intuitive interpretation based on the Lorenz Curve (1905). Its value allows to gauge the area between a Lorenz curve distribution and the perfect equality line as a proportion of the total area located under the mentioned line. It is a way of quantifying a distribution proximity (or distance) regarding the equidistributional state.
It is the most well-known and most used on empirical literature about inequality. Statistically it can be defined as the arithmetic mean of absolute differences of all pairs of income, divided between the double of mean income of distribution.
3. Methodology
This research will be carried out with a predictive longitudinal study, that measures the existing relationship between compensation, equity, and work absenteeism, during a time term. The research uses a quantitative method, not an experimental method because there is no use of variables, estimated models are regression models based on panel data. The target population is the permanent staff of a state university, the inclusion criteria was hired workers with a permanent regime, according to the Chilean administrative working scale (Ministerio de Hacienda, 2005), and employees of all levels were included. The information gathered from every worker was the absenteeism level measured in the number of days absent from work, average income of the worker´s department, and Gini index of the same department.
Work Absenteeism has been defined as a dependent variable, Average Income and Equity through Gini index as independent variables, and as control variable: University´s Work Section and gender. The data base was organized as panel by year and month, since January 2015 until June 2017, and there was a total of N=840 observations.
In relation to the laid-out objectives and the characteristics of this research, we can set out the following hypothesis: If compensation increases, absenteeism decreases, and, on the other hand, if equity increases, absenteeism decreases.
The proposed methodology to assess the hypothesis was a Negative Binominal Regression Model, a generalized linear model, because the dependent variable represents the counted absent days for every cluster generated by the panel. Other options could be multiple linear regression and Poisson regression; nevertheless, the first had the disadvantage that the estimates on this kind of model can be out of the value range of the dependent variable, in addition of not meeting the normality assumption, and the second, despite been the stronger candidate, depends fundamentally on the verification of the Equidispersion assumption (means = variance) (Cameron and Trivedi, 2013).
The Lilliefors (1967) and Jarque and Bera (1987) tests were applied to normality; a chi-squared test to Poisson´s distribution, and a likelihood ratio test (Agresti, 2002) was applied to equidispersion. Group comparison tests were made prior to the regression model trough the Mann and Whitney test (1947) for three quantitative variables regarding gender; and a Kruskal and Wallis test (1952) with the Mann-Whitney test to obtain a comparison between the university´s work sections.
4. Results and discussion
4.1. Descriptive Statistics
The data base is defined by 840 observations consisting of a total number of absenteeism, mean remuneration, and Gini coefficient, of a state university in Chile. These recounts were made by each year (2015-17), month, gender, and work section. The given demographic characteristics can be seen on Table 1.
Table 1 Demographic Characteristics
| Variable | Category |
|---|---|
| Gender | Female; Male |
| Year | 2015; 2016; 2017 (jan-jun) |
| Work Section | Part-Time Academic; Academic; Administrative; Assistant; Manager; Professional; Technician. |
Source: Authors’ own elaboration.
Summary statistics can be seen on Table 2, it shows that the average level of absenteeism is 4,04 ± 5,69 days, with 48 days maximum, which made it a heterogeneous variable. Regarding the other variables, the average income is also heterogeneous. Normality tests on both cases are rejected (p=.000**).
Table 2 Summary Statistics
| Variable | Rank | Descriptive | p(Normality) | ||
|---|---|---|---|---|---|
| Mean | DE | Lilliefors | Jarque-Bera | ||
| Absenteeism (days) | [0 - 48] | 4.04 | 5.69 | .000** | .000** |
| Average Income (thousands of chilean pesos) | [323,5 - 3060,8] | 1170,1 | 727,4 | .000** | .000** |
| Gini index | [0.26 - 0.37] | 0.32 | 0.02 | .000** | .000** |
Source: Authors’ own elaboration.
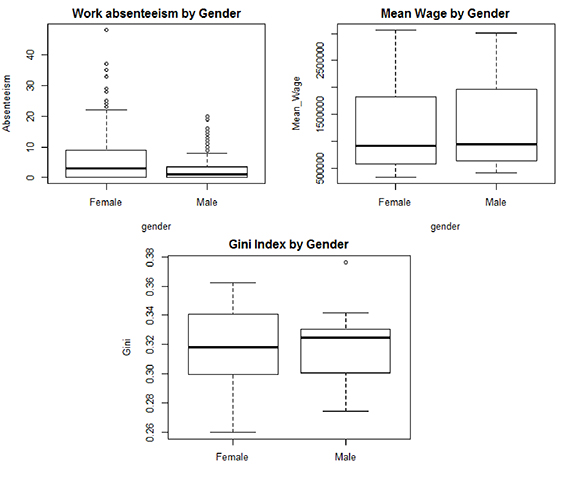
The distribution by Gender (Table 3), reveals evidence of statistically meaningful differences for Absenteeism (p=.000***), but not for Average Income (p=.263) nor Gini Index (p=.361). Specifically, to absenteeism, women are absent an average of 2.94 (05.52-2.58) days a month, more than men.
Table 3 Summary Statistics by Gender
| Variable | Gender = Male | Gender = Female | MW | p | Size of effect | ||
|---|---|---|---|---|---|---|---|
| Media | DE | Media | DE | ||||
| Absenteeism | 2.58 | 3.29 | 5.52 | 7.05 | 102904 | .000*** | 0.535 (Moderate) |
| Average Income (thousands of chilean pesos) | 1187.83 | 731.13 | 1152.46 | 724.00 | 84266 | .263 | 0.049 (No effect) |
| Gini Index | 0.32 | 0.02 | 0.32 | 0.03 | 91410 | .361 | 0.000 (No effect) |
| ** p<.01; ***p<.001 | |||||||
Source: Authors’ own elaboration.
Figure 1 shows the results of this section, both graphics on top show that women have in average greater levels of absenteeism.
As for the Work Section Distribution (Table 4), it shows evidence of statistically meaningful differences for Absenteeism, Amount of Personnel on the Section, and Average Income, but not for Gini Index (χ2(5)=0.00, p=.999).
Table 4 Kruskal-Wallis Test. Variable: Work Section
| Variable | χ2(5) | p |
|---|---|---|
| Absenteeism | 136.45 | .000*** |
| Average Income (thousands of chilean pesos) | 716.86 | .000*** |
| Gini Index | 0.00 | .999 |
| ** p<.01; ***p<.001 | ||
Source: Authors’ own elaboration.
Then, as shown by Table 5, when Mann-Whitney test of post-hoc pairwise comparison is conducted, statistically meaningful differences for Absenteeism are seen on every kind worker, except between (Professionals-Academics) and (Managers-Assistants); for Average income, differences between every kind of worker are shown, except between (Technicians-Administrative), which only differ on an average of $29.600, while the others at least differ on an average of $131.000 (Figure 2).
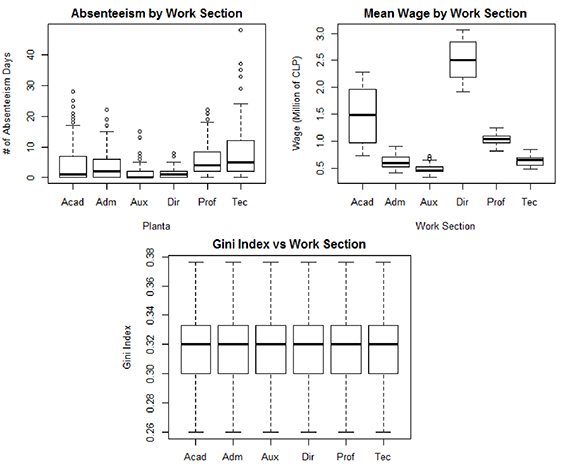
Table 5 Post-Hoc Comparisons. Mann-Whitney
| Comparison | Absenteeism | Average Income (Thousands of pesos) | ||
|---|---|---|---|---|
| Dif | P | Dif | p | |
| Adm - Acad | -0.63 | .916 | -852.3 | <.001*** |
| Assi - Acad | -2.73 | <.001*** | -984.3 | <.001*** |
| Man - Acad | -2.98 | <.001*** | 1025.6 | <.001*** |
| Prof - Acad | 1.42 | .155 | -425.3 | <.001*** |
| Tech - Acad | 3.86 | <.001*** | -823.0 | <.001*** |
| Assi - Adm | -2.10 | .025* | -131.7 | .016* |
| Man - Adm | -2.35 | <.001*** | 1878.2 | <.001*** |
| Prof - Adm | 2.05 | <.001*** | 427.2 | <.001*** |
| Tech- Adm | 4.49 | <.001*** | 29.6 | .884 |
| Man - Assi | -0.25 | .509 | 2009.9 | <.001*** |
| Prof - Assi | 4.15 | <.001*** | 559.0 | <.001*** |
| Tec - Assi | 6.59 | <.001*** | 161.3 | .001*** |
| Prof - Man | 4.40 | <.001*** | -1450.9 | <.001*** |
| Tech - Man | 6.84 | <.001*** | -1848.6 | <.001*** |
| Tech - Prof | 2.44 | .005** | -397.7 | <.001*** |
Source: Authors’ own elaboration
4.2. Negative Binominal Regression Models
On this section, the regression model is estimated based on panel data (cross-sectional and longitudinal). Chi-square goodness of fit allows to confirm that dependent variable distribution is Poisson (p=.501), but the Equidispersion assumption was rejected (p=.000), because its coefficient of variation is quite high (SD/mean >> 1), therefore, the most suitable model is Negative Binominal Regression, belonging to the generalized linear models (Müller, 2000). According to this distribution, it´s understood that E(Y i )= μ i , y Var(Y i )= μ i + (μ i 2 /σ), meaning Var(Y i ) > E(Y i ). This procedure belongs to the exponential family, and it is estimated trough recurrent maximum likelihood. The models to estimate the calculation were made on the Statistical software R with the MASS package (Venables and Ripley, 2002).
To obtain goodness of fit, the omnibus test of likelihood ratio with weighted variance and covariance matrix (VCovHC) and Nagelkerke´s Pseudo R2 coefficient (1991) are calculated, whereas for the variable significance is used the Z statistical. It is also shown that “p” is equal to p-value, it is the probability of false evidence given by the data while it is actually true, in general, values under 0.05 and/or 0.01 are used to acknowledge that a result is statistically significant.
4.2.1. Model description
The regression model has the influence of log-average income and the Gini coefficient, besides of control variable regarding Work Section and Gender. Reference categories has been stablished, Year=2015, Month=February, Section=Academic, and Gender=Female. Models has been stablished as M1, M2, and M3, defined as follows:
M1: Absenteeism ~ln(Aver.Income)+Gini
M2: Absenteeism ~ln(Aver.Income) +Gini+year+month+section+gender
M3: Absenteeism ~ln(Aver.Income) +Gini+month+section+gender
The first model (M1) only considers the log-average income on the number of days of absenteeism, without considering any qualitative characteristic. The second model (M2) also considers the effect of year, month, section and gender, while the M3 model has the annual effect removed.
Table 6 shows the models results. On M1 Model, income doesn´t have a statistically significant effect over the number of absenteeism (exp(β)=2.01, p=.552) with an explanatory power of 0%; then, when qualitative characteristics are added (M2 Model), explanatory power increases a 47% where there is an effect as a whole and it is statistically significative for the Month (D=216.15, p=.000***), the Section (D=495.14, p=.000***), and the Gender (D=98.96, p=.000***); in addition the income, expressed as logarithms, is statistically significant (exp(β)=19.36, p=.000***). As for year, it doesn´t determine increase or decrease of days of absenteeism.
Table 6 Panel Data Model. Response Variable: Absenteeism
| Parameter | M1 Model | M2 Model | M3 Model | ||||||
|---|---|---|---|---|---|---|---|---|---|
| Exp() | Z | p | Exp() | Z | p | Exp() | t | p | |
| (constant) | 2.01 | 0.60 | .552 | 4.5e-19 | -16.14 | .000*** | 4.5e-19 | -10.45 | .000*** |
| ln (Average Income) | 1.05 | 0.59 | .551 | 19.36 | 16.13 | .000*** | 19.36 | 10.70 | .000*** |
| Gini index | 2.21 | 0.35 | .725 | 0.17 | -0.53 | .594 | 0.09 | -0.72 | .470 |
| Year=2016 | 0.97 | -0.41 | .723 | ||||||
| Year=2017 | 0.72 | -1.93 | .053 | ||||||
| Month=January | 1.49 | 2.14 | .032* | 1.51 | 2.17 | .031* | |||
| Month=March | 2.82 | 1.18 | .234 | 2.82 | 1.18 | .234 | |||
| Month=April | 5.12 | 7.89 | .000*** | 5.12 | 7.89 | .000*** | |||
| Month=May | 4.87 | 7.59 | .000*** | 4.87 | 7.59 | .000*** | |||
| Month=June | 7.09 | 9.60 | .000*** | 7.09 | 9.60 | .000*** | |||
| Month=July | 7.84 | 9.37 | .000*** | 7.84 | 9.37 | .000*** | |||
| Month=August | 10.73 | 10.97 | .000*** | 10.73 | 10.97 | .000*** | |||
| Month=September | 4.72 | 6.99 | .000*** | 4.72 | 6.99 | .000*** | |||
| Month=October | 6.91 | 8.76 | .000*** | 6.91 | 8.76 | .000*** | |||
| Month=November | 6.03 | 8.10 | .000*** | 6.03 | 8.10 | .000*** | |||
| Month=December | 6.21 | 8.36 | .000*** | 6.21 | 8.36 | .000*** | |||
| Section=Administrative | 15.06 | 12.91 | .000*** | 15.06 | 12.91 | .000*** | |||
| Section=Assitant | 1.65 | 11.02 | .000*** | 1.65 | 11.02 | .000*** | |||
| Section=Manager | 0.10 | -14.59 | .000*** | 0.10 | -14.59 | .000*** | |||
| Section=Professional | 5.40 | 12.32 | .000*** | 5.40 | 12.32 | .000*** | |||
| Section=Technician | 29.99 | 16.90 | .000*** | 29.40 | 13.05 | .000*** | |||
| Gender=Male | 0.46 | -10.47 | .000*** | 0.44 | -10.39 | .000*** | |||
| N | 840 | 840 | 840 | ||||||
| LR-Statistic | .303 | 32.361 | 34.913 | ||||||
| p | .51 | .00 | .00 | ||||||
| Nagelkerke R2 | .00 | .47 | .47 | ||||||
| AIC | 4117.0 | 3622.8 | 3622.7 | ||||||
| Deviance: | |||||||||
| Year | 0.69 (p=.40) | ||||||||
| Month | 216.15 (p=.00**) | 238.98 (p=.00**) | |||||||
| Section | 495.14 (p=.00**) | 484.05 (p=.00**) | |||||||
| Gender | 98.96 (p=.00**) | 98.22 (p=.00**) | |||||||
Source: Authors’ own elaboration.
With more detail, regarding the variable “month”, all the models have a statistically significant effect to 5% on the absenteeism level, except March (exp(β)=2.82, p=.234). The month of August has the bigger impact on the days of absenteeism (exp(β)=10.73, p=.000***) over the base month (February). Regarding the variable “Section”, all have a statistically significant effect to 5%, where the professionals of the Technical area (exp(β)=29.99, p=.000***) are the ones that contribute the most to the absenteeism level, unlike the ones on the Managing Area (exp(β)=0.10, p=.000***), who decrease the ratio 1/0.1 = 10 times the base section (Academics). Regarding “Gender”, men have a significant minor number of days of absenteeism than women (exp(β)=0.46, p=.000***).
Likewise, on M3 model are very similar coefficients to the M1 model, keeping 47% of the explanatory power.
5. Conclusions
We studied the effect on the Absenteeism, the Average Income, and the Equity variables through the Gini index monitoring Month, Year, Gender, and Section, considering as reference February as month, the year 2015, the female gender and the academic section. Generalized linear models’ techniques has been used, considering count data.
On the period 2015-2017, it has been detected a decrease on the amount of work absences for the educational institution. Besides, it has been determined that the Technical Areal has a greater rate on absenteeism, and the Managing Area has the smaller rate. The results regarding the gender variable comparative, shows that, from the three variables, only the Absenteeism variable reported a moderate size effect, but the Average Income and Equity with Gini Index didn´t.
In addition, the results show that women were absent of work on an average of 3 days more than men. As Carosio (2010) states, women´s integration to socio-productive life hasn´t been followed by systems of social and family joint responsibility on domestic work and care. All of this generates conflict between women´s personal, family and work life, and it leads them to dismiss their professional careers and their productive initiatives. Also, it creates a line of research that allows making a comparison of the levels of work absenteeism between women with children and women without children.
Regarding the conducted comparison, considering the Section variable, it produces statistically significant results to the Absenteeism variables, and the Average income. First it shows statistically significant differences in Absenteeism, highlighting higher differences between Technicians-Assistants and Technicians-Managers, which border on a difference of 7 days of absence. This is explained because, even acknowledging the fact that there are different kinds of leaves or flexible schedules to all the different sectors, workers protect their workstations, because they don´t have higher studies guaranteeing their training, making it harder to get a new job, so their absence doesn´t favor their work development.
On the other hand, regarding the comparison made considering the Average Income variable, the main differences are between Managers-Assistants and Managers-Administrative, with differences that border an average of $2.000.000(chilean pesos), which is large gap. This fact is associated to the country´s current situation, where there is a ratio of 1:8 of difference between the remuneration of a Technician and a Manager, which is no surprise.
According to the models, the average income, expressed as logarithms, creates a statistically significant effect over the absenteeism levels, helping to its prediction. This is associated to Nazario (2006) statement, on the labor market we are living nowadays, it is a necessity to pay attention to something so important and decisive as giving benefits to the personnel (and all the compensatory policy as a whole). Afterwards, when adding gender and section to the model, both have significant effects on absenteeism days, on one hand, men have less absences than women, and on the other, most absences are from technicians and least are from managers, this is confirmed by the statement previously mentioned by Mendoza (2015), where the differences shown regarding the hierarchical level and the impact produced by job satisfaction and psychological climate, lead to think that men are more determined to remain on their jobs because of their position on the other variables. As for women´s absenteeism, it will be mainly related to the level of dissatisfaction and the sensed psychological climate, unrelated to of the hierarchical level they have within the organization.
Regarding Equity (Gini index), it doesn´t have a statistically significant influence on the level of absenteeism, mainly because of the low variability of this index, besides, it is not influenced by gender nor section, meaning, it is not an adequate predictor for the absenteeism level in this context. Barroso (2012) presented a different result, pointing out that absenteeism has a statistically significant correlation with equity. The model generated an important percentage of explanation of absenteeism variation, a 47%, according to the Nagelkerke R2 coefficient. This allows us to point that regression capacity, using as a distributional assumption of the dependent variable as negative binominal, has been effective on its prediction. In summary, to this sample of workers of a higher education institution the average income (expressed as logarithms) is an appropriate predictor for absenteeism level, while Equity, measured through Gini index is not.
Authors consider this study as a contribution for future research associated to the relation between absenteeism, remuneration, and equity, giving a first sight to the subject. The result is considered as a contribution since there is no reference where the relation of three variables is studied.
In summary, average income (expressed as logarithms) is an appropriate predictor for absenteeism level, while Gini index isn´t for this sample of workers of a higher education institution

