


 English (pdf)
 Article in xml format
 Article references
 Send this article by e-mail
 Cited by SciELO
  Cited by Google
  Similars in
SciELO
Similars in
SciELO  Similars in Google
 Permalink
1. Introduction
The personal hygiene products industry is a category of mass consumer products that negatively impact the environment. As Ishchenko, Llori, and Ramos (2017) put it, this type of goods contains components that significantly damage water and ecosystems, turning them into a potential risk to humanity. As a result, globally, there is an increased awareness and concern about climate change due to the different negative impacts on the environment (Raziuddin, Siwar, Talib, Sarah, and Chamburi, 2014). Fortunately, there are groups of consumers concerned about the environment who help find solutions to worldwide environmental damage by opting to purchase ecological products (Mainieri, Barnett, Valdero, Unipan, and Oskamp, 1997). However, over the past decade, as Chen and Chai point out (cited in Joshi and Rahman, 2015, p. 128), “consumer consumption of goods and services has increased tremendously worldwide, leading to the depletion of natural resources and severe damage to the environment.” In fact, the way consumers shop, store, transport, consume personal care products, and then dispose of them is not environmentally sustainable (Grunert, 2011). Transforming the Colombian consumers who buy their personal hygiene products in hard-discount stores requires forming knowledge about their current behavior, attitudes, and intentions to create initiatives capable of converting their buying behavior into a socially responsible purchase and towards the planet. This research is highly relevant in the business world because it will help understand and comprehend current behaviors so as to develop strategies that elicit the desired behavior that helps solve environmental challenges. From a practical perspective, the results can be multi-purpose; firstly, to understand the relationship between individuals’ ecological practices and their intention to buy personal hygiene products under a responsible consumption framework across the different segments identified, in order to begin to create a group of consumers more intelligently behaved that exerts a positive impact on the environment.
2. Literature review
Consumer movements with specific green consumption characteristics have begun to appear in the literature and decided to join large groups to protect the environment. As stated by Zhu and Sarkis (2016, p. 289), they “prefer products that are not likely to endanger human health or damage the environment.” In addition, green consumerism appears, which Sachdeva, Jordan, and Mazar (2015) define as an accessible way to participate in sustainable actions that favor the environment. In other words, this is a new form of consumption that seeks to fulfill the purposes of an ecological purchase. As Chan mentions (cited in Joshi and Rahman, 2015, p. 6), “purchasing ecological products and avoiding products that damage the environment.”
Consequently, this has brought about a new practice known as green marketing, which “consists of actions directed to all consumers and incorporates a broad range of marketing activities designed to demonstrate the firm’s goal of minimizing the environmental impact of its products and services” (Groening, Sarkis, and Zhu, 2018 p. 1850). Another definition by Samarasinghe (2012) says that Green marketing has been used to describe marketing activities that attempt to reduce companies’ negative social and environmental impacts. Likewise, “the world has seen an exponential growth in the number of campaigns promoted by environmentalist groups which focus on the subject of environmental deterioration” (Finisterra and Raposo, 2010, p. 429).
Analyzing segmentation in these new consumers, consumer sustainable or ‘green’ behaviors play an increasingly relevant role in disseminating environmental awareness and reducing greenhouse emissions per capita (Sachdeva, Jordania, and Mazar, 2015). Additionally, consumers are becoming increasingly aware of the negative impact on the planet and the environmental problems they are currently facing. Furthermore, consumers themselves are better informed, educated, and know how to find information on ecological issues (Lindqvist, 2010) for natural resources conservation. These new consumer groups make it necessary to perform a precise segmentation to understand each group’s different characteristics to design sustainable products. However, these environmentally sustainable products represent only a tiny amount of the global demand (Gleima, Smith, Andrews, and Cronin, 2013). In order to further grow the market for these products, companies must ask themselves how these consumers can be described by analyzing the actual reasons or motivations behind adopting these buying behaviors focused on environmental care. This exploratory study precisely describes the characteristics that shape consumers’ attitudes and intentions in order to manage to develop new consumption patterns in hard-discount retail for the selected product category. The different factors that bring these new buyer segments closer to eco-friendly products are described below.
2.1. Shopping behavior
Similarly, Tan, Jonhstone, and Yan (2016) analyze the different characteristics associated with sustainable consumers and the difficulties of consuming green, such as purchasing eco-label products. For example, some people feel that these new trends do not fit their personality or cannot relate to some behaviors attributed to the segment known as “green consumers.” However, as Jahanshahi, and Jia (2018, p. 11) pointed out, there are other perspectives. They conclude that “some consumers do not focus on feeling good about themselves by their ecological behaviors, but rather seek their peers’ acceptance by exhibiting an ecological purchasing behavior more often.”
According to the above, Modia and Patel (2013) conducted research in India to better segment organic consumers, holding the most common variables, such as demographic and psychographic variables, as segmentation reasoning. The results of the India study indicate that “these classic variables are not as effective as the behavioral variables” (Modia and Patel, 2013, p. 85). “Pro-environmental behavior was particularly driven by internal consumer factors (Modia and Patel, 2013, p. 91). From this study, the authors were able to find two types of consumers: active green activists, who engage in “active participation in protests in defense of environmental causes and support for environmental organizations, among other relevant activities” (Modia and Patel, 2013, p. 98). Additionally, this segment undertakes additional efforts in managing environmental resources and does not usually buy products from companies known for their environmental pollution or environmental damage. On the other hand, the authors identified passive green activists as those who “prefer to walk rather than use vehicles and carry shopping bags” (Modia and Patel, 2013, p. 99).
2.2. Environmental Knowledge
Through a study in Malaysia, Aman, Harum, and Hussein (2012) were able to identify that inadequate information about ecological purchase intention among consumers is the main impediment for local and international marketers to develop solid business and marketing strategies for green products. Per D’Souza, Taghian, and Lamb (Cited in Aman et al., 2012), environmental knowledge evolves in two ways: a) consumers must be educated and trained to understand the impact of a product on the environment; and b) develop consumer knowledge about the product itself, its production process, to analyze its impact on the environment. According to these results, environmental knowledge and environmental concern are significantly driven by an ecological purchase intention. These findings suggest that the more knowledge consumers have about environmental issues, the more likely they will be to buy a green product. In addition, Cardoso and Schoor (2017) were able to identify that “Knowledge about environmental problems is a very important aspect of this process; without it, it is more difficult for consumers to understand how they can assume an ecological purchase behavior.” (p. 150). These results are similar for Pakistani consumers since “educated respondents have a high positive attitude regarding green products and are ready to buy green” (Ali, Khan, and Ahmed, 2011, p. 225).
Per a study developed in Italy by Carfora, Cavallob, Caso, Del Giudiceb, Viscecchia, De Devitiis, and Cicia (2019), it is crucial to lead consumers to identify with green consumption through education as an essential aspect of their environmental knowledge. That statement is in line with Lee (Cited in Aman et al., 2012), who mentions that environmental concern can be regarded as one of the relevant factors affecting consumers’ ecological purchasing behavior. In addition, Choi and Johnson (2019, p. 152) point out: “the direct influence of environmental knowledge on green products purchase intention indicates that consumers who think of themselves as aware of environmental problems intend on buying green.” Additionally, “this is also associated with economic factors because consumers with a high environmental ability (high in eco-literacy) tend to pay more for green products” (Wei, Ang, and Jancenelle, 2018, p. 236). As a consequence, a socially and environmentally responsible consumer is created and built into their purchasing habits.
2.3. Demographic and Social Factors
Finisterra and Raposo (2010) conducted a research study based on demographic and environmental criteria to identify and group green consumers in Portugal. The findings identified three (3) segments: Green activists: the group with the highest educational attainment and income, and “a favorable position with regards to all environmental aspects, particularly towards green product efficiency, green purchasing behavior, recycling, sensitivity to the economic factor and saving resources”(Finisterra and Raposo, 2010, p. 434); however, this group does not trust big companies’ advertising on environmental care. The second group is the undefined. These people are average-educated, and their income is also average. Furthermore, “they hold very negative positions towards environmental problems, though activists” (Finisterra and Raposo, 2010, p. 434).
The last group identified is the uncommitted. According to Finisterra and Raposo (2010), these are clusters of young people with high educational attainment and a medium-to-high income; however, “they hold very negative positions with regards to some environmental aspects, despite claiming to be knowledgeable on the subject” (p. 435). On the other hand, these activists’ attitude towards recycling is positive; however, like the green activists, they are on the fence regarding large companies’ outreach.
Another example of demographic attributes-based segmentation may be found in the research carried out by Arroyo, Carrete, and Trujillo (2012) that focused on identifying the influence of these factors in a developing country like Mexico. The study found four (4) core segments: A) recyclers: they “hold favorable attitudes towards recycling derived from their knowledge of the benefits it entails, and recognize how serious the environmental problem is” (p. 40). Moreover, they are characterized by being young and having a medium-to-high income. B) non-recyclers: these people share negative attitudes towards environmental problems and recycling; in this segment are middle-aged and older adults with a high or lower-to-middle income. C) the indifferent: “their attitudes indicate a low perception of the benefits of recycling and little knowledge about environmental problems and their social and individual impact” (p. 40). Finally, D) the negligent: in essence, they do not recycle because it is effortful and they are not willing to do it. These findings are similar to those obtained in Lithuania, where 40% of the consumers studied indicated that “they were concerned with environmental issues, yet were too busy to change their lifestyle substantially” (Banytė, Brazionienė, and Gadeikienė, 2010, p. 379). In addition, Gonzalez, Felix, Carrete, Centeno, and Castaño (2015) point out that sociodemographic factors will be ever-present in consumer segmentation in developing countries because in these countries, “consumers display significant differences in terms of gender, age, education, income and status.” (p. 296).
The preceding indicates that, for consumers with green purchasing traits, demographic elements continue to play a fundamental role, as mentioned by Verma (2017, p. 275), who asserts that “some demographic factors, such as age and family income, play an important role in influencing the green consumer behavior.” In addition to using demographic factors such as age and income, Stanley (2015) researched the effects of gender on green product purchasing, according to Stanley (2015), women are a fundamental part of the family, especially in India; therefore, “women should be more engaged in creating a sustainable community” (p. 921).
3. Methodology
A quantitative approach was used to analyze the relationship between consumers’ environmental practices and their purchase intent for personal hygiene products marketed by hard-discount chains. This study defines personal care products as all those goods used in consumer body care: creams, soaps, lotions, shampoo, facial cleansing, deodorants, etc.
Likewise, the study has a descriptive correlational scope due to statistical techniques being used to determine the magnitude of the relationship between both variables. Additionally, a 576-individual sample was calculated using simple random sampling, randomly selected at eight establishments of a hard-discount chain in Bogotá.
The analysis stage used hierarchical grouping coupled with an exploratory Principal Component Analysis (PCA) to project the segments in the dimensions found. This type of procedure has been used in similar investigations as an exploratory method to understand essential customer segments and observe the aspects that are of their interest when making a purchase decision, confirming itself as a valuable tool to explore patterns, similarities, and hidden groupings in the data, an input in shaping a clear idea about underlying relationships (Granato, Santos, Escher, Ferreira, and Maggio, 2018; Gallego and Araque, 2019).
The ad-hoc instrument constructed consists of three blocks: A) sociodemographic variables such as age, gender, educational attainment, and socioeconomic stratum. B) The second is the practices. This construct is divided into purchasing low-consuming light bulbs (light bulbs), the intended use of electronic devices (devices), reusing water (water), separation of waste (separation), using cloth bags (bags), using bicycles for transportation (bicycles), depositing batteries in special bins (batteries), donations and social programs by companies as a decision-making factor (donations). C) Thirdly, where purchase intention is concerned, the block was shaped by questions associated with the acquisition of low-water-consuming cleaning products (reduce), with environmental seals or certifications (seals), products in recyclable packaging or repackaged products (packaging and recharging), products consuming fewer natural resources during production (consume), with natural or organic ingredients (natural), rejection of those tested on animals (test), low environmental impact (protect), and used packaging collected by the company (collection). In the case of the practices, a Likert scale was configured consisting of the categories never (1), sometimes (2), almost always (3), and always (4), while for intention, we used completely disagree (1), disagree (2), indifferent (3), agree (4) and completely agree (5). These scales were validated using Cronbach’s alpha, which yielded an α = 0.67 for practices and α = 0.829 for intentions. The R language version 4.0.2 was used to analyze the Rstudio environment, employing the packages associated with the ACP, hierarchical cluster, and graphics (ggplot2). Additionally, Levene’s test shows equality in variances when the p-value is greater than 0.05 (p> 0.05); thus, we assume that the variances will be different if p <0.05 (Soave and Sun, 2017). On the other hand, homoscedasticity refers to error variance remaining constant within all the contrast groups, meaning goodness of fit for the data (Srinivasan and Lohith, 2017).
4. Results
In characterizing the sample, sociodemographic characteristics such as age, sex, educational attainment, and socioeconomic stratum were analyzed, the findings of which Graph 1 displays.
In general, the predominant consumer age is between 20 and 30 years. Meanwhile, the segments between 30 and above 50 years of age are proportionate in distribution. In terms of gender, women were the majority group with 59%. It was relevant that higher education, including postgraduate studies, reached about 56%, while 26% of the study participants were clustered between elementary education and high school education. Likewise, less than 11% of users belong to strata 1 and 2, while strata 3 and 4 are represented to a greater extent, leaving a 16.2% consisting of higher strata (5 and 6).
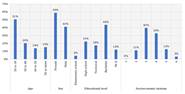
According to the Graph 1, it can be inferred that the most relevant segment of customers of the format being studied consists of men and women between 20 and 30 years of age with professional education and belonging to strata 3 and 4, which socially peaking means they are middle class. However, this assertion should be analyzed in further depth by applying the hierarchical grouping techniques proposed in this study. Below is the score distribution (density function) for the respondents’ practices and intentions.
The Graph 2 represents the shape of the data distribution, specifically, the practice (what the consumer does today in taking care of the environment) and intention variable (what the consumer wants to do to help the environment) in order to account for their behavior. The first instance shows that the practices are distributed between the values 1 and 4, concentrating on scores at 2 and 3, corresponding to the category sometimes and almost always; for its part, the intention is concentrated between 4 and 5, relating to almost always and always. As such, it can be inferred a priori that practices and intention differ from each other. In other words, the respondents “sometimes and almost always” perform actions such as recycling, taking a cloth bag to the supermarket; however, regarding their intention of engaging in more environmentally friendly actions, such as buying products with a green label or products with recyclable packaging, the expected purchase frequency would be “almost always and always.” Therefore, companies that market cleaning products are being afforded a great chance to offer and educate the buyer in sustainable purchasing. Above are some descriptive statistics on these variables indicated in Table 1.
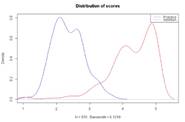
Table 1 Descriptive Statistics
| Item | Practices | Intention |
|---|---|---|
| Mean | 2.36 | 4.26 |
| Confidence interval | 2,32 - 2,40 | 4,20 - 4,31 |
| Minimum | 1 | 1 |
| Maximum | 3.9 | 5 |
| Kolmogorov - smirnov (K-S) | P<0,05 | P<0,05 |
Source: Author own elaboration.
As observed in that distribution, the practices’ mean falls between the sometimes and almost always categories, showing that green actions do not occur recurrently in the analyzed sample. Additionally, for both cases, it was determined that the behavior of the data was non-normal, as confirmed by the KS test that came out below the statistical significance value (p <0.05) - this result confirms the biases observed in Graph 2. In order to deepen the relationship between practices and intention, Pearson’s R correlation coefficient was calculated and yielded the results in Graph 3.
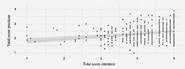
The scatter diagram indicates a low positive relationship between practices and purchase intention, supported by the value of R= 0.26. This means that subjects who scored low in practices will also tend to score low in intention and vice versa. On the other hand, the low magnitude of the correlation puts forth the practices not being consistent with the intentions in some cases; in other words, it translates into subjects who express a positive intention to buy green cleaning products, but their practices show otherwise.
4.1. Hierarchical grouping
Within the statistical grouping procedures, there is a wide variety of techniques that permit identifying segments or clusters that help to understand the core characteristics of a population being studied (Li, Xu, and Luo, 2013); however, determining all the possible arrays of features and elements to form the optimal groupings is a complex task unless using suitable algorithms or methods. From these stand out minimum distance or nearest neighbor, centroid, the grouping of medians, mean between groups, maximum distance or farthest neighbor, and Ward or least variance method (Vilá, Rubio, Berlanga, and Torrado, 2014).
Based on the above, the Ward method was selected for executing the procedure and building the dendrogram, which calculates the distance between the clusters employing the sum of squares between groups based on an ANOVA analysis of variance. This way, the algorithm seeks to minimize said sum within the clusters on all possible partitions obtained. The R programming language was used in order to attain a satisfactory result, specifically the Pvclust package and cluster, which afford simplicity and efficiency in carrying out all these computational calculations (Suzuki and Shimodaira, 2006).
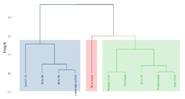
A hierarchical grouping procedure was performed on the basis of the data collected to determine underlying groupings according to sociodemographic variables obtained through the questionnaire, i.e., age, stratum, and education. This technique permits creating subgroups of elements akin to each other from a large set of data; this way, it is possible to make a visual grouping that facilitates comprehension. In this vein, the resulting dendrogram is explained in Graph 4.
The first visible cluster highlighted in blue consists of low strata (1 and 2) and people aged between 30 and 50 years with elementary and secondary education. After that, the procedure conglomerated into another segment under the color green, characterized by the middle (3 to 4) and high (5 -6) strata, aged between 20 and 30 years, and technical or professional degrees for educational attainment. The group over 50 years of age possesses very particular characteristics that had it agglomerated in a different segment apart from the rest, which is very similar to the first cluster.
4.2. Analysis of core component
4.2.1. Green Practices.
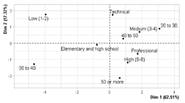
So far, the relationship between practices and intentions has been accounted for; however, it is crucial to understand whether these differ according to consumer sociodemographic characteristics. As such, in order to identify underlying dimensions in the study subjects’ environmental practices, a PCA was conducted for the ten (10) questions that make up this dimension. In Graph 5 is a summary of the two main components found, considering age, educational attainment, and stratum.
Graph 5 shows the two main dimensions, which gather 68.29% of the total variance. Likewise, the placement of the different age groups, stratum, and educational attainment contrasted in the plane can be noted, showing that the youngest, between 20 and 30 years old, with an technical degree and middle stratum (3 and 4) more closely correlate with the second dimension, while adults in low strata (1 and 2) and aged between 30 and 50 with elementary and secondary education are negatively correlated with dimension 1. Next, Graph 6 shows the circle of correlations of the variables associated with the practices so as to understand the groupings.
The circle of correlations (Graph 6) indicates the degree of association in the underlying variables of the practices. Arrow length accounts for correlation magnitude, while the angle in between indicates relationships with other variables. For example, 90° angles indicate no association, while 180° angles will mean negative correlations. In this case, water and bicycle are observed strongly correlated with dimension two. This makes it possible to infer that the subjects in the upper left quadrant of the correlation circle will be more interested in using a bicycle and actions to reuse water in housework. Under that same logic, the consumers in the upper right quadrant are more concerned with turning off electronic devices when they are not being used (devices) and buying domestic products (origin).
Likewise, depositing batteries in specialized bins (batteries), using cloth bags (bag), considering donations, supporting companies’ social programs (donations), separating organic waste, paper, and plastic (separates), reading instructions and expiration date (certify), and purchasing energy-saving light bulbs (light bulb) lean towards the first dimension in a strong correlation. The clusters found (Graph 7) on the PCA dimensions are shown below.
Cluster 1 consists of consumers between 30 and 50 years of age, with elementary to secondary education and from the socioeconomic strata 1 and 2, as the dendrogram indicates in the Graph 7. However, this segment negatively correlates with dimension 1, being to the left side of the 0 value in the central axis. This indicates that these users are not quite interested in or concerned with responsible battery storage, using cloth bags, company donations, separating organic waste, product certification, and purchasing energy-saving light bulbs. However, there is confirmation that the lower stratum seems to consider using bicycles and reusing water in housework. A statistical test is shown next to show the variables that most contributed to the formation of the clusters (Table 2).
Table 2 The input of variables in cluster formation for the ecological practices dimension
| v.test | Category average | Overall average | p-value | |
|---|---|---|---|---|
| Cluster 1 | ||||
| Separates | -2.179 | 2.263 | 2.420 | 0.03 |
| Batteries | -2.228 | 1.993 | 2.124 | 0.03 |
| Donations | -2.515 | 1.838 | 1.899 | 0.01 |
| Bag | -2.696 | 2.658 | 2.820 | 0.01 |
| Cluster 2 | ||||
| Donations | 2.253 | 1.944 | 1.899 | 0.02 |
| Bag | 2.235 | 2.930 | 2.820 | 0.03 |
| Cluster 3 | ||||
| Origin | 2.695 | 2.950 | 2.589 | 0.01 |
| Separates | 2.259 | 2.820 | 2.420 | 0.02 |
| Devices | 2.002 | 2.980 | 2.719 | 0.05 |
Note: v.test assimilated as the Kuiper Test in Rstudio, analogous to the Kolmogorov-Smirnov test for distribution contrasting.
Source: Author own elaboration.
Regarding cluster 1, the variables that most contributed to creating this segment were separates, batteries, donations, and bags. However, this does not mean that its association with these factors is positive; on the contrary, the negative sign of the v.test confirms that these subjects scored less in these categories in respect of the rest of individuals, thus confirming the proposition that these consumers are not interested in this type of environmental aspects. Likewise, the mean in the category reflects the average score of the Likert scale for each variable, identifying donations (1,838) as the least relevant for cluster 1. Meanwhile, the overall average in all cases is higher, which means that these differences between clusters are significant (p-value <0.05).
In that train of thought, the variables that made the most input in forming cluster 2 were donations and the cloth bag, with the positive values of the v.test indicating that indeed there is interest in these components. Of course, other consumer variables are explored in other studies, such as reducing water and electricity consumption and primary classification of waste. Furthermore, the category average is higher than the overall average for these two variables, which is significant (p <0.05). Lastly, the most relevant variables for cluster 3 are origin, separates, and devices, these being the factors that input the most in its construction.
4.3. Purchase Intention
Once green consumer practices were analyzed, the same procedure was carried out for purchase intention, which, as discussed earlier, presents a different behavior among users. As such, the sociodemographic characteristics are shown in the PCA dimensions found (Graph 8).
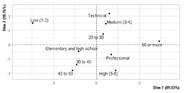
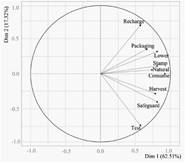
Two main components identified explain 79.83% of the total variance. From the point of view of intentions, there are significant similarities and differences regarding the practices. For example, in the upper left quadrant, the low stratum (1 and 2) continues to correlate positively with dimension two and negatively with dimension 1. The upper right quadrant groups the subjects aged 40 to 50 of a medium socioeconomic stratum (3 and 4) and associate educational attainment. On the other hand, the lower right quadrant contains high-stratum professionals (5 and 6) of 50 years of age and above. Lastly, in lower left quadrant consists of consumers between 30 and 40 years of age. The correlation graph displays the most important variables for each of these dimensions (Graph 9).
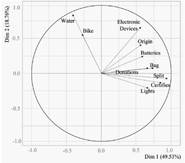
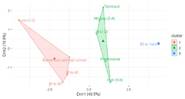
In this case, variables such as reload, packaging, reduce, and seals positively associate with dimensions 1 and 2 simultaneously. On the other hand, natural and consuming are not significant inputs to component 2, whereas recollection, protection, and testing positively correlate with dimension one and negatively with dimension 2. A joint analysis of the sociodemographic characteristics of PCA dimensions (Graph 8) and the circle of correlations shows that consumers between 30 and 30 years of age of a medium socioeconomic stratum (3 and 4) are more concerned with repackaging (recharge) and recycled packaging (packaging). On the other hand, of high-stratum (5 and 6), professional consumers are more interested in options such as cosmetic products being tested on animals (testing), avoiding products harmful to the environment (protect), and buying those that use recollection and reuse (recollection) processes. Regarding the clusters identified through the PCA dimensions, Graph 10 shows the clusters found (Graph 10).
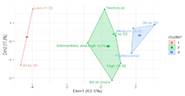
Each group described above possesses different environmental concerns that must be considered when developing product innovation and communication strategies. Cluster 1 consists of low-stratum individuals aged between 30 and 40 who do not concern themselves with the ecological issues of the rest of the groups. This group is not representative for this study. On the other hand, cluster 2 consists of high-socioeconomic-stratum consumers between 40 and 50 years of age and above with educational attainment of elementary, secondary, and technical. Their concern focuses on aspects such as testing on animals (testing), reducing products’ environmental impact (protecting), the possibility of reusing containers (recharging), and using recycled packaging (packaging), characteristic of responsible consumption given their placement in the plane. Finally, cluster 3 is more correlated with dimension 1, considering factors such as reduced water consumption for cleaning products (consume) and lesser use of natural resources (natural).
Below, Table 3 shows some statistics concerning the variables that made the most input to each cluster.
Table 3 The input of variables to the formation of the cluster in the dimension of purchase intention
| v.test | Category average | Overall average | p-value | |
|---|---|---|---|---|
| Cluster 1 | ||||
| Recollection | -2.066 | 4.000 | 4.163 | 0.039 |
| Seals | -2.187 | 3.885 | 4.038 | 0.029 |
| Protect | -2.579 | 3.820 | 4.171 | 0.010 |
| Natural | -2.583 | 4.125 | 4.290 | 0.010 |
| Cluster 2 | ||||
| Recharge | 2.425 | 4.201 | 4.150 | 0.020 |
| Packaging | 2.378 | 4.350 | 4.325 | 0.023 |
| Cluster 3 | ||||
| Recollection | 2.329 | 4.303 | 4.163 | 0.020 |
| Reduce | 2.280 | 4.280 | 4.144 | 0.023 |
Note: v.test assimilated as the Kuiper Test in Rstudio, analogous to the Kolmogorov-Smirnov test for distribution contrasting.
Source: Author own elaboration.
The variables that made the most input to the formation of cluster 1 were collection, seals, protect, and natural; however, these consumers are far from this sort of intentions since their v.test came negative and the average in this category was below the overall average (p<0.05). Likewise, cluster 2 is concerned with recycled packaging and the possibility of recharging products, while cluster 3 is interested in companies’ recollection processes and reducing natural resources in product production.
4.4. Sustainable Segmentation for Green Personal Hygiene Products
In order to describe the characteristics of sustainable consumer groups for green hygiene products, it is essential to quote Salina, Esteban, and Andrés (2004), where the authors assert that attitude, driven as a verbal, actual, and affective commitment to the environment, is a predictor of effective green behavior. Also, Garcia Paz (2009) points out that governments can promote green purchases as a strategy to promote consumer environmental awareness. Recently, Zhang and Dong (2020) found a stark difference between consumers’ intention to pay for green products and the geographical area’s environmental culture characteristics. Also, Perera, Auger, and Klein (2016) point out that in green consumption, a series of meanings are implicit, such as happiness, satisfaction, etc. In fact, several countries worldwide have begun to understand this threat and started to work to reduce the negative environmental impact of their business activities resulting from the trading of goods (Joshi and Rahman, 2015). Although technological innovations can help mitigate the impact, a change in our behavior patterns and lifestyle choices is necessary to become aware and start to act in an environmentally responsible manner (Hur, Kim, and Park, 2013).
The segments resulting from analyzing the data for green hard-discount hygiene products are:
The first group is called “the committed,” consisting of men and women between 20 and 30 years of age with a professional degree and placed in socioeconomic strata 3 and 4, exceedingly willing to purchase green cleaning products.
The second group is “eco-practitioners.” These are characterized by their green practices being well defined for all population age groups; however, they are more heterogeneous in the younger segments (20 to 30 years) and more homogenous in the older segments (between 40 and 50).
The group that scored the highest in green practices are the so-called “aware ones.” These are buyers aged between 30 and 40 with a secondary education, followed by subjects with an associate’s degree, a professional and postgraduate degree, and over 50 years old. In this case, a conclusion may be drawn that education could be a characteristic that fosters environmental awareness and sensitivity.
The intention was compared according to traits like age and education, and a very similar behavior was found among all sets of buyers. This information permits concluding that the willingness to buy green cleaning products does not vary significantly according to consumer age or educational attainment.
The last group is called “the responsible one.” These subjects are between 30 and 40, and their educational attainment ranges between elementary, secondary, and associate, buyers who demonstrate a stronger intention to purchase environmentally-friendly personal hygiene products.
5. Conclusions
The objective of this study focused on analyzing the characteristics and behaviors of personal hygiene products consumers with regards to sustainable practices and intentions in order to understand the user characteristics most relevant innovation in green products that meet the environmental needs of these consumer segments. Furthermore, there was a sustainable segmentation for hard-discount buyers.
Practices and intentions are not the same across consumers of hygiene products, despite a low positive correlation between both variables. Users are firmly intended to change their consumption habits, though their actual practices do not support this decision occasionally. If analyzed from their green practices, young people between 20 and 30 years of age are observed as the ones most concerned about using bicycles as a means of transportation and reusing water for house chores.
Regarding intention, consumers between 30 and 40 years of age and of lower the socioeconomic strata (1 and 2) are concluded as not displaying significant interest in improving their purchasing habits for personal hygiene products, while professionals aged between 20 and 30 years of age of the middle stratum (3 and 4) do express a concern especially regarding factors such as product certifications, incorporation of organic or natural ingredients and the consumption of water for using them.
The knowledge acquired made it possible to address an environmental issue that affects human beings and, in this case, buyers of high-discount cleaning products. Business-wise, the results can support the decision-making of companies that manufacture personal hygiene, making it essential to have environmental certifications and on good manufacturing practices and other aspects that help to positively modify the purchasing behavior of consumers of this type of product. Based on the above, it is relevant that other investigations be carried out domestically that provide knowledge about the current state of sustainability practices of consumers in the personal hygiene category, as well as to create strategies to be implemented in hard-discount chains in Colombia to strengthen the environmental awareness of its users when making a purchase.
This study will help personal hygiene brand directors or managers understand how they can further drive their marketing strategies for these eco-friendly products by looking to set themselves apart in the market. Moreover, this information is relevant and accurate for focusing on segments (clusters) 2 and 3, promoting campaigns and sustainability attributes for toiletries in alignment with these consumer groups in the hard-discount format.
As a general conclusion, there is a gap between practices and purchase intention, which marketing areas should place their focus on regarding the segments above to better impact the purchasing of sustainable personal hygiene products, and thus close the gap between daily life practices and the consumer-expressed intentions when faced with environmentally friendly products. Furthermore, it is interesting to say that there are consumers of green personal hygiene products presenting characteristics associated with other variables of analysis such as economic, social, and environmental variables on account of the awareness being acquired on the basis of sustainability.

