


 English (pdf)
 Article in xml format
 Article references
 Send this article by e-mail
 Cited by SciELO
  Cited by Google
  Similars in
SciELO
Similars in
SciELO  Similars in Google
 Permalink
1. Introduction
Latin America immerses in a globalized world, where economic and tax impacts are becoming more critical every day due to the constant modifications and updates in regulations, which have forced companies to adapt to the established parameters. Taxes regulated by tax laws impact companies’ financial performance; however, these regulations provide tax benefits and incentives that companies can take good advantage of.
The tax burden impacts the behavior of entities in different productive sectors. That is why the so-called tax incentives. They arise as a benefit whose purpose is to promote certain behaviors in the actors of the economy. From there, a tax exception allows a tax collection decrease.
The fluctuating need of countries to expand and promote new and better incentives indicates a progressive concern for economic growth, where Ecuador is no exception. Tax benefits include capital allowances, tax credits for investments, accelerated depreciation, additional deductions for environmental care, exemption, and reduction of taxes payable. Therefore, they expect to benefit taxpayers and attract new investments that increase productivity as a basis for economic development and employment, among other outcomes. To this effect, it is necessary to have an ethical dimension accompanied by a tax culture that discourages tax evasion or avoidance-originating in this way, uncertainty about the tax administration due to tax loopholes.
The lack of information on the potential benefits of the application of tax incentives effectiveness has not facilitated its proper understanding by the business sector. Since it has not allowed scope of the actual impact on the financial performance of the companies that could take advantage of these types of measures, analyzing the financial performance of a business sector, employing indicators that show the behavior of the firms, will always be of interest. However, it will be necessary to complement this study by analyzing various aspects that affect their performance, such as tax benefits or any other measure that could impact or benefit a specific industrial sector. On the other hand, if the State is not clear about the impact of actions that help the business sector, it may have seen its efforts diluted tax expenditures.
From this perspective, it becomes necessary to analyze the tax incentives application on the manufacturing and commerce sectors in Ecuador, which has been considered due to the critical generation of income, leading to an increase in the payment of taxes. The importance of these sectors for the Ecuadorian economy is evidenced in the contribution to the country’s Gross Domestic Product, representing together for the year 2018 25.92% of the Gross Added Value (Banco Central del Ecuador, 2020). In addition, they concentrate 64.64% of the income, 30.01% of the number of companies, and 42.07% of the employment positions of the corporate business fabric (Superintendencia de Compañías Valores y Seguros del Ecuador, 2021).
The instability and economic recession that originated in Ecuador have led the government to implement new fiscal policies, establish tax incentives that promote productive reactivation, generate benefits for companies to strengthen productivity, and support the growth and sustainability of the business fabric.
A country’s tax policy impacts the performance of companies by imposing a certain tax pressure and the operability it demands; these are aspects that affect the liquidity and organizational structure of firms (Abuselidze, 2012; Nugaev et al., 2017). Given this scenario, tax benefits are set as a tax policy alternative that aims to encourage certain behaviors or economic sectors through concessions that seek to reduce the tax burden borne by companies. This policy allows resources that would have been allocated to the payment of taxes to be used to enhance the competitiveness of the organization by financing its operations-reducing cash needs in the short term and creating circumstances that link to greater profitability (Quoc and Van, 2020).
Based on the above premises, this research aims to determine the influence of tax incentives on the financial performance of manufacturing and commercial companies in Ecuador for the period 2015-2018. For this purpose, a quantitative methodology was applied, with financial information extracted from the Superintendence of Companies, Securities, and Insurance, the same that reported by the companies, which will allow an analysis through economic indicators.
It is essential to evaluate the application of tax incentives since tax benefits generate economic support to companies and, sometimes, due to lack of knowledge, they are not adequately applied. The article presents empirical evidence that addresses the impact of tax incentives on business performance in Ecuador. It intends to provide information that contributes to the evaluation of the effectiveness of fiscal policy in search of the consolidation of competitiveness and sustainable economic growth and allows the approach of better public policies.
The research structure includes a review of the existing literature on tax incentives and the financial indicators that affect them and a section describing the methodology used. Subsequently, a comparative analysis of the financial performance in the manufacturing and commercial sectors was carried out, followed by a study by the size of the companies that apply tax incentives. The regression analysis explained the influence of tax incentives and size on economic performance. The main conclusions of the research are presented at the end.
2. Literature review
The Centro Interamericano de Administraciones Tributarias [CIAT] (2018), to know the net benefit of tax incentives in developing countries in Latin America, has conducted a project called “Design and evaluation of tax incentives in developing countries.” This project presented a methodology that helps improve the design, administration, and evaluation of policies to carry out reforms, thus improving tax processes that allow tax efficiency and equity through a comparative cost-benefit analysis previously applied in the United States. The result obtained allowed the tax administrations to use the model by their country’s legal framework and institutional development.
In the economic sphere, “The tax is a payment that must be compulsorily paid to the tax administration when taxable events take place. These benefits do not constitute the sanction of an unlawful act, but must be established by law” (Muñoz, 2017, p. 14). Therefore, taxation is the cancellation of a monetary value to the State by the people who make up a nation based on a taxable event, collected values, and destined to meet the economic objectives.
From another theoretical point of view, taxation constitutes an instrument of state intervention on economic activity to redistribute income among the different social sectors. It avoids the concentration of benefits in large financial groups and promotes inclusion. Additionally, it dissuades economic agents from socially undesirable behaviors and finances the state budget (Portillo, 2021; Tello, 2019).
As a fiscal policy strategy, tax incentives can be proposed as an instrument to counteract specific effects generated by the market (Bechko et al., 2019; Gomes et al., 2016). It prevents the tax system from fulfilling its main objectives: being a tool that pursues the equitable redistribution of wealth and promotes employment (Constitución de la República del Ecuador, 2008). However, in general terms, it can be argued, “Tax incentives constitute instruments through which affect the behavior of economic actors at a limited fiscal cost” (Jiménez and Podestá, 2009, p. 9). In this sense, tax incentives are mechanisms used to promote specific economic sectors through a rebate, exemption, or tax exemption. In this way, the State gives a stimulus to taxpayers to promote economic and social development.
In this same context, the Constitución de la República del Ecuador (2008) in its Art. 285 details the objectives of the fiscal policy, being these: the financing of services, investment, and public goods; the redistribution of income through transfers, taxes, and adequate subsidies; and, the generation of incentives for investment in the different sectors of the economy and the production of goods and services, socially desirable and environmentally acceptable; which shows the importance as a country of promoting investment and productive, through incentives.
Tax incentives can be analyzed from two points of view: The State and the taxpayers. For the State, tax incentives will be a “tax expenditure” due to the decrease in revenue they cause. It consists of reducing a tax burden to certain taxpayers for economic, social, and political reasons, generating employment, attracting new investments, and improving the financial performance of the taxpayer, ensuring more excellent macroeconomic stability for the country. From the taxpayers’ point of view, it is a motivation that allows them to invest in new technology, look for new productive models, bet on financing research and development activities, promote the hiring of vulnerable groups, and make other decisions. It will help improve industry and commerce, through the generation of income and the increase of jobs, without being repressed in undertaking new challenges due to the fear of the tax burden.
Within this perspective, Calvache and Cajiao (2017) state that Ecuador gave tax reforms in the last decade by changing the governmental structure and its objective of offering an excellent living to the population. Tax incentives are also used as an instrument to attract foreign investment, improve domestic industrial development, and, in some cases, subsidize sectors or companies in recession.
For their part, Acosta et al. (2016), state that the incentives established in the Organic Code of Productive, Commerce, and Investment COPCI seek to promote productivity and investment in the country to obtain a growth of the productive apparatus. In addition, according to these tax incentives, companies can benefit from paying taxes. From the State’s point of view, it seeks to promote economically lagging sectors through the generation of employment and development of productivity. However, each government establishes a policy, which will depend on the economic situation in which a country finds itself.
Ruíz et al. (2016), based on tax policy to improve investment and growth in Latin America, through exploratory analysis, prove that when setting incentives related to the development of Foreign Direct Investment (FDI), find that the effective tax rate is not relevant. However, international commodity prices showed greater relevance in the increase of FDI.
According to Azevedo and Portella’s (2019) perspective, the lack of uniformity in applying tax incentives limits their widespread use and efficiency to promote environmentally sustainable behaviors due to the limitations to promote adequate conditions to taxpayers and accessible means for obtaining tax benefits. This perspective is based on the study of the adoption of green tax incentives and their contribution as an urban policy instrument in different municipalities in Brazil.
Concerning tax benefits, Lara (2018) studies tax incentives for financial cooperatives in Colombia, Costa Rica, and Mexico to establish similarities and divergences in the tax systems studied using the comparative research method. The treatment of the fiscal effects on income and consumption taxes (General Sales Tax and Value Added Tax) is highlighted. The results showed that companies enjoy preferential tax treatment in the three nations, integrating into their tax laws tax exemptions and reductions that in themselves do not constitute privileges but rather the manifestation of tax justice.
On the other hand, Diez and Gómez (2018) determine that the Ecuadorian government seeks strategies to increase the amount of investment in the country through the Organic Code of Productive, Commerce, and Investment -COPCI-. This regulation establishes the main requirements for companies that make productive investments and can benefit from exemptions and taxes as incentives for their investment. Based on a non-numerical exploration of the data through an interview and the case method, they conclude that after analyzing the COPCI, several types of incentives are established for different companies. These incentives can be additional deductions for reducing or total exemption of the income tax payable.
Colombia studied innovation in the manufacturing industry from the perspective of Bayona et al. (2018), to determine whether the public instruments (subsidies and tax deductions) applied by the Colombian government during the period 2013-2014 contributed to generating innovations (product additionally effect) or stimulated the absorption of innovations in the national or international market. For this purpose, the authors used a sample of 2,057 companies in the manufacturing sector, based on the Technological Development and Innovation Survey (EDITION VII), by estimating a negative binomial regression model. The research shows a positive relationship between receiving tax incentives and innovating in goods and services for the market and receiving subsidies, which has a compelling correlation in business innovation. They conclude that the companies that used tax incentives successfully positioned their goods and services in the international market.
In emerging economies, such as India, tax incentives for the manufacturing sector have both positive and negative consequences. Thus, this tax policy has allowed high-tech firms to use these resources to develop critical capabilities to adapt or assimilate international technological development, resulting in higher productivity (Bhattacharya et al., 2021). In contrast, manufacturing companies that are not intensive in the use of technology have found in tax incentives based on the size of the organizations. It is a stimulus to reorganize their productive structure, to remain below the threshold to take advantage of tax benefits, an aspect that favors outsourcing and limits the growth of companies (Ramaswamy, 2021).
The importance of studying the financial performance of companies can be evidenced in research such as that conducted by Ponce et al. (2019), who propose to know the determinants of the capital structure of 304 companies in the manufacturing sector of Guayaquil during the period 2012-2016 and whose theory condenses the financing decisions of companies. Ecuador is raised as the object of study, being a developing country, which allows comparing the results with the predictions of the theories on static equilibrium and the financial hierarchy. In conclusion, the economic hierarchy theory has greater explanatory power than the static equilibrium theory. However, the authors did not find statistical evidence to support the importance of growth expectations in the corporate capital structure.
García et al. (2018), study the determinants in adopting financing alternatives and their evidence on the growth of manufacturing firms in Ecuador. The authors propose to identify and analyze the factors associated with adopting any external financing other than tax incentives as an alternative for Ecuadorian manufacturing companies during the period between 2007 and 2016. For the development of the research, they applied a methodology with a quantitative, non-experimental, longitudinal, and descriptive approach, following a deductive logic and using a post-positivist paradigm. The results allow inferring that an increase in the levels of accounts payable has an impact on the rise in the probability of having a performance in the productivity of the sector’s companies.
For their part, analysts and researchers Gutiérrez et al. (2020), agreed on a diagnosis in their study on tax amnesty and its impact on tax collection under the theory of deterrence. Over time, the Ecuadorian State has enacted several tax reforms focused on tax amnesty to obtain revenue to pay for public spending and combat tax evasion. The research sought to identify the relationship between tax remissions and tax collection. The deterrence theory proposed by Allingham and Sandmo (1972) suggests that the taxpayer analyzes the cost-benefit of complying with his tax obligations. Although he may face fines and penalties, some reforms allow late payment without surcharge, with which the taxpayer could choose not to pay taxes.
In summary, the high tax evasion promulgated by a culture of tax non-compliance is replicated in the Andean countries, based on studies conducted by the Banco Mundial (2005), which indicate that Latin America is the region of the world that presents the highest levels of inequality. This tax evasion is more heightened than developed countries, such as Asia, Eastern Europe, and even African countries, resorting to the main problem addressed in the research: tax equity and justice.
Other researchers such as Rocco and Rangel (2016) studied tax incentives in Brazil, relating them to the enforcement of fundamental rights. Through a qualitative analysis, using the hypothetic-deductive and descriptive-analytical approach method, they argue that tax incentives are presented as an instrument of imminent extra taxation. Hence, constituting a regulation inductively to encourage or discourage certain behaviors of the citizen, which can be established by affecting public revenues (through exemptions, deferrals, forgiveness, and amnesty), and public spending (through grants, estimated credits, and subsidies). The research was not intended to displace the complexities generated by tax incentives, only to identify and analyze the best incentives modalities and under what parameters or circumstances of fact and law they could be applied.
The incidence of tax incentives in the environmental management of agribusiness is studied by Reinosa (2015), who determines that 37% of the companies invested in improving their environmental management. Still, none benefited from the rebate considered in the Income Tax Law (ISLR) since only 12% were aware of the regulations. Sixty-seven percent felt that they did not receive incentives from government agencies to take advantage of the rebates, and 100% stated that in the future, they would be interested in making investments to improve their environmental management to access this type of incentive. In conclusion, there is a need for greater dissemination of information and coordination among the competent administrative units since the benefits are diluted due to lack of dissemination. In addition, the awareness of companies and citizens, in general, should be promoted, since, as the constitution states, the obligation to preserve the environment is not only of the State but of society as a whole.
Uwuigbe et al. (2016), examine the effect of tax incentives on the performance of manufacturing industries in Nigeria. The empirical results show that tax incentives would affect the funds available for investment in manufacturing industries. It also shows that firms privileged to enjoy tax benefits are willing to pay their taxes promptly. That tax incentive would significantly increase the number of manufacturing industries in Nigeria. The research recommends that firms be more aware of the available tax incentives to be taken advantage of.
While the application of tax incentives is positively related to investment (Bayona et al., 2018), innovation (Walter et al., 2022), and business performance (Uwuigbe et al., 2016), it is essential to note that additional aspects of fiscal policy influence these effects. These impacts are macroeconomic balance, infrastructure conditions, and the strength of the country’s institutions (Munongo et al., 2017), in addition to the certainty perceived by investors regarding the economic growth of the place where they operate (Guceri and Albinowski, 2021). These factors can affect the effectiveness of tax benefits by enhancing or counteracting their effects; therefore, tax benefits should be evaluated together with structural incentives for investment.
The literature evidences the importance of tax incentives to promote the growth of companies, care for the environment, increase domestic and foreign investment, and develop specific sectors, among others. However, the low levels of tax culture evidenced in high rates of tax evasion and lack of knowledge of the regulations indicate that the incentives are not taken advantage of by all companies that could benefit from them.
3. Methodology
The study was carried out through the comparative analysis of financial information, applying a quantitative methodology. The financial performance variable was measured through Return on Assets (ROA); in addition, indicators describing the firms’ financial management are analyzed through current liquidity, indebtedness, and operating profit margin (Appendix 1).
From the analytical context of the research, financial information was examined from 2015 to 2018. From a universe of 22,700 companies that have presented activity during the study period, belonging to Ecuador’s manufacturing and commerce sectors, 71,281 observations were studied, as evidenced in Table 1. The database was prepared based on information from the Superintendency of Companies, Securities, and Insurance. The entity companies are required to report their financial statements.
Table 1 Composition of the population under study
| Economic sector | Companies apply tax incentives | Companies that do not use tax incentives | Observations in total |
|---|---|---|---|
| Trading | 2.033 | 50.871 | 52.904 |
| Manufacture | 1.205 | 17.172 | 18.377 |
| Total | 71.281 | ||
Source: Authors’ own elaboration.
The study considered two groups of analysis: companies that apply tax incentives and those that do not, which allowed, through statistical analysis of means tests such as analysis of variance (ANOVA) and Welch’s t-test, the comparison of the averages of the calculated indexes, which were previously filtered by applying the Chauvenet criterion, a methodology that made it possible to detect outliers for their consequent elimination. The study includes a trendy analysis of the financial indicators in the four years of research and an analysis of the financial health of the activity levels of the companies that apply tax incentives.
To study the influence of tax incentives on the financial performance of companies, considering their size, a multiple linear regression model was estimated using the ordinary least squares method. This model has become a widely used methodology when assessing the influence of tax incentives on business behavior, as evidenced by Uwuigbe et al. (2016), García et al. (2018), and Reinosa (2015).
Return on assets=β 0 +β 1 (ln (tax incentives))+β 2 (Size)+µ
The dependent variable was defined as the economic performance of the companies expressed through the return on assets, which is explained by the natural logarithm (ln) of the tax incentive quantified in thousands of dollars. Business size is established by the controlling entity, based on income and number of workers (Reglamento del Código Orgánico de la Producción, Comercio e Inversiones, 2011). This variable, considered according to its legal basis, is essential since there are tax benefits aimed at encouraging micro and small companies to reduce the corporate tax rate (Ley Orgánica de Régimen Tributario Interno, 2021).
The economic-financial variables included in the model allow describing the performance obtained by the firms, analogously to García et al. (2018)
4. Results and discussion
Through the data collected for the study, the results obtained by applying the tools that allowed determining the companies that use tax incentives and their impact on the financial performance of companies in the manufacturing and trade sectors in Ecuador are described.
According to Table 2, it can be seen that for 2018 small companies represented the highest percentage in both the manufacturing and commerce sectors with 34.51% and 38.62%, respectively. The composition according to the revenue variable is different, as the 653 large companies in the manufacturing industry stand out, which generated $22,620.2 million, that is, 88.85% of the total revenue; while, at the commercial level, with several 1,050 large companies reach a gain of $38,383.6 million, representing percentage-wise 78.19% of the total generated.
Table 2 The number of companies and revenues in the manufacturing and commerce sectors, by the level of activity, 2018
| Level of activity | Manufacture | Trading | ||||||
|---|---|---|---|---|---|---|---|---|
| Number of companies | % | Income (millions USD) | % | Number of companies | % | Income (millions USD) | % | |
| Microenterprises | 1.475 | 31,83 | 114,10 | 0,45 | 4.740 | 35,71 | 458,30 | 0,93 |
| Small | 1.599 | 34,51 | 805 | 3,16 | 5.127 | 38,62 | 3.435,20 | 7 |
| Medium | 907 | 19,57 | 1.920,40 | 7,54 | 2.357 | 17,76 | 6.815,50 | 13,88 |
| Large | 653 | 14,09 | 22.620,20 | 88,85 | 1.050 | 7,91 | 38.383,60 | 78,19 |
| Total | 4.634 | 100 | 25.459,70 | 100 | 13.274 | 100 | 49.092,50 | 100 |
Source: Authors’ own elaboration
To demonstrate the behavior of the companies that apply tax incentives, both in the manufacturing and commercial sectors, Tables 2 and 3 present the number of companies accompanied by the monetary value of the incentives used for the years 2015 to 2018.
In Table 3, it can be seen how a reduced number of companies in the manufacturing sector apply the benefits offered by the tax regulations. In 2018, the application was higher, with 406 companies (8.76%) using a value of $87,903.63 million for incentives.
Table 3 Companies that apply tax incentives, manufacturing sector
| Year | Companies that apply Tax Incentives | % | Tax incentives (millions USD) | Companies that do not apply Tax Incentives | % |
|---|---|---|---|---|---|
| 2015 | 270 | 5,99 | $ 32.865,06 | 4.234 | 94,01 |
| 2016 | 246 | 5,46 | $ 37.175,43 | 4.260 | 94,54 |
| 2017 | 283 | 5,98 | $ 58.369,49 | 4.450 | 94,02 |
| 2018 | 406 | 8,76 | $ 87.903,63 | 4.228 | 91,24 |
| Total | 1.205 | - | $ 216.313,61 | 17.172 | - |
Source: Authors’ own elaboration.
As for the commerce sector, Table 4 shows that the percentage of companies that apply tax incentives is still low and even lower than the manufacturing sector. This percentage may be because more benefits are directed to the productive sector. For 2016, only 352 companies apply for benefits, although subsequently, for the years 2017 and 2018, the values are higher. As relevant information for 2018, the value for tax incentives reached $79,612.03 million, which triples the value of the first year under study.
Table 4 Companies that apply tax incentives per year, trading sector
| Year | Companies that apply Tax Incentives | % | Tax incentive (millions USD) | Companies that do not apply Tax Incentives | % |
|---|---|---|---|---|---|
| 2015 | 428 | 3,25 | $ 22.215,10 | 12.759 | 96,75 |
| 2016 | 352 | 2,72 | $ 16.031,33 | 12.610 | 97,28 |
| 2017 | 474 | 3,52 | $ 48.600,75 | 13.007 | 96,48 |
| 2018 | 779 | 5,87 | $ 79.612,03 | 12.495 | 94,13 |
| Total | 2.033 | - | $ 166.459,21 | 50.871 | - |
Source: Authors’ own elaboration
This finding shows the low application of tax incentives within the Ecuadorian business fabric. This situation calls for reflection on the fulfillment of the objectives of this tax policy, related to the contribution to good living (Calvache and Cajiao, 2017), the promotion of productivity and investment, and the growth of the productive apparatus (Acosta et al., 2016).
In this context, potential constraints to the widespread use of tax benefits become relevant, among which the lack of uniformity in their regulation (Azevedo and Portella, 2019), and the awareness of the business sector about their existence and benefits in the short and medium-term (Uwuigbe et al., 2016) stand out.
The financial health of companies that apply tax incentives is analyzed based on liquidity, indebtedness, and profitability indicators. The results are compared with the average companies that do not use these benefits and with the sector’s standard understudy.
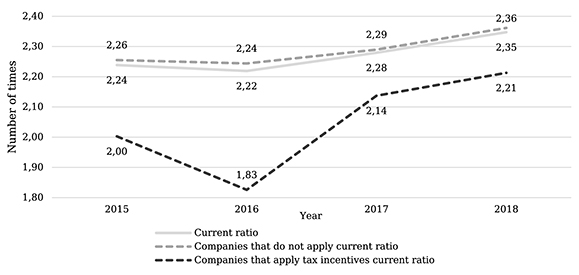
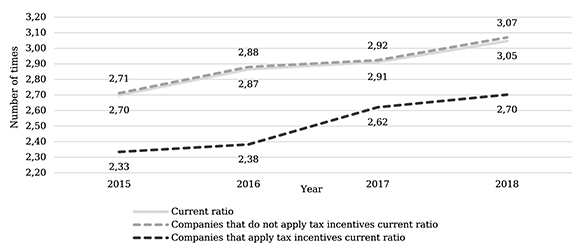
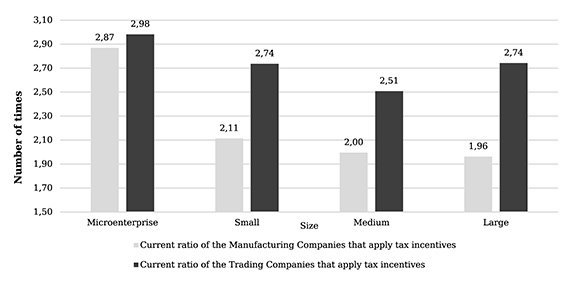
Figures 1 and 2 show a comparison of the companies that do and do not apply tax incentives, including the average for the sector, about the current liquidity ratio. It can be seen that the companies that use incentives have a lower liquidity indicator for the sectors studied. However, their proportions are sufficient to cover their short-term obligations. It can be highlighted that in the manufacturing sector, the liquidity of the companies that apply incentives had a decrease in 2016. For the case of the commerce sector, an increasing trend is evidenced throughout the study period. The results may indicate that companies that apply tax benefits are more efficient in managing their short-term resources since they show good indicators. They allow them to cover their debts of less than one year, and without showing high values, that evidence immobilized resources, which generate benefits for the companies.
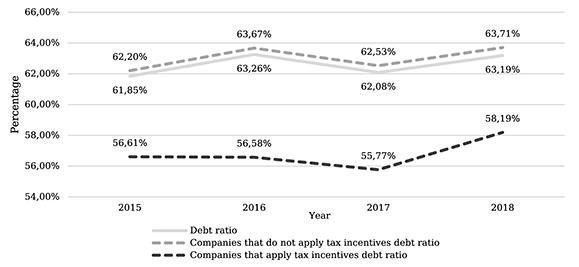
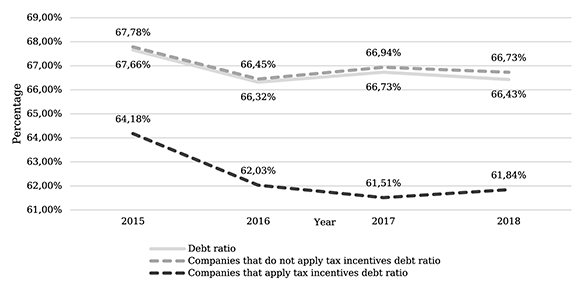
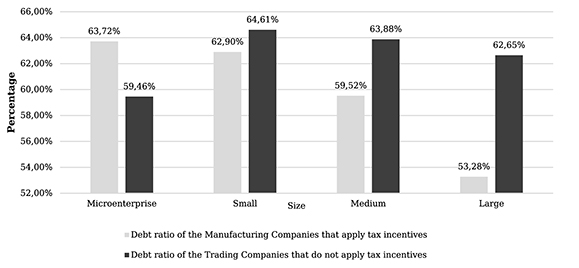
Figures 3 and 4, which show the level of indebtedness, demonstrate that companies that apply tax incentives prefer to finance themselves to a lesser extent with third parties, which is an indication that, by having lower levels of indebtedness, they may be in a better position to assume financial commitments. The results are similar for the two sectors under study, showing a more significant gap in indebtedness between companies that apply tax incentives and those that do not exist in the manufacturing industry.
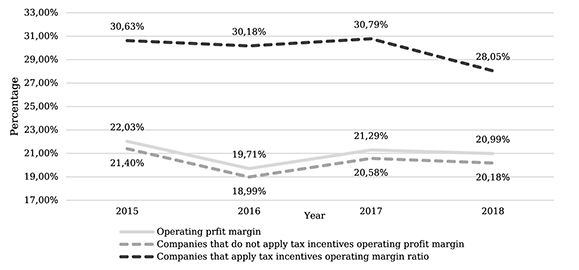
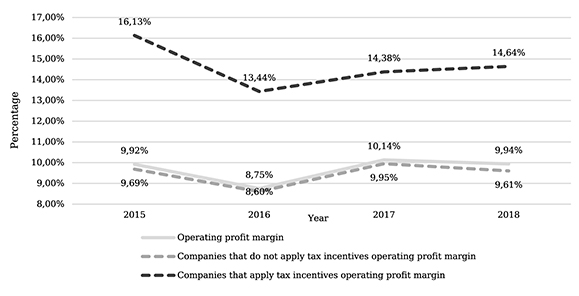
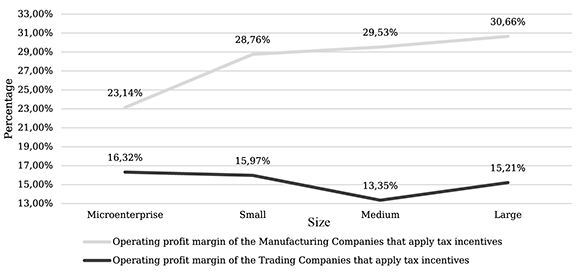
The operating profit margin is shown in Figures 5 and 6 for the manufacturing and commerce sectors, respectively. The results show that the operating profit margin of companies that apply tax incentives is higher than those that do not. This result can be explained by using tax benefits to reduce the income tax burden by directly affecting the firms’ tax base. As relevant information, it can be mentioned that the commerce sector presented a decrease in operational profitability in 2016.
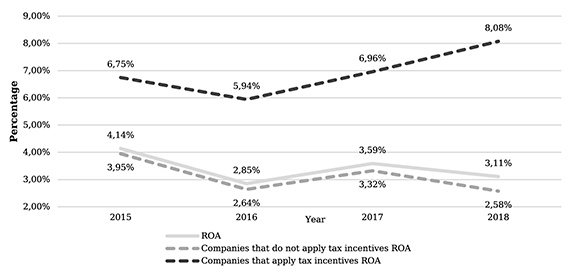
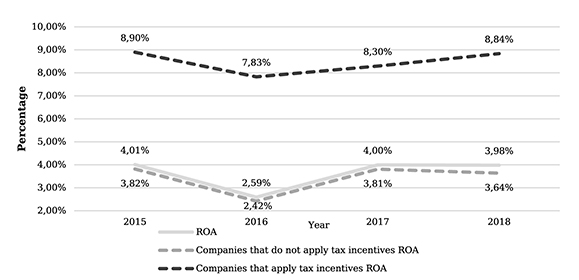
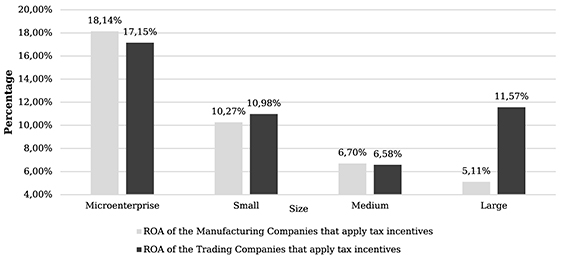
Figures 7 and 8 show the behavior of the return on assets ROA of the study groups in the analyzed period. By the operating profit margin, the results show that companies in the Manufacturing and Trading sectors that apply tax incentives show a greater capacity to generate profitability. They have assets they own, which may indicate that the greater the benefits used by a company, the more significant the opportunities for financial growth.
Tax incentives, among other objectives, seek to benefit companies to bear a lower tax burden, and this saving supports their growth. Therefore, from this perspective, it is vital to analyze the financial behavior of the companies that apply incentives considering their level of activity; because the Ecuadorian reality presents benefits aimed at MSMEs to empower them. In contrast, studies such as that of Ramaswamy (2021) show that tax incentives, based on the size of the organizations, can discourage the growth of the companies in order not to stop receiving these benefits.
Considering the operational level, Figure 9 shows the behavior of the liquidity of the companies that apply incentives in the manufacturing and commerce sectors. The microenterprises present the highest indices, which reflect the greater availability of money to cover short-term obligations, a behavior that is repeated in the two sectors under study.
Source: Authors’ own elaboration
Figure 9 Average current liquidity 2015-2018, Manufacturing and Trading sectors by activity level
Figure 10 shows the average level of indebtedness of the companies by size in the sectors studied. Financing decisions are contrary depending on the industry in which the companies operate. The manufacturing industry shows that the larger the size of the companies, the lower the level of indebtedness, while in the case of the commerce sector, microenterprises have the lowest level of debt.
Source: Authors’ own elaboration.
Figure 10 The average level of indebtedness 2015-2018, Manufacturing and Trading sectors by the activity level
Profitability, measured through the operating margin, as in Figure 11, shows that the manufacturing sector presents higher positive results on average. It increases as the companies increase their activity level until the large companies achieve an operating profit margin of 31%, without considering extraordinary items and the tax burden that the companies can bear. In contrast, micro-companies in the Trading sector that apply tax incentives present the highest average index, and however, in any case, they are lower than those given by the productive sector.
Source: Authors’ own elaboration.
Figure 11 Average operating profit margin 2015-2018, Manufacturing and Trading sectors by activity level
Concerning the return on assets ROA (Figure 12), it is observed that, in both the manufacturing and commercial sectors, micro-enterprises have the best margins, which means that they are converting their investments into profits in a more efficient manner. In the manufacturing industry, they show an evident economy of scale.
Source: Authors’ own elaboration.
Figure 12 Return on average assets 2015-2018, Manufacturing and Trading sectors by activity level
A regression model that considers the size effect is proposed to analyze the impact of tax incentives on the profitability of the firms that apply them. Table 5 shows the descriptive statistics of the variables involved in the study model.
Table 5 Descriptive statistics of the Trading and Manufacturing sectors 2015 - 2018
| Variable | Tax incentives (thousand USD) | Return on assets | |
|---|---|---|---|
| Trading | |||
| Mean | 81,88 | 0,13 | |
| Median | 13,13 | 0,10 | |
| Standard Deviation | 404,57 | 0,15 | |
| Percentile | 25 | 7,50 | 0,04 |
| 50 | 13,13 | 0,10 | |
| 75 | 41,59 | 0,18 | |
| Manufacturing | |||
| Mean | 180,50 | 0,11 | |
| Median | 21,82 | 0,08 | |
| Standard Deviation | 733,27 | 0,13 | |
| Percentile | 25 | 9,45 | 0,03 |
| 50 | 21,82 | 0,08 | |
| 75 | 78,36 | 0,16 | |
Source: Authors’ own elaboration
The descriptive statistics of the variables used to estimate the regression model show that manufacturing companies apply more significant tax incentives to the commerce sector, indicating the strategic direction of tax incentives towards economic sectors with greater intensity in the generation of added value. However, this more significant productive stimulus does not translate into better results since manufacturing companies present, in general terms, a lower return on assets than companies in the commerce sector.
The statistics of the estimated model are presented in Table 6. The estimators reveal, for both sectors, a directly proportional relationship between tax incentives and return on assets, which indicates that tax incentives benefit the economic performance of firms. An inversely proportional relationship between the level of activity and return on assets is also observed in both sectors studied. An aspect that may respond to a successful competitive position of certain MSMEs by exploiting specific market niches in which large companies do not participate with solid leadership.
Table 6 Statistics of the linear regression model of the Commerce and Manufacturing sectors 2015 - 2018
| Return on assets ROA | Β | Standard Error | t | p | VIF |
|---|---|---|---|---|---|
| Trading | |||||
| Constant | 0,229 | 0,010 | 21,847 | < 0,000 | |
| ln tax incentive a | 0,012 | 0,002 | 5,051 | < 0,000 | 1,342 |
| Size b | - 0,047 | 0,004 | -11,874 | < 0,000 | 1,243 |
| R2 | 0,069 | ||||
| Manufacturing | |||||
| Constant | 0,227 | 0,014 | 16,744 | < 0,000 | 1,358 |
| ln tax incentive a | 0,013 | 0,002 | 5,391 | < 0,000 | 1,539 |
| Size b | - 0,050 | 0,005 | -10,684 | < 0,000 | |
| R2 | 0,090 | ||||
| Dependent variable: Return on assets | |||||
| a. natural logarithm of the tax incentive expressed in thousands of dollars. | |||||
| b. 1 = micro-enterprise, 2 = small, 3 = medium, 4 = large | |||||
Source: Authors’ own elaboration.
The relationship between tax incentives and higher economic performance is consistent with studies carried out in other countries in the region, such as Colombia and Brazil, and the findings found in emerging countries such as Nigeria and India. In this way, the effectiveness of this tax policy instrument to enhance profitability is empirically demonstrated; because these benefits allow freeing resources for reinvestment, developing capabilities that strengthen productivity and promote the internationalization of operations (Bayona et al.,2018; Rocco and Rangel,2016; Uwuigbe et al.,2016; Bhattacharya et al., 2021).
5. Conclusions
Implementing strategies to benefit the economic sectors represents a challenge for any country. Empirical evidence shows that this issue is relevant in economies of different regions and countries. Since it is not enough to enact a law, it is also necessary to articulate it with government administrative management. In addition, in emerging economies, the active dissemination of these benefits plays a fundamental role in their application. These aspects could condition the use of this strategy in congruence with what has been shown in Brazil and Nigeria. In Ecuador, the legislation has a regulatory body with provisions and a scope of application that favors the economic structures of the various productive sectors.
Through a comparative analysis of the financial performance of companies in the Manufacturing and Trading sectors that apply tax incentives with those that do not, for the period 2015 - 2018, it is evident that companies belonging to the first group have lower levels of current liquidity, but appropriate to cover their short-term obligations. The strategy of resorting to third-party financing is more deficient in companies that benefit from tax incentives. Their profitability is higher, which may respond to a lower tax burden borne by these companies and better management of their investments to generate profits.
Regarding the study carried out considering the level of activity of the companies that apply tax incentives, it is evident that the manufacturing sector shows a tendency to the level of activity. That is to say, the larger the size of the organization, the less liquid the companies on average are, the lower the debt indexes, the higher the operating profitability, but the lower the capacity to generate profits with their assets. Companies in the commerce sector do not exhibit this behavior and show, as a relevant result, the opposite financing strategy to companies in the industrial sector.
The multiple regression analysis confirmed the scale effect, showing that the smaller the size, the higher the business results with return on assets. In the same way, applying tax incentives generates greater efficiency in the management of investment by showing higher results.
The research indicates that applying tax incentives has improved the economic performance of the companies that involve them. These firms enjoy better financial health, as they can benefit from reducing the tax burden, which encourages investment. However, this stimulus can be enhanced by establishing economic, political, and legal conditions that create an environment conducive to business activity.
In the future, it is crucial to include macroeconomic variables, such as employment, contribution to GDP of economic sectors, gross value added GVA, among others, that make it possible to understand the behavior of the industries and the influence of possible government strategies on financial performance. It is also important to emphasize the need to study the types of tax incentives to identify how each of them affects business performance.

