


 English (pdf)
 Article in xml format
 Article references
 Send this article by e-mail
 Cited by SciELO
  Cited by Google
  Similars in
SciELO
Similars in
SciELO  Similars in Google
 Permalink
1. Introduction
In light of the crucial advances in the Latin American academic field (Bedenlier et al., 2018), the reality of Ecuador has not escaped attempts to raise quality standards in Higher Education (Van Hoof et al., 2013), primarily through evaluation and accreditation processes supported by the Constitution of 2008 and the Organic Law of Higher Education of 2010 (Ramírez and Minteguiada, 2010; Rubaii and Bandeira, 2018). Furthermore, Mandate No.14 sought to guarantee Higher Education’s quality, purification, and improvement (Benavides et al., 2019; Benito Gil, 2017; -EspinozaCevallos, 2016).
The evaluation of universities is becoming increasingly important in many countries, and Ecuador could not be the exception (Collins, 2015; Köse and Korkmaz, 2019). Moreover, as public funding becomes increasingly scarce and substantial changes in structures are at risk, an increased number of studies have emerged to assess efficiency (Coria, 2019; Hillman et al., 2018; Martínez-Campillo and Fernández-Santos, 2020). These studies helped respond to various tensions such as heterogeneity between universities, access gap, sustainability, economic expansion and concentration of the academic offer, the composition and increase in spending.
Ecuadorean evaluation and accreditation process (Rubaii and Bandeira, 2018) was regularly carried out by two control bodies, the defunct National Council for Evaluation and Accreditation, and the Council for Evaluation, Accreditation of the Quality of Higher Education. Initially, these institutions evaluated the performance levels of 67 universities, verifying their quality, purification, and improvement (Rojas, 2011). This process classified all evaluated institutions into five categories: 11 A; 9B; 13C; 13D; 21 E. Of the total number of institutions, 13 were closed for not meeting the minimum quality standards (Acosta and Acosta, 2016). Subsequently, 54 universities were evaluated during the second round, and 5 remained in category A, 23 in B, 18 in C, and 8 in D (Ortiz and Hallo, 2019; Sánchez et al., 2018). This last evaluation followed the legal framework regulating Higher Education which textually expressed, “All the Universities and Polytechnic Schools of the country must be subject to an institutional evaluation, accreditation, and categorization on a five-yearly basis” (Avilés, 2016; Espinoza Cevallos, 2016). As these changes occur, universities must catalyze their operations and manage their resources appropriately (Bolli et al., 2016; Hou, Hong and Shi, 2021), seen as a commitment to improving quality and transparency (Johnson-Toala, 2019; Martín, 2006; Schneider et al., 2019), ultimately allowing an adequate response to the elimination of inefficiencies (Cáceres et al., 2014; Gralka, 2018).
1.1. Technical effectiveness and evaluation in Higher Education Institutions
There are numerous conceptual contributions to technical efficacy and its relationship with the evaluation of Higher Education Institutions (Abbott and Doucouliagos, 2003; Agasisti et al., 2016; Agasisti and Johnes, 2010; Dumitrescu et al., 2020; Quiroga-Martínez et al., 2018; Sagarra et al., 2017; Wolszczak-Derlacz, 2017). Under this context, an exploration of the specific literature focused on the inherent flexibility of the DEA model Quiroga-Martínez et al., (2018) revealed the differences in productivity in 30 Universities in Argentina (2004-2013), where Teaching and Research maintain a positive trend in efficiency. In contrast, Coria (2019) in Argentine Universities with state management showed heterogeneous efficiency, with low scores in some cases. Ibáñez Martín et al. (2017), showed that efficiency was influenced by income, the teaching staff’s academic training, and the number of students holding scholarships, with the medical degree obtaining the best levels of efficiency.
In Mexico, during 2007-2012, 55 universities offering teaching-research products were evaluated. For Sagarra et al. (2017), the National Autonomous University stood out in Teaching-Research; the Autonomous University of Guadalajara scored highly in terms of teaching resources and was moderately efficient; the Autonomous University of Yucatan revealed weak aspects to be corrected.
On the other hand, in the framework of heterogeneity and efficiency evaluation in Italian universities, for Agassisti and Pérez-Esparrells (2010), there were inter-university differences in the cost of education for students of programs different from Sciences and expenses associated with conducting research. Although the panorama pointed out an efficient provision, some institutions suffered from outliers. In the same line, for Agasisti et al., (2016), the estimated economic performance and the efficiency scores were affected by the presence of incidental parameters, indicating that institutions of the central-north region outperformed those from the southern area. The efficiency between Italian and Spanish state universities showed differences at the regional level. For Agasisti and Pérez-Esparrells (2010), Regional and Central Governments keep influencing the Italian universities due to their financial responsibility functioning as state’s inherent condition, whereas the Spanish universities were influenced only by the Regional Governments.
However, in the British Education System, the multi-product cost functions revealed notions of an inefficient system. For Izadi et al. (2002), it was unlikely that a variety of well-resourced institutions might stumble over the efficiency level. Despite this fact, the inefficiencies that remain are notably modest. In contrast, the Australian universities achieved very high performance and efficiency levels among themselves, showing homogeneity in performance, but without ruling out that system shows a low-performance (Abbott and Doucouliagos, 2003). Within the efficiency framework, Wolszczak-Derlacz (2017) evaluated 500 universities in Europe and the US (2000-2012), showing a relatively high level of technical inefficiency and substantial variability in efficiency scores between countries.
2. Theoretical framework
2.1. Origin and scope of Technical efficiency
In 1978, Charnes, Cooper and Rhodes played a leading role in introducing the concept of efficiency in the literature (Cooper, 2005). However, the starting point was attributed to Farrell, who, in 1957, created the Data Envelopment Analysis (DEA) based on the construction of index numbers in terms of productivity (Førsund and Sarafoglou, 2002). This contribution did not achieve greater scope until the later proposal of the CCR Model by Charnes, Cooper and Rhodes, marking the origin of the term Decision-Making Units (DMU), which is widely beneficial for measuring efficiency in organizations (Cooper, 2014).
The amplitude and relationship of technical efficiency with production factors (Romanov, 2021; Shahar et al., 2015) include two approaches: 1) with input orientation, including a reference unit that originates the same output as the evaluated unit; and 2) with an output orientation, the efficient unit selected as a reference uses the same quantities of inputs as the evaluated unit (Lita, 2018; Nazarko and Šaparauskas, 2014). Concurrently, the DEA stands out as a programming technique to calculate the technical efficiency index under an optimization posture, allowing solving a linear program for each observed DMU (Wojcik et al., 2017). There are also parametric approaches, which would enable optimizing each observation on a frontier set defined by Pareto-efficient DMUs (Pattanamekar et al., 2011; Thanassoulis, 1993).
The DEA is associated with the border methods; however, due to its characteristics, it evaluates the production with respect to the functions, determining the technical relationship that transforms the factors into the product. This step allows the maximum level of the attainable output to generate a relationship with the inputs or set the minimum of inputs, ultimately generating the outputs (Thanassoulis et al., 2016). In this context, the coexistence of inputs and outputs determines the efficiency of a DMU, transforming the inputs into desired outputs (Pino-Mejías et al., 2010). This interaction allows being evaluated with other DMUs, but without the possibility to establish whether the evaluation optimized the use of determined resources in creating outputs (Santos et al., 2013).
2.2. Models-DEA CCR and BCC
The DEA model is oriented to calculate returns to scale, characterized by the efficient frontier (Buitrago Suescú et al., 2017). In 1978, Charnes, Cooper, and Rhodes introduced the DEA-CCR model, which fixes the radial efficiency measures of inputs and outputs expressed in three ways: fractional, multiplicative, and enveloping (Anderson et al., 2007; Charnes et al., 1978; Liu et al., 2013). Subsequently, in 1984, Banker, Charner, and Cooper introduced the DEA-BCC model setting out that constant returns to scale decrease (Soares Alves et al., 2017) and the coexistence of this assumption may sometimes be excessively restrictive and unrealistic because the returns to scale typology can characterize the technology as an increasing or decreasing constant variable (Lovell, 1993). In other words, the returns to scale may be presented as pure technical efficiency and to scale; in this way, a set of units can be evaluated around the return to scale, which assumes technology as a means of production, where the increases and respective factors are shown in the same percentage (Abbott and Doucouliagos, 2003).
2.3. Research hypothesis formulation
The evaluation process of the universities tends toward a continuous improvement (Cáceres et al., 2014); thus, under agreements between academics and their central offices, the installed capacity in those institutions can be measured, responding to the needs of the educational environment. Under these circumstances, the DEA efficiency measures the relative capacity of a unit to obtain products based on available resources (Polo Fernández, 2019), qualifying as efficient for each year when those units obtain a greater combination of products in comparison with other units that obtain less with the same combination of resources. By combining the DEA efficiency and the average performance evaluation results for each unit, the relationship between the factors can be determined. Therefore, this approach allows assuming a hypothetical position in the current study, as defined below: H1 There is a relationship between technical efficiency and universities’ average evaluation results in 2009, in Ecuador. The selected period is strongly related to the impact and repercussions caused by the accreditation processes of the universities in Ecuador at that time.
This measure was the starting point for the evaluation as a way to refine and improve Higher Education. This favorable context encouraged the study of efficiency from a Data Envelopment Analysis perspective, whose importance captived the attention of academics and professionals to improve the education management. Another element motivating the development of this research is linked to a legal point of view. Here, the National Constituent Assembly of 2008 issued the Mandate No. 14 to promote the start of a mandatory evaluation led by the National Council for Evaluation and Accreditation (CONEA) to guarantee the quality, refinement, and improvement of Higher Education (García and Larrán, 2017).
2.4. Research Objective
Given the characteristics and scope of this research with literature review, it becomes clear the use the DEA-BCC (output-oriented) efficiency model of performance to scale, which justifies the position of relative technical efficiency according to the unit and maximization of outputs. It is notable that the amplitude of inputs captured the selection of the output-oriented DEA-BCC model. This change in orientation supposes the change in the coefficient between total output and total input (Boussofiane et al., 1991; Cáceres et al., 2014; Emrouznejad and De Witte, 2010).
Under the conceptual framework, the DEA is a measure that occupies a privileged position within research on efficiency (Agasisti et al., 2016; Agasisti and Johnes, 2010; Agasisti and Pérez-Esparrells, 2010; Cáceres et al., 2014); Dumitrescu et al., 2020; Quiroga-Martínez et al., 2018). This fact also motivated to investigate the evaluation and accreditation processes based on the reports issued by the control organisms (Cevallos, 2016; Martínez-Moscoso and Montesinos, 2012). Also, this research can be taken as an opportunity to present an academic and business position to evaluate the technical efficiency, thus, considering the objective of this work: to assess the relative efficiency from a perspective of data envelopment analysis in the universities of Ecuador, marking a multidimensional orientation with the substantive university functions (e.g., Teaching, Management, Research, and External Environment), their respective indicators, and parameters identified in the evaluation model of Ecuador, and systematically connected with the COOPER methodological ordering (Cáceres et al., 2014).
3. Methodology
A cross-sectional retrospective proposal was carried out to accomplish the objective of this work. This proposal allowed measuring the technical efficiency by applying the DEA model according to the decision units; without imposing the coexistence of any functional form of the data or making assumptions of inefficiency (Emrouznejad and De Witte, 2010).
3.1. Delineation of analysis units and evaluation criteria
Within the evaluation process framework of 2009 (study period under evaluation), 68 universities coexisted. However, 14 institutions were refined and closed. Hence, the study used only 54 universities categorized into A-B-C-D. Higher Education Institutions category A: Politécnica Nacional, Politécnica del Ejercito, Politécnica del Litoral, De Cuenca, Espíritu Santo, San Francisco de Quito. Higher Education Institutions categor y B: Politécnica de Chimborazo, Católica del Ecuador, Casa Grande, Católica de Santiago De Guayaquil, Central Del Ecuador, De Guayaquil, De las Américas, Del Azuay, Estatal de Milagro, Internacional del Ecuador, Nacional de Loja, Politécnica Salesiana, Internacional SEK Ecuador, Técnica de Ambato, Técnica de Manabí, Técnica del Norte, Tecnológica Empresarial de Guayaquil, Tecnológica Equinoccial, Estatal de Quevedo, Tecnológica Indoamérica, Técnica Particular de Loja. Higher Education Institutions category C: Agraria del Ecuador, De Especialidades Turísticas, Del Pacifico, Estatal de Bolívar, Estatal Del Sur De Manabí, Laica Eloy Al faro De Manabí, Laica Vicente Rocafuerte de Guayaquil, Metropolitana del Ecuador, Nacional de Chimborazo, Regional Autónoma de los Andes, Técnica de Babahoyo, Técnica de Machala, Israel, Técnica Luis Vargas Torres, Agropecuaria de Manabí. Higher Education Institutions category D: Católica de Cuenca, De Los Hemisferios, De Otavalo, Regional Amazónica, Estatal Península de Santa Elena, Iberoamericana del Ecuador, Internacional del Ecuador, Naval Comandante Rafael Moran Valverde, Politécnica Estatal del Carchi, San Gregorio de Portoviejo, Técnica de Cotopaxi, Tecnológica Ecotec. Higher Education Institutions performance, related to the valueadding results: academia, students, learning environment, research and internal management. The information collected for the study is supported by Art. 7 of the Organic Law of Transparency and Access to Public Information - LOTAIP. Adapted from “Accountability Reports 2016 of the Public Universities of Ecuador” by CEAACES. As shown in Table 1.
Table 1 Study population. Description of Academic Units (2009)
| Institutions | Academic Unit (%) | Category | Academics of the unit | Undergraduate students | Scientific production |
|---|---|---|---|---|---|
| 6 | 15,05 | A | 12,86 | 15,05 | 71,03 |
| 21 | 58,88 | B | 5,98 | 58,88 | 27,87 |
| 15 | 18,28 | C | 19,102 | 18,284 | 0,978 |
| 12 | 7,79 | D | 7,11 | 7,79 | 0,12 |
Source: Authors’ own elaboration.
3.2. Adaptation of the COOPER Methodological Order
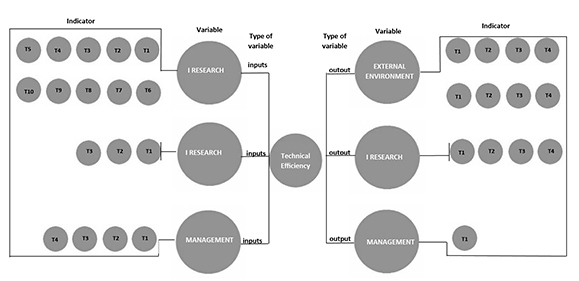
The method consisted of seven stages: a) Concepts and objectives. The input/output model of the technical efficiency of the universities and its base was defined; b) Data structuring. The selected parameters were Teaching, Management, Research, and External environment. The imputation was carried out using the METHOD.reason functions of the 54 units (Muñoz Rosas and Alvarez Verdejo, 2009), allowing the selection of the variables used in the model for the development of the study. Thus, inputs variables for Teaching: Teachers with a doctorate, Teachers with Master’s degrees, Full-time teachers, Part-time teachers, Trained teachers, Teachers, and Students. Inputs variables for Research: Research teachers, Research assistant students. Inputs variables for Management: Computers connected to students, Contracted Virtual Libraries, Employees, Trained Employees, and output variables. Inputs variables for Research: Published books, Reviewed journals, Unreviewed journals, Completed research projects. Inputs variables for External environment: Teachers with Participation in Community Engagement Programs, Society Engagement Programs, Students with Participation in Community Engagement Programs. Inputs variables for Management: Amount of Investment and Development 2008. The inputs were determined by resources affecting the units’ performance, and the outputs were determined based on the benefits obtained from the Units’ performance; c) Operational model. A deterministic non-parametric border model was used, and any deviation from the border was considered as inefficiency (Leal Paço and Cepeda Pérez, 2013); d) Performance comparison. The variables involved appeared from a literature exploration, functioning as adapted sources to assess the inputs as means of the production process, thus obtaining significant outputs from Teaching and Research activity carried out in universities (Agasisti et al., 2020; Ibáñez Martín et al., 2017; Johnes and Ruggiero, 2017; Johnes et al., 2020; Martín, 2006; Sagarra et al., 2017; Thanassoulis et al., 2016; Wolszczak-Derlacz, 2017). Initially, 17 inputs variables and 9 outputs variables were considered, as shown in Figure 1. However, a test performed to determine the adequate number of variables (Tables 2, 3) where the rules presented by the authors exceeded the standard, and the conditions were not met. This fact implied reducing the number of variables, subsequently applying a correlation to define the measure and quantify the information based on the variance of one input and one output around its mean (Cáceres et al., 2014). With this reference, by applying the rules again, the number of inputs and outputs was established, being less than or equal to the number of units to be evaluated, using four inputs and three outputs; e) Evaluation. Sensitivity and bootstrap assessments were carried out using MaxDEA 7 macro software, and sensitive properties to the sample composition were assumed. To overcome this scenario, bootstrap was used as an underlying element to analyze the efficiency measures’ sensitivity according to the sampling variations. These variations, in the technical efficiency were explicitly considered in the data quality, and technical efficiency indices were calculated for each institution by bootstrapping with 2,000 iterations at a 95% significance level; f) Results and implementation. MaxDEA 7 Model DEA softwares were used, a combination of “undesirable outputs” and “malmquist”, and JMT trial 14 JMP data analysis platform allowed the formalization of the results of the universities; g) Approach to the regression model. The measurement of the relationship between the Technical Efficiency with DEA and the Performance Evaluation was carried out using the linear regression as a technique in statistical modeling (Cáceres, et al., 2014); to predict the approximate value obtained from the data group in one variable, as of the values that related variables have. As a result, the current study showed the following regression equation Efficiency=0.864-0.267 (Evaluation, Accreditation, and Categorization).
Source: Authors’ own elaboration.
Figure 1 Selection of inputs/outputs for technical efficiency based on indicator
Table 2 Test on the number of variables
| Author | Condition | Test | Result |
|---|---|---|---|
| Golany et al., 1989 | 2(s + m)≤n | 2(9 + 16)≤54 | 50≤54 |
| Charnes et al., 1994 | 3(s + m)≤n | 3(9 + 16)≤54 | 75≤54 |
| Roget et al., 2005 | s * m ≤ n | 9 * 16 ≤ 54 | 144≤ 54 |
Note: s=output; m=input; n= total number of units. Adapted from “Analysis of technical efficiency and its relationship with the results of performance evaluation in a Chilean University” by Hernán Cáceres V., Werner Kristjanpoller R., and Jorge Tabilo A. (2014), 24, 199-217.
Source: Authors’ own elaboration.
Table 3 Test on the number of variables
| Author | Condition | Test | Result |
|---|---|---|---|
| Golany et al., 1989 | 2(s + m)≤n | 2(3 + 4)≤54 | 14≤54 |
| Charnes et al.,1994 | 3(s + m)≤n | 3(3 + 4)≤54 | 21≤54 |
| Roget et al., 2005 | s * m ≤ n | 3* 4 ≤ 54 | 12≤ 54 |
Note: s=output; m=input; n= total number of units. Adapted from “Analysis of technical efficiency and its relationship with the results of performance evaluation in a Chilean University” by Cáceres, H., Kristjanpoller, W., and Tabilo, J. (2014), 24, 199-217.
Source: Authors’ own elaboration.
4. Results
According to the DEA model with output orientation, technical efficiency was developed as the primary basis in this work. Thus, several adjustments to the model were made to configure it in seven variables: four inputs (m=4) and three outputs (s=3). This scenario allowed the performance evaluation of 54 universities, as described in the following sections.
4.1. CCR-O-BCC-O models and the efficiency and inefficiency score
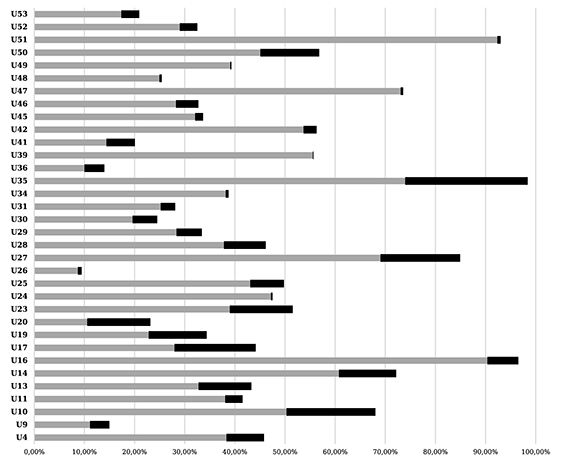
The average efficiency scores in the CCR-O and BCC-O models of the 54 DMUs showed that 16 and 20 universities were considered efficient, respectively. The institutions with the highest efficiency based on the categorization were: For the first model: 3 from A, 7 from B, 3 from C, and 3 from D. For the second model, 5 from A, 7 from B, 5 of the C, and 3 of the D. In the CCR-O and BCC-O models based on a set of references and the DMUs scores, the Polytechnic School of the Army and the Litoral of category A, the State Universities of the South of Manabí, and Israel of category C stood out (Table 4). In the first case, 38 DMUs were inefficient, with values ranging between 8.69%-99.23%; in the second case, 34 DMUs were inefficient, with values ranging between 9.44%-92.99%. The mean score reached 65.75%, and the standard deviation was 0.324 (Figure 2).
Table 4 CCR-O y BCC-O models and their efficiency scores
| Mean Efficiency with CCR-O model | Mean Efficiency with BCC-O model | ||||
|---|---|---|---|---|---|
| DMUs | (%) | Reference | DMUs | (%) | Reference |
| U1 | 100 | Politécnica Nacional | U1 | 100 | Politécnica Nacional |
| U5 | Especialidades Espíritu Santo | U2 | Politécnica del Ejercito | ||
| U6 | San Francisco De Quito | U3 | Politécnica del Litoral | ||
| U7 | Politécnica de Chimborazo | U5 | Especialidades Espíritu Santo | ||
| U8 | Católica del Ecuador | U6 | San Francisco De Quito | ||
| U12 | De Guayaquil | U7 | Politécnica de Chimborazo | ||
| U15 | Estatal de Milagro | U8 | Católica del Ecuador | ||
| U18 | Politécnica Salesiana | U12 | De Guayaquil | ||
| U21 | Técnica de Manabí | U15 | Estatal de Milagro | ||
| U22 | Técnica del Norte | U18 | Politécnica Salesiana | ||
| U33 | Eloy Alfaro De Manabí | U21 | Técnica de Manabí | ||
| U37 | Autónoma de los Andes | U22 | Técnica del Norte | ||
| U38 | Técnica de Babahoyo | U32 | Estatal Del Sur De Manabí | ||
| U43 | Católica de Cuenca | U33 | Eloy Alfaro de Manabí | ||
| U44 | De los Hemisferios | U37 | Autónoma de los Andes | ||
| U54 | Ecotec | U38 | Técnica de Babahoyo | ||
| U40 | De Israel | ||||
| U43 | Católica de Cuenca | ||||
| U44 | De los Hemisferios | ||||
| U54 | Ecotec | ||||
Note. Efficiency results of Schools and Universities of Higher Education of Ecuador base on DEA CCR-O model by Charner, Cooper, Rhodes and, BBC-O model by Banker, Charner, Cooper. Based on the average scores of the 54 DMUs, when their efficiency score is 100%. Adapted from MaxDEA 7 program.
Source: Authors’ own elaboration.
4.2. DEA model of scale efficiency and bootstrap
The scores in the first model revealed that 16 of the 54 DMUs showed Pure Technical Efficiency and were found on the efficient frontier. In the second model, 20 DMUs are considered efficient, and their mean scores ranged between 17.68%-100%. According to the categorization, the institutions that obtained the highest efficiency were: in the first model, 3 from A, 7 from B, 3 from C, and 3 from D. In the second model, there were 2 from A, 9 from B, and 9 of C (Table 5).
Table 5 DEA models of efficiency to scale and bootstrap of Schools and Universities of Higher Education
| Efficiency to scale | Efficiency to scale with bootstrap | ||||||||||
|---|---|---|---|---|---|---|---|---|---|---|---|
| DMU | ETG | ETP | EE | CTG | DMU | ETG | ETP | EE | R | CTG | |
| U1 | 1 | 1 | 1 | → Politécnica Nacional | A | U1 | 1 | 1 | 1 | →Politécnica Nacional | A |
| U5 | 1 | 1 | 1 | → Espíritu Santo | A | U3 | 1 | 1 | 1 | →Politécnica del Litoral | A |
| U6 | 1 | 1 | 1 | →Francisco De Quito | A | U9 | 1 | 1 | 1 | →Casa Grande | B |
| U7 | 1 | 1 | 1 | →P. de Chimborazo | B | U10 | 1 | 1 | 1 | →Santiago De Guayaquil | B |
| U8 | 1 | 1 | 1 | →Católica del Ecuador | B | U14 | 1 | 1 | 1 | →Del Azuay | B |
| U12 | 1 | 1 | 1 | →De Guayaquil | B | U 16 | 1 | 1 | 1 | →Internacional del Ecuador | B |
| U15 | 1 | 1 | 1 | →Estatal de Milagro | B | U 19 | 1 | 1 | 1 | →Internacional Sek | B |
| U18 | 1 | 1 | 1 | →Politécnica Salesiana | B | U 20 | 1 | 1 | 1 | →Técnica de Ambato | B |
| U21 | 1 | 1 | 1 | →Técnica de Manabí | B | U 23 | 1 | 1 | 1 | →Empresarial de Guayaquil | B |
| U22 | 1 | 1 | 1 | →Técnica del Norte | B | U 24 | 1 | 1 | 1 | →Técnica Equinoccial | B |
| U33 | 1 | 1 | 1 | →Eloy Alfaro | C | U 25 | 1 | 1 | 1 | →Estatal de Quevedo | B |
| U37 | 1 | 1 | 1 | →At. de los Andes | C | U30 | 1 | 1 | 1 | →Del Pacífico | C |
| U38 | 1 | 1 | 1 | →Técnica de Babahoyo | C | U31 | 1 | 1 | 1 | →Estatal de Bolívar | C |
| U43 | 1 | 1 | 1 | →Católica de Cuenca | D | U34 | 1 | 1 | 1 | →Vicente Rocafuerte | C |
| U44 | 1 | 1 | 1 | →De los Hemisferios | D | U35 | 1 | 1 | 1 | →Metropolitana | C |
| U54 | 1 | 1 | 1 | →Ecotec | D | U38 | 1 | 1 | 1 | →Técnica de Babahoyo | C |
| U39 | 1 | 1 | 1 | →Técnica de Machala | C | ||||||
| U40 | 1 | 1 | 1 | → De Israel | C | ||||||
| U41 | 1 | 1 | 1 | →Luis Vargas Torres | C | ||||||
| U42 | 1 | 1 | 1 | →Agropecuaria de Manabí | C | ||||||
Note. Efficiency results of Schools and Universities of Higher Education in Ecuador according to the DEA model of efficiency to scale and bootstrap. According to the scores of the 54 DMUs, when the efficiency score is 100%. Adapted from the MaxDEA 7 program.
Source: Author´s own elaboration
4.3. Scale efficiency and bootstrap with the inefficiency score
According to the evaluations, in the first model, 38 DMUs are technically inefficient and exhibited a relative efficiency value of less than 1. In the second model, 34 DMUs were inefficient. However, according to the original and bootstrap DEA models, the valuations are similar. In the first case, the average efficiency reached 88.16%, and in the second, it reached 78.27%. In general terms, efficiency ratings are positive. When comparing the models’ efficiency scores, the average overall technical efficiency reached 59.68%-65.49%; partial technical efficiency 65.75%-79.92%; scale efficiency 88.16%-78.27% (Table 6).
Table 6 Models of efficiency to scale and bootstrap according to the inefficiency scores
| Efficiency to scale | Efficiency to scale with bootstrap | ||||||||||
|---|---|---|---|---|---|---|---|---|---|---|---|
| DMU | ETG | ETP | EE | Performance | DMU | ETG | ETP | EE | Performance | ||
| U3 | 0,767105 | 1 | 0,767105 | Increasing | ↗ | U5 | 0,548593 | 0,664254 | 0,825879 | Increasing | ↗ |
| U10 | 0,503055 | 0,680203 | 0,739565 | Increasing | ↗ | U11 | 0,861699 | 1 | 0,861699 | Increasing | ↗ |
| U24 | 0,472109 | 0,474954 | 0,994009 | Increasing | ↗ | U 18 | 0,70344 | 1 | 0,70344 | Increasing | ↗ |
| U27 | 0,690408 | 0,849182 | 0,813027 | Increasing | ↗ | U26 | 0,546681 | 0,690381 | 0,791854 | Increasing | ↗ |
| U32 | 0,389562 | 1 | 0,389562 | Increasing | ↗ | U2 | 0,330705 | 0,673802 | 0,490805 | Decreasing | ↘ |
| U34 | 0,381651 | 0,387383 | 0,985203 | Increasing | ↗ | U6 | 0,354448 | 0,638076 | 0,555496 | Decreasing | ↘ |
| U39 | 0,555746 | 0,556845 | 0,998026 | Increasing | ↗ | U7 | 0,342738 | 0,549036 | 0,624254 | Decreasing | ↘ |
| U50 | 0,450894 | 0,568096 | 0,793693 | Increasing | ↗ | U8 | 0,470932 | 0,645248 | 0,729847 | Decreasing | ↘ |
| U51 | 0,9235 | 0,929859 | 0,993161 | Increasing | ↗ | U12 | 0,346814 | 0,889824 | 0,389756 | Decreasing | ↘ |
| U2 | 0,797888 | 1 | 0,797888 | Decreasing | ↘ | U13 | 0,447013 | 0,647849 | 0,689996 | Decreasing | ↘ |
| U9 | 0,111313 | 0,149798 | 0,743085 | Decreasing | ↘ | U 15 | 0,518454 | 0,816395 | 0,635053 | Decreasing | ↘ |
| U11 | 0,380704 | 0,41537 | 0,916541 | Decreasing | ↘ | U 17 | 0,171864 | 0,486126 | 0,353539 | Decreasing | ↘ |
| U13 | 0,327595 | 0,4329 | 0,756745 | Decreasing | ↘ | U 21 | 0,559304 | 0,600716 | 0,931061 | Decreasing | ↘ |
| U14 | 0,607629 | 0,721737 | 0,841898 | Decreasing | ↘ | U 22 | 0,671673 | 1 | 0,671673 | Decreasing | ↘ |
| U16 | 0,903742 | 0,965266 | 0,936262 | Decreasing | ↘ | U27 | 0,334333 | 0,61139 | 0,546842 | Decreasing | ↘ |
| U17 | 0,279714 | 0,441577 | 0,633443 | Decreasing | ↘ | U28 | 0,11479 | 0,134842 | 0,851296 | Decreasing | ↘ |
| U19 | 0,228169 | 0,343793 | 0,663683 | Decreasing | ↘ | U29 | 0,245358 | 0,788208 | 0,311286 | Decreasing | ↘ |
| U20 | 0,105587 | 0,231523 | 0,456055 | Decreasing | ↘ | U32 | 0,112512 | 0,370708 | 0,303505 | Decreasing | ↘ |
| U23 | 0,389922 | 0,515413 | 0,756524 | Decreasing | ↘ | U33 | 0,679872 | 0,709597 | 0,95811 | Decreasing | ↘ |
| U25 | 0,430719 | 0,497944 | 0,864994 | Decreasing | ↘ | U36 | 0,603201 | 0,772296 | 0,781049 | Decreasing | ↘ |
| U26 | 0,086949 | 0,094424 | 0,920841 | Decreasing | ↘ | U37 | 0,431905 | 0,887642 | 0,486575 | Decreasing | ↘ |
| U28 | 0,378169 | 0,461639 | 0,819186 | Decreasing | ↘ | U43 | 0,927976 | 1 | 0,927976 | Decreasing | ↘ |
| U29 | 0,283642 | 0,334117 | 0,848931 | Decreasing | ↘ | U44 | 0,283382 | 0,713378 | 0,39724 | Decreasing | ↘ |
| U30 | 0,196112 | 0,245091 | 0,800161 | Decreasing | ↘ | U45 | 0,694487 | 0,698234 | 0,994634 | Decreasing | ↘ |
| U31 | 0,252198 | 0,281027 | 0,897415 | Decreasing | ↘ | U46 | 0,618198 | 0,670025 | 0,92265 | Decreasing | ↘ |
| U35 | 0,739738 | 0,983877 | 0,75186 | Decreasing | ↘ | U47 | 0,485186 | 0,517804 | 0,937008 | Decreasing | ↘ |
| U36 | 0,100108 | 0,139672 | 0,716739 | Decreasing | ↘ | U48 | 0,928532 | 1 | 0,928532 | Decreasing | ↘ |
| U40 | 0,992296 | 1 | 0,992296 | Decreasing | ↘ | U49 | 0,403983 | 0,555299 | 0,727505 | Decreasing | ↘ |
| U41 | 0,143898 | 0,200599 | 0,717341 | Decreasing | ↘ | U50 | 0,115917 | 0,655323 | 0,176886 | Decreasing | ↘ |
| U42 | 0,537048 | 0,563002 | 0,953899 | Decreasing | ↘ | U51 | 0,481058 | 0,743221 | 0,647262 | Decreasing | ↘ |
| U45 | 0,320807 | 0,33663 | 0,952997 | Decreasing | ↘ | U52 | 0,223155 | 0,419548 | 0,531895 | Decreasing | ↘ |
| U46 | 0,282647 | 0,327281 | 0,863622 | Decreasing | ↘ | U53 | 0,209204 | 0,343684 | 0,60871 | Decreasing | ↘ |
| U47 | 0,730717 | 0,735607 | 0,993352 | Decreasing | ↘ | U54 | 0,30884 | 0,750558 | 0,41148 | Decreasing | ↘ |
| U48 | 0,249495 | 0,254182 | 0,981558 | Decreasing | ↘ | ||||||
| U49 | 0,3911 | 0,39292 | 0,995367 | Decreasing | ↘ | ||||||
| U52 | 0,290248 | 0,325246 | 0,892397 | Decreasing | ↘ | ||||||
| U53 | 0,173644 | 0,209253 | 0,82983 | Decreasing | ↘ | ||||||
Note. Efficiency results of Schools and Universities of Higher Education in Ecuador according to the DEA model of efficiency to scale and bootstrap. According to the overall technical efficiency, partial technical efficiency, scale efficiency ratings of the of the 54 DMUs, when their efficiency score is 100%. Adapted from MaxDEA 7 program.
Source: Authors’ own elaboration.
4.4 Sensitivity according to original and bootstrap scaling efficiency
Of 54 DMUs, the valuations of two groups were distinguished: bias and variance values, observing in all cases that the first group was higher than variance values. Concerning the different estimated confidence intervals, at least for the original scale and bootstrap efficiency data, a massive overlapping is imposed between the estimated intervals for the observations, with an initial efficiency calculated equal to 1 (Table 7).
Table 7 Sensitivity analysis according to the original efficiency to scale and bootstrap
| Unit | EE | EE Bootstrap | Bias | Standard Deviation | 95 % Confidence Interval | |
|---|---|---|---|---|---|---|
| Lower Frontier | Upper Frontier | |||||
| U1 | 1 | 1 | 0,000000 | 0,000000 | 1,0000 | 1,0000 |
| U5 | 1 | 0,825879 | 0,174121 | 0,123122 | 0,7423 | 1,0836 |
| U6 | 1 | 0,555496 | 0,444504 | 0,314312 | 0,3421 | 1,2134 |
| U7 | 1 | 0,624254 | 0,375746 | 0,265693 | 0,4439 | 1,1804 |
| U8 | 1 | 0,729847 | 0,270153 | 0,191027 | 0,6002 | 1,1297 |
| U12 | 1 | 0,389756 | 0,610244 | 0,431508 | 0,0968 | 1,2929 |
| U15 | 1 | 0,635053 | 0,364947 | 0,258056 | 0,4599 | 1,1752 |
| U18 | 1 | 0,70344 | 0,29656 | 0,209700 | 0,5611 | 1,1423 |
| U21 | 1 | 0,931061 | 0,068939 | 0,048747 | 0,8980 | 1,0331 |
| U22 | 1 | 0,671673 | 0,328327 | 0,232162 | 0,5141 | 1,1576 |
| U33 | 1 | 0,95811 | 0,04189 | 0,029621 | 0,9380 | 1,0201 |
| U37 | 1 | 0,486575 | 0,513425 | 0,363046 | 0,2401 | 1,2464 |
| U38 | 1 | 1 | 0,000000 | 0,000000 | 1,0000 | 1,0000 |
| U43 | 1 | 0,927976 | 0,072024 | 0,050929 | 0,8934 | 1,0346 |
| U44 | 1 | 0,39724 | 0,60276 | 0,426216 | 0,1079 | 1,2893 |
| U54 | 1 | 0,41148 | 0,58852 | 0,416146 | 0,1290 | 1,2825 |
| U39 | 0,99803 | 1 | -0,001974 | 0,001393 | 0,9971 | 1,0009 |
| U49 | 0,99537 | 0,727505 | 0,267862 | 0,189409 | 0,5989 | 1,1239 |
| U24 | 0,99401 | 1 | -0,005991 | 0,004236 | 0,9911 | 1,0029 |
| U47 | 0,99335 | 0,937008 | 0,056344 | 0,039840 | 0,9100 | 1,0204 |
| U51 | 0,99316 | 0,647262 | 0,345899 | 0,244587 | 0,4812 | 1,1592 |
| U40 | 0,9923 | 1 | -0,007704 | 0,005445 | 0,9886 | 1,0037 |
| U34 | 0,9852 | 1 | -0,014797 | 0,010465 | 0,9781 | 1,0071 |
| U48 | 0,98156 | 0,928532 | 0,053026 | 0,037496 | 0,9031 | 1,0070 |
| U42 | 0,9539 | 1 | -0,046101 | 0,032598 | 0,9318 | 1,0221 |
| U45 | 0,953 | 0,994634 | -0,041637 | 0,029440 | 0,9330 | 1,0146 |
| U16 | 0,93626 | 1 | -0,063738 | 0,045071 | 0,9057 | 1,0306 |
| U26 | 0,92084 | 0,791854 | 0,128987 | 0,091207 | 0,7299 | 0,9828 |
| U11 | 0,91654 | 0,861699 | 0,054842 | 0,038778 | 0,8354 | 0,9429 |
| U31 | 0,89742 | 1 | -0,102585 | 0,072535 | 0,8482 | 1,0492 |
| U52 | 0,8924 | 0,531895 | 0,360502 | 0,254916 | 0,3589 | 1,0654 |
| U25 | 0,86499 | 1 | -0,135006 | 0,095466 | 0,8002 | 1,0648 |
| U46 | 0,86362 | 0,92265 | -0,059028 | 0,041741 | 0,8353 | 0,9510 |
| U29 | 0,84893 | 0,311286 | 0,537645 | 0,380172 | 0,0532 | 1,1070 |
| U14 | 0,8419 | 1 | -0,158102 | 0,111794 | 0,7660 | 1,0759 |
| U4 | 0,83701 | 0,561333 | 0,275681 | 0,194933 | 0,4290 | 0,9693 |
| U53 | 0,82983 | 0,60871 | 0,22112 | 0,156355 | 0,5026 | 0,9360 |
| U28 | 0,81919 | 0,851296 | -0,03211 | 0,022702 | 0,8038 | 0,8667 |
| U27 | 0,81303 | 0,546842 | 0,266185 | 0,188223 | 0,4191 | 0,9408 |
| U30 | 0,80016 | 1 | -0,199839 | 0,141308 | 0,7042 | 1,0959 |
| U2 | 0,79789 | 0,490805 | 0,307083 | 0,217142 | 0,3434 | 0,9453 |
| U50 | 0,79369 | 0,176886 | 0,616807 | 0,436146 | -0,1192 | 1,0898 |
| U3 | 0,76711 | 1 | -0,232895 | 0,164678 | 0,6553 | 1,1118 |
| U13 | 0,75675 | 0,689996 | 0,066749 | 0,047202 | 0,6580 | 0,7888 |
| U23 | 0,75652 | 1 | -0,243476 | 0,172166 | 0,6396 | 1,1169 |
| U35 | 0,75186 | 1 | -0,24814 | 0,175461 | 0,6328 | 1,1191 |
| U9 | 0,74309 | 1 | -0,256915 | 0,181663 | 0,6198 | 1,1233 |
| U10 | 0,73957 | 1 | -0,260435 | 0,184152 | 0,6146 | 1,1250 |
| U41 | 0,71734 | 1 | -0,282659 | 0,199871 | 0,5817 | 1,1357 |
| U36 | 0,71674 | 0,781049 | -0,06431 | 0,045473 | 0,6859 | 0,8119 |
| U19 | 0,66368 | 1 | -0,336317 | 0,237814 | 0,5022 | 1,1614 |
| U17 | 0,63344 | 0,353539 | 0,279904 | 0,197920 | 0,2192 | 0,7678 |
| U20 | 0,45606 | 1 | -0,543945 | 0,384624 | 0,1950 | 1,2611 |
| U32 | 0,38956 | 0,303505 | 0,086057 | 0,060850 | 0,2622 | 0,4309 |
Note. Sensitivity analysis results according to the original efficiency to scale and bootstrap of Schools and Universities of Higher Education in Ecuador (54 DMUs). Adapted from MaxDEA 7 program.
Source: Authors’ own elaboration.
4.5 Data Envelopment Analysis and the Evaluation of Universities
From the relationship between DEA and the average results obtained after the universities evaluation, the value of R2=0.044 did not comply with the assumptions established for the regression model. Also, the value of β0 (constant) is positive, indicating a level of willingness to change when the efficiency variable does not intervene, such distinction possibly related to exogenous factors not considered in the model. The value of the significance test (p<0.05) showed a significant influence, and its assessment showed an impact on the efficiency. For the value of β1 (E-A and C), its relationship was negative for Evaluation, Accreditation, and Categorization. This result caused a negative impact of -0.267 to the change in efficiency. In contrast, in the significance test (p>0.05), the variable measuring the Evaluation, Accreditation, and Categorization on efficiency was significant (Tables 8, 9).
Table 8 DEA relationship versus the Evaluation, Accreditation and Categorization of Universities and Polytechnic Schools
| Unit | DEA efficiency | Performance evaluation | Unit | DEA efficiency | Performance evaluation |
|---|---|---|---|---|---|
| U1 | 1 | 0,6 | U28 | 0,851296 | 0,25 |
| U2 | 0,490805 | - | U29 | 0,311286 | 0,35 |
| U3 | 1 | 0,35 | U30 | 1 | 0,35 |
| U4 | 0,561333 | 0,45 | U31 | 1 | 0,45 |
| U5 | 0,825879 | 0,6 | U32 | 0,303505 | 0,45 |
| U6 | 0,555496 | 0,45 | U33 | 0,95811 | - |
| U7 | 0,624254 | 0,25 | U34 | 1 | - |
| U8 | 0,729847 | 0,45 | U35 | 1 | 0,45 |
| U9 | 1 | - | U36 | 0,781049 | 0,35 |
| U10 | 1 | 0,45 | U37 | 0,486575 | 0,45 |
| U11 | 0,861699 | 0,45 | U38 | 1 | - |
| U12 | 0,389756 | 0,45 | U39 | 1 | 0,35 |
| U13 | 0,689996 | 0,35 | U40 | 1 | 0,6 |
| U14 | 1 | 0,25 | U41 | 1 | 0,45 |
| U 15 | 0,635053 | 0,35 | U42 | 1 | 0,35 |
| U 16 | 1 | - | U43 | 0,927976 | 0,35 |
| U 17 | 0,353539 | - | U44 | 0,39724 | 0,25 |
| U 18 | 0,70344 | 0,45 | U45 | 0,994634 | - |
| U 19 | 1 | 0,35 | U46 | 0,92265 | 0,45 |
| U 20 | 1 | - | U47 | 0,937008 | - |
| U 21 | 0,931061 | 0,35 | U48 | 0,928532 | 0,45 |
| U 22 | 0,671673 | 0,45 | U49 | 0,727505 | 0,45 |
| U 23 | 1 | 0,25 | U50 | 0,176886 | 0,45 |
| U 24 | 1 | - | U51 | 0,647262 | 0,45 |
| U 25 | 1 | - | U52 | 0,531895 | 0,35 |
| U26 | 0,791854 | - | U53 | 0,60871 | 0,25 |
| U27 | 0,546842 | 0,35 | U54 | 0,41148 | 0,45 |
Note: Identification of the decision-making units DMUs based on the selection of the input-output variables according to the original efficiency to scale and bootstrap, in order to take into account the sensitivity analysis and the linear regression to measure technical efficiency and the average evaluation results of Higher Education Institutions in Ecuador, period 2009, where the performance evaluation process is structured according to the report presented by CONEA, based on the methodology of Data Envelopment Analysis and adapted from MaxDEA 7 program.
Source: Authors’ own elaboration.
Table 9 Regression analysis of DEA efficiency against the Evaluation, Accreditation and Categorization of Universities and Polytechnic Schools
| Correlation | ||||||||||
|---|---|---|---|---|---|---|---|---|---|---|
| Model | R | R squared | R squared adjusted | Standard error of the estimate | Change statistics | |||||
| Change in R squared | Change in F | df1 | df2 | Sig. Change in F | ||||||
| 1 | 0,210a | 0,044 | 0,026 | 0,2389346 | 0,044 | 2,392 | 1 | 52 | 0,128 | |
| The equation is: Efficiency =0,864-0,267 Evaluation, Accreditation and Categorization | ||||||||||
| Predictor | Coef | Coef. EE | T | P | ||||||
| β0 (Constant) | 0,864 | 0,062 | 13,998 | 0,000 | ||||||
| β1 (E, A and C) | -0,267 | 0,173 | -1,546 | 0,128 | ||||||
| Variance analysis | ||||||||||
| Model | SC | DF | MC | F | P | |||||
| Regression | 0,137 | 1 | 0,137 | 2,392 | 0,128b | |||||
| Residue | 2,969 | 52 | 0,057 | |||||||
| Total | 3,105 | 53 | ||||||||
Note: Linear relationship between variables of DEA efficiency and evaluation Accreditation and Categorization of Universities and Polytechnic Schools of Ecuador, period 2009.
Source: Authors’ own elaboration.
5. Discussion
For Ecuadorian universities, the input variables revealed that the Teaching-Research-Management component reached the highest significance and performance when using: D1, D7, D8, Iv3, G2, and G3. In the output variables, the Research-External Environment component reflected the best performance when using: Iv7, Me1, Me2, Me3, and Me4, characterized by a relatively significant correlation (Johnes, 2008).
Efficiency assessments were sensitive in terms of returns to scale. It was shown that the set of possibilities may be built upon the assumption of constant returns or have assumed returns to scale variables (Cadavid et al., 2016). This scenario is not indifferent, based on the set of possibilities of the institutions regarding their varying sizes and length, and also concerning scale inspected by a control body, with the possibility of choosing the hypothesis of variable returns of scale.
The identification and measurement of output’s input were complex but achieved as a result of a combination of inputs, which allowed linking ratios for measuring productivity and different variables involved with the object of study. Furthermore, this representation led to the orientation of the research input, which could be considered an alternative for a more completed multiple-input used in the definition of productivity.
In the technical efficiency of scaling with bootstrap, there was an approximation, and the bias was different for each institution. This fact generated an estimation sample of the true value of the function at the frontier, which distinguishes the bias that each institution reached and subtracted the estimated efficiency of the original DEA, compared to that obtained with the bootstrap (Emrouznejad and De Witte, 2010).
Within the model’s sensitivity, the outputs’ ranges were shown, observing the institutions remain efficient. This fact revealed a measure of the robustness of the model below the precision limits for evaluating performance. Based on the results, establishing the relationship between technical efficiency and the average results in the universities evaluation in 2009 was the main finding of this work, which previously did not exist in Ecuador, as also stated by Cáceres et al., (2014) and Cadavid et al. (2016) in their researches.
6. Conclusions
As of today, this work represents the first attempt at evaluating efficiency in Ecuador. The findings provide greater academic knowledge about the evaluation process of 54 universities categorized into five groups: A-B-C-D-E in 2009. This work is particularly of interest to the universities of Ecuador, and its genesis allowed the assessment of relative efficiency from a data envelopment analysis perspective. This analysis was configured according to the DEA-BCC model of output-oriented with performance to scale, whose structure allowed the maximization of outputs to identify the strengths and weaknesses among universities.
When comparing the real and specific values of Teaching-Research-Management, it is evident that inefficient DMUs obtained only 33.33%. Therefore, the difference between the real values and the objectives of this input variable did not significantly affect the efficiency scores. In contrast, the real values of Teaching-Research indicated that inefficient DMUs reached 61.11%, 55.55% in Teaching, and 48.14% in Teaching-Management. Therefore, the Units are over-endowed with these parameters in their results based on their real values.
The model used in Ecuador for the evaluation processes helped measure performance. However, its global scope can distort the reality of technical efficiency because it depends upon the resources allocated to universities. From this scenario, based on a simple linear regression analysis, the null hypothesis is accepted (p>0.05), which states that there is no relationship between technical efficiency and the average results of the institutional evaluation. Therefore, according to empirical evidence, the potential of the DEA to evaluate efficiency in the university context is relative. However, future research is not ruled out, as the input of other multi-criteria processes may result in great interest that benefits the management operating with public funds.

