


 English (pdf)
 Article in xml format
 Article references
 Send this article by e-mail
 Cited by SciELO
  Cited by Google
  Similars in
SciELO
Similars in
SciELO  Similars in Google
 Permalink
1. Introduction
Traditional management literature affirms that the cornerstone of any company’s strategic management process consists of having a purpose and a projection of future aspirations (Bowen, 2018). In this spirit, different approaches are devoted to documenting the definition and particularities that the mission and vision of a company must contain, highlighting its application scenarios and benefits (Dobrinić and Fabac, 2021; Leuthesser and Kohli, 1997). This condition is widely present in the business context. It can be said, for example, that missions and visions are almost omnipresent aspects in the official narrative of any organization (Khalifa, 2011). For instance, they tend to be an essential part of training outlines, plans, analysis of methods, processes, and job positions, in the certification and accreditation processes, in organizational communication campaigns, and even in the adoption of social responsibility and sustainability practices. However, a fundamental question arises regarding their functional role in achieving strategic objectives once there is a properly structured and socialized statement of these elements.
It seems correct to assume that any company needs to establish a transparent system of beliefs and objectives that guide its decisions and improve its performance. However, the reason for concentrating a strong inspirational idea in separate mission and vision statements are not fully understood (Bartkus et al., 2006). Most of the previous works have not been able to demonstrate a clear link between the simple existence of these two elements, typical of the strategic framework, and financial performance at the level of the firm (Baetz and Bart, 1996; Bartkus et al., 2006; Degefu, 2007; Mittal and Srihari, 2021). Understanding that one can measure a company’s competitiveness in terms of its ability to appropriate value (Hoffmann et al., 2018), there is still no clear evidence suggesting that a high-quality mission or vision ensures an increase in such performance. However, something that is evident is that despite the above, there is still an exciting space for deepening to address the actual use of these elements (Alegre et al., 2018; Khalifa, 2011; Kirkpatrick, 2017; Powers, 2012). This study intends to contribute to the debate on the convenience of having a well-constructed mission and vision to achieve a company’s strategic objectives. Its purpose addresses the following question: How are the quality of the statement, planning, and construction of the mission and vision of a company associated with its Value Appropriation (VA) capacity? In this way, through the proposal of a structural theoretical model, the study uses constructs and deductions based on the theory that allows glimpsing the existence (or not) of a potential benefit of said elements on the competitiveness of a company.
The contributions derived from this study are both theoretical and practical. On the one hand, the plausibility of its approach provides a conceptual proposal to a problemraised within the broad topic of strategic management. On the other hand, its results offer a very grounded perspective about formulating and implementing strategies, with particular emphasis on the concepts of mission and vision, as well as their relationship with the competitive capabilities of a company. Finally, the work invites using these results from new research paradigms and in new contexts to complement and contrast the knowledge produced.
2. 2. Creating and Appropriating Value
With the idea of illustrating the concept of value, a sequential chain is considered that extends from the providers of resources, through the company itself, to the buyers of its products or services. The synergy between these components allows the creation of value within such a chain (Miguel et al., 2014). After the system creates value, they question how much of the value created is effectively appropriated by them. The answer to this question is that the negotiation between them determines the division of value; that is, the portion of the value claimed by each component refers to its value appropriation (Brandenburger et al., 2015).
The negotiation between suppliers and the company determines the price the suppliers receive for supplying resources to the company and, equivalently, the cost that the company assumes for those resources. Similarly, the negotiation between the company and the buyers agrees on the price the buyers are willing to pay for the services or products offered, that is, the amount that the company receives for the sale of a particular value offer. This phenomenon is how creating value to be distributed among the different stakeholders relates to VA. To the extent that the company is capable of balancing the creation of value claimed by each component (Brandenburger et al., 2015). In this regard, it is necessary to comment that, over time, the concept of VA has become the basis for defining the concept of Competitive Advantage (Hoffmann et al., 2018).
A significant contribution to better illustrate competitive advantage comes from Porter (1989): “Competitive advantage stems fundamentally from the value that a company is capable of creating value for its buyers, which exceeds what it costs the firm to create it. Value is what buyers are willing to pay, and superior value derives from offering lower prices than competitors for equivalent benefits or offering unique benefits that offset a higher price” (p. 3). Once the buyer agrees to pay that price, one can affirm that a value appropriation takes place. The latter occurs in a double way between the customer and the company, which means materializing the company’s competitive advantage.
On the other hand, competitiveness as a comparative measure between companies within an industry closely relates to a competitive advantage since a company has to fight to achieve and maintain that advantage. When a company has effectively reached a competitive advantage, the others will begin to work to match this advantage or even exceed it. This behavior is the true dynamic of a competitive market, where the company with the greatest competitiveness stands out. Also, authors like Fitzsimmons et al. (2022), Laser (2021), and Mittal and Srihari (2021) validate that the sufficiency of the activities that can contribute to the company’s performance is determined by competition, hand in hand with innovation or a unified culture. The competitive strategy strives to position itself profitably and sustainably beyond the weight of the industry’s competition. Thus, the debate regarding the concept of competitive advantage goes beyond the simple achievement of superior performance. Instead, it would be converging towards an issue of creation (and appropriation) of superior value (Miguel et al., 2014).
3. Mission and Vision as Foundations of the Strategic Framework
Previous studies have pointed out the relevance of a well-structured public presentation of the mission and vision as an essential part of the strategic framework of any company (Berbegal-Mirabent et al., 2021; Fitzsimmons et al., 2022; e.g., Bratianu and Balanescu, 2008; López-Morales and Ortega-Ridaura, 2016). Some authors go so far as to suggest that mission and vision are every company’s first boss and leader. Expressly, in some theoretical contexts, it is implied that the declaration of these components is the key for a company to be competitive in the market and increase its comprehensive strategy (Knikker, 2021). Relevant literature even insinuated that these components make a company stand out from its competitors in terms of its identity. Furthermore, it suggests that they encourage all who make up the company to prioritize and achieve the fulfillment of objectives through the collective conception of a common goal (Bowen, 2018). A direct approach to these notions must delve into their particularities.
3.1. Mission
Although it still lacks theoretical depth, the topic related to the organizational mission is widely present in managerial practice (Alegre et al., 2018; Powers, 2012). However, the literature has various definitions of a company’s mission statement. While some focus on their core purpose and ideology, others focus on the components and scope of processes and operations (Mittal and Srihari, 2021). Fred (2003), for example, stated early on that “a mission statement refers to three things about a company: who it is, what it does, and whom it wants to serve” (p. 59). In this line, many entrepreneurs and managers understood that more than the objectives themselves, priority should be given to the organizational identity and its unique character; that is, to the definition of ‘who we are’ above ‘where we are heading.’ This direction may change as the context becomes dynamic, but the source of guidance and inspiration is not redirected; moreover, it is fed from the same central ideology. This ideology provides a related identity that can increase internal and external reputational capital and lengthen the product’s duration in the market and commercialization cycles (Collins and Porras, 1996; Yadav and Sehgal, 2019).
Some conceive the mission as a valuable mechanism to specify the organizational goals and enable the translation of these goals into objectives (susceptible to be evaluated and controlled in terms of cost, time, and performance) (Baetz and Bart, 1996). In their study of Canada’s 500 largest industrial companies, they found that the body of a joint mission statement, or organizational purpose, can consist of: a single financial objective (to increase profitability and long-term value); no financial goal (provide a challenging work environment); a statement of value/belief/philosophy (to be a responsible company); the definition of success (meeting or exceeding customer expectations); the achievable prioritized that the company has; define its strategy (description of specific products and markets, and fundamentals to compete) and finally the reference to one of the interested parties, popularly called in the literature as stakeholders. Therefore, considering the different company’s stakeholder groups, a mission’s objective provides coherence to the corporate principles.
However, the question is still in place as to whether having these ingredients in a company’s mission benefits it. The work developed by Pearce and David (1987) suggests that it is so. This study was the first empirical approach to the relationship between what contains a mission and the involved company’s performance. The purpose of that study was to verify the integrity of the value of the mission statements through a content analysis that allowed them to identify their components. The findings supported the content of a mission as a predictive variable of results since it was associated with better financial performance. However, numerous variables affect this phenomenon; therefore, it would be inaccurate to suggest that a good mission constantly improves a company’s organizational performance.
In this same way, as suggested by Alegre et al. (2018) and Yadav and Sehgal (2019), the fact that a company has a complete mission statement does not assure it of exceptional performance; on the contrary, it may face a decrease in sales and profits for different reasons. However, academia had traditionally accepted that better-performing companies maintained substantially more elaborate mission statements. Things, however, have changed over time. Nowadays, direct and efficient mission statements that condense the very essence of the organizational concept in one or two lines are highly valued (Ismail et al., 2016; Powers, 2012).
Now, according to the previous related contributions, different results are obtained that confirms the influence that certain variables have in the construction of a mission statement, which in turn can impact the value appropriation of the parties involved in a company. Sofijanova and Marjanova (2014), for example, in their study, applied to 38% of the companies registered in the confectionery industry in Macedonia. They conclude that a highly comprehensive mission statement has a significant correlation and directly influences market share; that is, it directly affects the performance of companies. Likewise, the analysis demonstrates that a model of components and critical terms of a mission statement can work as a guide for constructing an adequate organizational mission. Furthermore, while the study acknowledges some limitations due to sample size and industry choice, its empirical findings help provide a more accurate perspective of the relevance of the mission statement and how it can affect business outcomes.
From another perspective, Degefu and Ayeneu (2007), following the line of Baetz and Bart (1996) and de Bartkus et al. (2006), questioned whether the components of corporate mission and values have a significant impact on a company’s performance. In their investigation, these authors analyze the mission of Ethiopian companies in the financial services industry. The study concludes that there are no significant differences in performance between companies that have mission statements and those that do not, nor between those with missions of different strategic orientations. These results could have been due to the low content of strategic values in the analyzed companies since their application could have supported the company’s strategic management processes.
What this study proposes assumes that structuring a quality mission statement within a company’s strategic framework could influence its financial performance, adding value and, ultimately, improving its competitive position based on the construction of a unique value positioning. Thus, the first hypothesis arises:
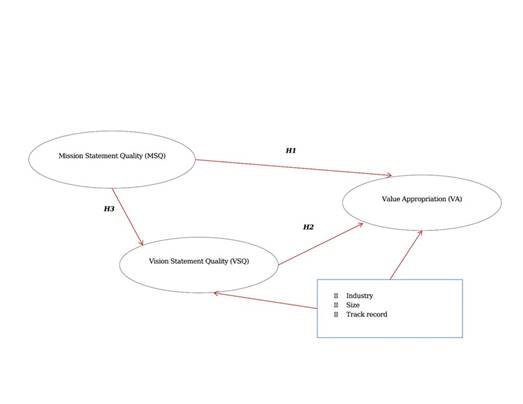
H1: There is a positive association between Mission Statement Quality (MSQ) and VA as an approach to competitiveness in a company.
3.2. Vision
In practice, the components of a strategic framework are likely to be confused (Khalifa, 2011). However, according to Bratianu and Balanescu (2008), unlike the mission statement, a vision statement can be considered an idealistic representation of a company in a defined futuristic scenario with a mature and successful position. The vision statement is a projection that allows stakeholders to foresee what the company could be and could achieve. However, a company’s management must define the foundation of this projected image in its current business dynamics.
Within the components that an adequately structured vision must have, Kirkpatrick (2017) suggests, based on the findings of several studies, that vision statements containing the following attributes are related to excellent organizational performance. According to this postulate, a vision must be: clear (possessing a high degree of understanding on the part of the employees); future-focused (having the ability to describe the desired future and not the desired present); abstract, and challenging (providing a concrete, difficult but attainable future scenario); idealistic (portraying a highly desirable future design); short (providing a brief statement that is easy to remember); unique (describing how the company differs from others, including its products and services, markets, strategy, or history); and, finally with its definition of success (which indicates how the company measures its progress in achieving the desirable future). Although the different studies have not yet been able to specify the exact combination of which characteristics are necessary for its effectiveness, they suggest that clarity, future focus, abstraction, challenge, and idealism are more relevant than the others (Carton et al., 2014).
For their part, Collins and Porras (1996) point out that for a vision to be considered well-conceived, it is necessary to consider what they designate as a visualized future, from which two parts branches: a bold objective and a vivid description. The former presents a clear finish line, with a time horizon of 10 to 30 years, designated BHAG (Big, Hairy, Audacious Goal), which should be clear and compelling, as well as serve as a unifying focal point of efforts to act as a catalyst for team spirit. The second represents an intense and striking description of the expected future when the company reaches its BHAG.
The preceding insight has been validated to the point that the field of human resource management, an area traditionally located on the margins of the strategic debate of organizations, has increasingly come to represent the collective conception of an adequate vision (Laser, 2021). The declaration of a high-quality vision statement unifies what contributes knowledge, intelligence, and values to all employees. This set of conditions must occur to position it as a force that leverages the potential of organizational intellectual capital. Therefore, if the collaborators share the same future image of their company, they will strive to find the best solution to transform that vision into reality. In this sense, adequately communicating a vision affects organizational performance.
In a large longitudinal study devoted to examining the effects of vision on performance, Baum et al. (1998) found that the vision’s content and attributes can impact a company’s growth. However, according to this study, factors such as context, size, and setting can affect the effectiveness of the respective vision statements. Later, Jing et al. (2014) evaluated the relationship between the way a company’s management communicates its vision statement and the performance of 100 retail companies in Australia. They analyzed the impact on four measures of organizational performance: financial evaluations, employee and customer satisfaction, productivity, and staff retention, concluding that there was a positive correlation between such communication and several organizational parameters. They also found that those managers who communicated the vision to staff outperformed their counterparts on several performance measures.
In the same way, Gulati et al. (2016) evaluated the link between the quality of vision statements and organizational performance in hospitals in the United States, based on the four performance measures used by Jing et al. (2014). Their study revealed a direct and statistically significant link between vision statements and at least one of the four performance measures evaluated. All of the above leads to a clear idea. Consequently, the second hypothesis of this research is as follows:
H2: There is a positive association between Vission Statement Quality (VSQ) and VA as an approach to competitiveness in a company.
Finally, the present study aims to explore other relationships and use coherent logic in the face of what prescribes the conventional strategic design process. For that reason, it is possible to infer that the strategic framework statement’s components maintain its sustained quality. Thus, this study proposes that:
H3: There is a positive association between the MSQ and the VSQ of a company.
Figure 1 presents the proposed theoretical model.
4. Method
4.1. Data collection
The geographical context of this study is located in the department of Santander, which ranks third in the Colombian Competitiveness Index 2019 (IDC-2019). Within the seven years of measuring the Index, Santander stands out for obtaining the highest rating in 2019 with 6.29 out of 10. The study used the document “500 Empresas Generadoras de Desarrollo en Santander” (500 companies that generate development in the Department of Santander; Vanguardia, 2019), which reports the list of companies with the most representative business volume during 2018 in such Colombian region. The sample comprises 120 companies whose mission and vision were updated and published on their respective web page. Simultaneously, it was verified whether these companies have the financial information for the year 2018 since these data were necessary for the calculation of the indicator of the dependent variable. This information was collected from a local database named ‘Compite 360’ (Cámara de Comercio de Bucaramanga, 2020).
This study’s sample size is valid for accomplishing its purpose (Hair et al., 2022). The preceding circumstance occurs since, according to this criterion, the minimum acceptable sample would be 40 companies (i.e., ten times four). This quantity is the number of factors that, as will be seen below, make up the measurement of the latent variable with the largest number of items in the model (four items), which corresponds to MSQ.
4.2. MSQ and VSQ measurement
The instruments to evaluate the quality of the structure of each statement are as follows. For the latent variable MSQ, the measure comprises four observable variables: Stakeholders, components, objectives/purpose of the company, and clarity/coherence of the statement. For VSQ, we evaluate two factors: the BHAG and the existence of a ‘vivid description.’ Each factor is, in turn, made up of dichotomous variables (which can only take two possible values; i.e., the element described in the variable is found or not within the corresponding declaration). This arrangement improves the ease of understanding the results by representing the percentage of compliance (0-100%) of the respective factor.
We must highlight that we identified these factors and variables through content analysis. They follow the previous contributions of Bartkus et al. (2006), Berbegal-Mirabent et al. (2021), Collins and Porras (1996), Leuthesser and Kohli (1997) and Pearce and David (1987). These works prescribed those components that should be considered when building a company’s mission and vision statements. To do so, we had to define the keywords and specific terms that identified each variable. The purpose of doing the latter is to avoid the subjectivity and bias of the evaluator at the time of determining whether the statement contained them. Tables 1 and 2 present the factors and their respective measurement variables.
Table 1 Measurement factors and variables to determine the quaity of a mission statement structure
| Factor | variables |
|---|---|
| Stakeholders | Customers, employees, investors, society, and suppliers. |
| Components | Industry, geography, values/philosophy, differentiating factor, future orientation. |
| Objectives/Purposes | Provide a sense of direction, serve as a control mechanism, assist with non-routine decision making, and serve as a motivational/inspirational tool. |
| Clarity and coherence in the statement | The clear and coherent idea of what the company is, where it wants to go, and the impact that the company intends to generate. |
Source: Authors’ own elaboration.
Table 2 Factors and measurement variables to determine the quaity of a vision
| Factor | variables |
|---|---|
| BHAG | Specific, measurable, temporary. |
| Vivid Description | Idealistic descriptions, ethereal words, differentiating factors. |
Source: Authors’ own elaboration.
To measure the concordance in the judgment of assigning the qualification by the two study evaluators, each of them worked with the entire dataset individually. Later, we validated such concordance through the measurement of the Kappa index (K). According to the respective comparison system (Dettori and Norvell, 2020), the study found concordance forces for both MSQ and VSQ measurement instruments. The values obtained were very high (K=0.818) and high (K=0.792), respectively.
4.3. VA-related indicator measurement
The financial information collected determines the percentage of value appropriation from the parametrized operating profit figures. This value is obtained by homogenizing the sales revenue of all the companies by a factor of 100 percentage points. Then, the study calculates the proportional value represented by the cost of sales, gross profit, and operating expenses. Finally, the corresponding VA is calculated (Ortiz, 2018). Clarifying each financial statement is essential to highlight we achieved that parameterization. For this purpose, only those revenues related to the respective company’s core business are considered, omitting those that have nothing to do with it. This last criterium is applied to make companies comparable since one can know their competitiveness by comparing them under the same parameter when selling products or providing services in different industries. To better illustrate this point, Table 3 exemplifies the concept of parameterization.
Table 3 Example Calculation of the value appropriation indicator
| Nominal values | Parameterized values | |||
|---|---|---|---|---|
| Company 1 | Company 2 | Company 1 | Company 2 | |
| Sales revenue | $1,115,338 | $455,568 | 100.00 | 100.00 |
| Costs of sale | $814,120 | $373,439 | 72.99 | 81.97 |
| Gross profit | $301,218 | $82,129 | 27.01 | 18.03 |
| Operating expenses | $80,586 | $63,510 | 7.22 | 13.94 |
| Other Expenses | $102,658 | $53,021 | 9.20 | 11.64 |
| Appropriate Value | $117,974 | -$34,402 | ||
| VA indicator | 10.58 | -7.55 | ||
Note. The nominal values presented in the table are in millions of Colombian Pesos (COP).
Source: Authors’ own elaboration.
4.4 Control variables
To neutralize the effects certain external elements can exert on the dependent variable, the model managed to be controlled (obtaining p>0.05) by three variables: industry, size, and company track record. They, in turn, provide a descriptive characterization of the sample.
4.5. Data analysis
In search of concrete results on the formulated hypotheses, we proceed with a PLS-SEM, using SmartPLS V3, a specialized software widely used for this type of modeling. The treatment given to the constructs in this research corresponds to latent variables measured by observable variables or indicators, as shown in Table 4.
Table 4 Coding of observable variables or Indicators
| Latent Variables/Constructs | Observable Variables/ Indicators | Monogram |
|---|---|---|
| Mission Quality | ----- | MSQ |
| Stakeholders | STH | |
| Objectives | OBJ | |
| Components | COMP | |
| Clarity and consistency | C&C | |
| Vision Quality | ---- | VSQ |
| Big, hairy, audacious goal | BHAG | |
| Vivid description | VD | |
| Value Appropriation | ---- | VA |
| Value Appropriation | VA |
Source: Authors’ own elaboration.
The PLS-SEM is a robust and flexible approach. Simultaneously, very suitable for exploratory studies that seek to carry out the causal-predictive analysis of the study variables. The data were analyzed in two simultaneous steps: the first by running the PLS algorithm, where we determined the reliability and validity of the measurement model, and the second by running bootstrapping, where the software assessed how variables were related (Hair et al., 2022). Based on the proposed structural model and the results obtained, in terms of the correlation between the variables, the aim was to validate or reject the hypotheses proposed. We determined these results by observing the values of two statistical elements provided by the software, the p-value (level of statistical significance) and the correlation coefficient or path coefficient (β). We obtained values of β between 0 and 1. They indicated that the closer the value is to 1, the more significant the correlation between the constructs. The correlation coefficient is validated when β>0.2 (Hair et al., 2022). The p-value for its part should be lower than 0.05; the closer its value is to 0, the greater its significance will have (Lowry and Gaskin, 2014)a form of structural equation modeling (SEM. The higher the β value and the lower the p-value, the stronger the correlation between the variables, which leads to validating the corresponding hypotheses.
When running the PLS algorithm, calculating 5,000 iterations at a default estimated stop criterion of 10-7, we obtained the external measurement model’s Factor Loadings (FL). These represented each indicator’s total contribution to the definition of the respective latent variable. FLs vary between 0 and 1 (greater force closer to 1). Following the agreement, this type of FL under these models (reflective) must be greater than the value of 0.5. This level assumes that its factor explains 50% of the variance of the indicator. When the interval of an FL is between 0.4 and 0.5, it is recommended to remove the corresponding item, which improves the composite reliability.
We also calculated each construct’s reliability coefficient of Cronbach’s Alpha (α). They generally range between 0 and 1, indicating greater consistency of scale closer to the value of 1 (Chan and Lay, 2018). However, α is not a 100% reliable measure when two or three components comprise the corresponding scales (Hair et al., 2022). This is why considering that only two indicators measure the latent variable VSQ, the Composite Reliability (CR), is also calculated as a measure of internal consistency. For interpretation and exploratory purposes, the study accepted a CR value equal to or greater than 0.6 (Chan and Lay, 2018).
5. Results
The first instance presents a general panorama of the analyzed sample. We use traditional descriptive statistics and profile the data according to the previously defined control variables (Table 5).
Table 5 Descriptive analysis of the sample
| Control Variable | Description | Frequency | % | p-value |
|---|---|---|---|---|
| Industry | Primary | 3 | 2.50 | 0.553 |
| Secondary | 46 | 38.33 | ||
| Tertiary | 71 | 59.16 | ||
| Size | Big | 61 | 50.83 | 0.674 |
| Medium | 15 | 41.67 | ||
| Small | 7 | 5.83 | ||
| Micro | 2 | 1.67 | ||
| Track record | Youths | 75 | 62.50 | 0.565 |
| Mature | 45 | 37.50 |
Source: Authors’ own elaboration.
On the other hand, Table 6 shows the data related to the variables’ measurements and the constructs’ reliability. Likewise, Table 6 reports the adjustments made because of the FLs. To improve the model’s CR, we removed those items with an FL inferior to 0.5. The above circumstance was the case with the item related to the Stakeholders (FL=0.338).
Table 6 Reliability analysis and validation
| Latent Variable/ Observable Variable | Arithmetic Mean | Standard Deviation | Factor Loading | VIF | α | CR | AVE | R2 |
|---|---|---|---|---|---|---|---|---|
| MSQ | 0.829 | 0.886 | 0.729 | ----- | ||||
| STH | 0.731 | 0.443 | 0.379* | ---- | ||||
| OBJ | 0.647 | 0.478 | 0.951 | 3.255 | ||||
| COMP | 1.000 | 0.000 | 0.945 | 3.057 | ||||
| C&C | 0.947 | 0.223 | 0.623 | 1.434 | ||||
| VQS | 0.570 | 0.813 | 0.687 | 0.054 | ||||
| BHAG | 0.250 | 0.433 | 0.722 | 1.189 | ||||
| VD | 0.723 | 0.447 | 0.921 | 1.189 | ||||
| AV | 1.000 | 1.000 | 1.000 | 0.028 | ||||
| AV | 0.000 | 0.000 | 1.000 | 1.000 |
*Note: We discarded the indicators that obtained FLs lower than 0.5.
Source: Authors’ own elaboration.
The initial calculations show that it was possible to validate the internal consistency (reliability) of the applied measurement scales, CR>0.6, in each latent variable. This result was obtained, despite the randomness of the items in the measurement instrument. Likewise, continuing with the validation of the measurement model, the results provided by the convergent validity of the constructs through the Average Variance Extracted (AVE) reflect that the values exceed the limit of 0.5 for all the constructs, corresponds to that suggested by Chan and Lay (2018).
On the other hand, we verified the non-existence of multicollinearity problems between the latent variables (constructs) and the observable variables (i.e., their measurement items). The presence of collinearity would increase the standard error and would not allow to clearly distinguish the individual effect of each of the latter on the construct they are measuring. Therefore, we used the VIF indicator (variance inflation factor) to evaluate multicollinearity. The result obtained for all the items of the construct is a VIF value below 3.3, reflecting the non-existence of multicollinearity (Hair et al., 2022).
Similarly, Pearson’s coefficients of determination (R 2 ) stand out, which measure the percentages of variation of the endogenous variables that explain their link with one or more predictor variables, indicating the quality of the model fit. Methodological literature suggested that R 2 values between 0.02 and 0.13 show a low fit. The R 2 values obtained in this study (Table 6) have this condition; however, according to Lowry and Gaskin (2014), a low R 2 is not decisive in the interpretation of the significant association of the variables since it can obtain high or low values and maintain the relationship between them. Finally, we examined discriminant validity. Statistically, the correlations between latent variables should not exceed the square root of the corresponding AVE (Chan and Lay, 2018). Consequently, all the variables showed a satisfactory discriminant validity, indicating that the scales have correctly measured their respective constructs (Hair et al., 2022), as seen below in Table 7. Based on these results, the study can claim that the proposed model has adequate convergent validity, reliability, and discriminant validity.
Table 7 Correlation matrix and discriminant validity of the measurement model
| VA | MSQ | VSQ | |
|---|---|---|---|
| VA | 1.000 | ||
| MSQ | 0.164 | 0.850 | |
| VSQ | 0.075 | 0.233 | 0.830 |
Note: The values in diagonal (bold) are the square roots of the AVEs.
Source: Authors’ own elaboration.
In the next step, we tested the hypotheses using two simultaneous methods running the PLS bootstrapping process (non-parametric technique). On the one hand, we obtained the value of t-student (or t-value) in each path. This value defines the level of statistical significance of the relationships analyzed (Lowry and Gaskin, 2014)a form of structural equation modeling (SEM; its value must be greater than the limit of 1.96, corresponding to the two-tailed 95% confidence interval. On the other hand, the values of β and the p-value are obtained, which allows finding the correlation between the variables and thus being able to support or not the proposed hypotheses. The results when running the bootstrapping with 5,000 iterations are presented below in Table 8.
Table 8 Correlation analysis
| Ho | Evaluated Path | Standard Deviation | t-student | β | p-value | Link | Result |
|---|---|---|---|---|---|---|---|
| H1 | MSQ → VA | 0.078 | 1.9761 | 0.201 | 0.048* | Existent | Supported hypothesis |
| H2 | VSQ → VA | 0.085 | 0.465 | 0.039 | 0.642 | Non-existent | Unsupported hypothesis |
| H3 | MSQ → VSQ | 0.095 | 2.4431 | 0.233 | 0.015** | Existent | Supported hypothesis |
1t>1.96; * 0.025<p<0.05; ** p<0.025.
Source: Authors’ own elaboration.
Type t pseudo-statistics determined the β values. These values are significant if the t-values exceed the limit value of 1.96. The study observed that the relationship between MSQ and VA (H1) was supported. The same circumstance occurred when assessing the association between MSQ and VSQ (H3), showing that the higher the value of the trajectory coefficient, the lower the p-value. In the case of the second hypothesis, there was not enough statistical evidence to support the relationship between MSQ and VSQ (H2).
6. Discussion
This study sought to investigate the actual usefulness of a company’s mission and vision. Do they constitute guiding elements for obtaining organizational achievements, or are they just a matter of narrative? To this aim, the study’s purpose was to identify the existing links between the quality of a company’s mission and vision regarding its strategic capacity to appropriate value. In that order of ideas, the study claimed the definitions established over time by various authors on the topic associated with the strategic framework. We achieved this target by specifying the structure and content that both the mission and the vision must contain and that, according to the literature, could have a positive impact on the development and strategic fulfillment of a company (Alegre et al., 2018; Berbegal-Mirabent et al., 2021; Bowen, 2018; Brătianu and Bălănescu, 2008; López-Morales and Ortega-Ridaura, 2016). From the theoretical point of view, it was possible to identify several things. First of all, although the traditional literature focuses on documenting and listing the different characteristics and content elements of a quality mission and vision, there is still no certainty about the existence of an ideal composition that enables the generation of satisfactory results. The latter reality is especially true when those results mean to be oriented explicitly towards increasing the company’s competitive power. However, several works (primarily prescriptive) do accept the use of a detailed structure and a complete checklist to conceive the essence and design of the components mentioned above and assume them as a starting point to direct the company towards the creation of a sustainable competitive advantage (Fitzsimmons et al., 2022).
In any case, the literature analysis made it possible to identify those factors and variables that most frequently make up an adequate structure of the mission and vision statement. Out of them, it was possible to find both variables related to each other and contribute to achieving a quality declaration, as well as others that do not. An example of this latter phenomenon was the specific case of the stakeholder factor, which, according to the results obtained, revealed an insignificant contribution to the definition of MSQ. This fact is somewhat contradictory to what was stated by Bartkus et al. (2006) and, more recently, Berbegal-Mirabent et al. (2021), but that could be because a company can steer its stakeholders in the same direction without the need to mention them explicitly and individually in its statement. Under this premise, the extension of a mission could be short and easy to remember, making it more operational when communicated. Indeed, authors like Powers (2012) and, more recently, Ismail et al. (2016) suggest those mission statements that allow themselves to work out as a slogan or a short phrase are the best.
The main findings of the present empirical study validate the idea that controlling for the variables of industry, size, and track record, a company capable of constructing a high-quality mission, is, in general, also capable of directing efforts that generate better results in terms of value appropriation and thus improving its competitive position. A plausible explanation for this finding comes from the communicational logic of organizational signals. This insight suggests that successful companies are more likely to disclose information in the areas in which they excel and follow a transparency strategy to attract investors, improve their reputation and motivate their human resources (Berbegal-Mirabent et al., 2021). Therefore, the results suggest that those companies with a greater propensity to success tend to have better-conceived mission statements.
The results are in line with what was defended by authors such as Mittal and Srihari (2021), Yadav and Sehgal (2019), and proved by Sofijanova and Marjanova (2014), in the sense that a properly constructed mission can become a powerful tool in terms of not only formulating but also implementing strategies. However, regarding the link between the VSQ and the VA, this work could not find significant statistical evidence to validate that the adequate construction of a vision statement positively influences the capacity to appropriate a higher value. In some way, this last result differs from that of Gulati et al. (2016). They did find a statistically significant and positive association between vision statements and financial evaluations of the companies in their study sample.
The study also found that, although in moderate intensity, there is a direct and positive link between MSQ and VSQ. This insight suggests that when a company can adequately structure its mission statement, it defines its purpose and can project towards fulfilling its strategic or long-term objectives. In this way, the present study provides empirical evidence where the mission (or the MSQ, more precisely) is consolidated as a point of reference so that a company can adequately construct the declaration of its conception of the future. In other words, the mission would seem to be a powerful tool for formulating and implementing an adequate business strategy.
In the search for these relevant results and conclusions, two measurement instruments were also constructed that served as a tool to determine the quality of the narrative of the organizational mission and vision statements. Given that the study effectively verified both the reliability and validity, we consider that they constitute an additional contribution to the work and can irradiate the relevant literature on strategy and business activity.
From the methodological point of view, it is appropriate to point out that the present work correctly selected the data analysis technique. In line with Hair et al. (2022) , and Lowry and Gaskin (2014) In line with Hair et al. (2022), and Lowry and Gaskin (2014, the PLS-SEM is a widely used technique in investigative works of an exploratory nature, more specifically in the social sciences and particularly in the field of management and strategy. Its application adequately fulfilled this study’s objective, with the sample size analyzed. Through this, rapid identification of the possible relationships between variables was obtained, allowing the analysis of frequencies of distribution that were not necessarily normal behavior that the worked data exhibited. The measurement and conceptual models reported a good fit, indicating their usefulness and predictability.
One of the most obvious limitations of this article is that the empirical results are derived from a sample of companies with a specific geographical location. However, the nature of the companies analyzed, their representativeness considering the average business present in the geographical context, and their sample homogeneity provides a certain level of confidence regarding the accuracy of the results obtained. Consequently, we suggest that these results be contrasted with those from other regions and countries to refine further the conclusions displayed here. Likewise, it would be valid and interesting for future studies to focus on specific industries since particular perspectives of the concept of competitiveness revolve around the organizational capabilities that stand out in the different sectors. Either way, it is clear that the context matters.
On the other hand, we suggest implementing alternative methodologies to triangulate the results obtained here to have more certainty regarding the correlation between the variables. Likewise, we recommend considering incorporating various ideas that allow measuring the dependent variable as an approximation to competitiveness and thus be able to evaluate possible changes in the proposed relationships. This scheme could define the direct and indirect connections between the company’s capabilities to create a practical strategic framework and be a company that appropriates value.
Following the line of analyzing the impact of both the mission and the vision on a company’s financial results, the study proposes to put into perspective a more sophisticated analysis, where future studies can evaluate eventual associations between the independent variables with new dependent variables. These new variables can represent the company’s financial performance and be measured through financial indicators, such as the Return on Capital (ROE), the delta of net income or sales, or even the Economic Value Added (EVA). This novel perspective will make it possible, in turn, to interpret the results through a vertical and horizontal analysis. Finally, considering the hypotheses validation effects, we recommend evaluating other factors related to the strategic framework. These factors can measure the quality of their narrative structures and other context-related aspects. For example, they can measure the strategic framework disclosure that companies use to perform, the degree of appropriation that the collaborators have, and the level of implementation of what is declared there. These new studies can also appreciate how these components influence the organizational results of the company.
7. Conclusion
The fact of having adequately constructed mission and vision statements do not, in itself, represent any guarantee in the process of obtaining organizational achievements. However, neither can it be said that these elements are only decorative narratives (at least they should not be) with a specific utility depending on the moment’s circumstances. The present study vindicated the guiding and strategic sense of the mission and the vision, although it obtained different results. First of all, it was established that, at the firm level, the quality of a mission works as an antecedent of the quality of a vision and, at the same time, of the value appropriation capability. In contrast, the study could not prove the direct association between these last two variables, which prevented demonstrating that a good vision acts alone as a factor in a company’s competitiveness. In this sense, it would seem that those companies concerned with projecting their identity and purpose through a converging and inspiring element have a clear tendency to conceive their future more thoroughly and transparently and capture more significant levels of value throughout their operation.

