


 English (pdf)
 Article in xml format
 Article references
 Send this article by e-mail
 Cited by SciELO
  Cited by Google
  Similars in
SciELO
Similars in
SciELO  Similars in Google
 Permalink
1. Introduction
One of the main points that success-oriented organizations focus on is ensuring service quality and customer satisfaction. The quality of the service and customer satisfaction can usually develop because of the communication-based efforts of the employees in that organization with the service areas (customers). In this sense, it can be said that the satisfaction of the service members is largely directly related to the emotional representations shown by the employees (Chang and Chiu, 2009). It is expected of the employees to manage emotions “correctly” in the workplace and that emotional management is one of the most obvious characteristics of the business, that capital is expected to be compatible with the company’s goals and customer-oriented, and therefore there are costs of this such as stress, depression, etc. to the employees. According to Hochschild (1983) this cost is a direct result of the commoditization/commercialization of emotions. Today, EL is part of the package that companies sell to customers, so employees sell their “smiles” to the companies (Özkaplan, 2009, p. 19). In the service sector, the feelings of the employees are a labor force in order to create positive emotions in the customers. Nowadays, the consumer is interested not only in the physical aspects of the goods and services he buys, but also in the emotional/spiritual aspects as well. This has become more evident in the service sector. The presentation of the goods and services offered in the service sector is as important, if not more important, as the goods and services themselves. Therefore, employees who provide goods and services by interacting with the consumers can also play a key role in increasing their satisfaction by responding to the emotional demands of the consumers.
Today, it is increasingly difficult to keep the workers in organizations due to rapidly changing environmental conditions, increasing competition and ever-differentiating personal requirements. The training of a worker and his/her departure after adapting to the environment brings high costs to the organizations. In this respect, it is important to increase the OC of the employees and to determine the factors that will affect their commitment to the organization. The strong sense of commitment provided by the workers is expected as one of the key points in the success of the organizations. In this context, decision-makers must try increasing the commitment of the overworked employees to ensure the efficiency and quality of the work. Workers are also one of a precursor in determining the long-term competitive advantages in the success of enterprises. In other words, the workers have become valuable assets for the continuance of enterprises. Some researchers (Yang and Chang 2008) have suggested that EL, expressed as exhibiting the behaviors the enterprise wants during service delivery, is a precursor to OC, which expresses the level of adoption of the organization and belief in organizational objectives and values. In this context, the research aims to determine whether there is a significant relationship between these variables by examining the OC levels and EL of employees in the service sector and to examine the relationship between the sub-dimensions of variables. The research carried out; is important in terms of examining EL, which is critical for customer satisfaction and the continuance of the organization in the service sector, determining the possible impact of OC on EL and demonstrating the administrative behaviorsto be identified for the employees in the service sector.
2. Emotional Labor
According to Hochschild (1983), who brought up the concept of EL for the first time icomprehensively; the necessity of work is to arrange the emotions in such a way that they are observed by other people and to make facial and bodily representations accordingly. Hochschild has stated that EL is shown and observed as face-to-face and body expressions, while subsequent researchers (Wharton and Erickson, 1993; Rafaeli and Sutton, 1987, 1989) have noted that EL includes all kinds of efforts reflected in tone and behavior during his speech, in addition to this view. EL is when, in the workplace or during work, workers exhibit feelings that are expected of them, unlike their actual feelings (Deadrick and McAfee, 2001), to comply with organizational norms, and to respond to the expectations of appropriate emotional representation (Domagalski, 1999). Organizations transform emotions into economic value by guiding the feelings of their employees in a gain and expectation (Sohn and Lee, 2012). researchers have developed a various Approaches to better demonstrate the concept of EL and its sub-dimensions. Within the framework of these Approaches, Hochschild (1979, 1983) discussed the behavior of employees regarding their emotions in two dimensions: surface acting and deep acting. Ashforth and Humphrey (1993) added natural emotions (Genuine Acting) as a third dimension to Hochschild’s approach, thinking that there may be behavior that employees can actually feel in this process.
Surface Acting: It is a form of behavior put forward by Hochschild (1983) in which businesses expect to be shown in the service sector, which is usually customer-oriented, and that they have practiced by hiding the feelings that workers feel. Surface acting is a situation in which workers consciously alter the external expressions of the feelings they believe in (Scalise, 2007, p. 146). In surface acting, employees project their feelings to the customer oppositely by forging their feelings in a sense and differentiating them from the feelings that they really feel within the framework of the screening rules they want from them (Hochschild, 1983; Brotheridge and Grandey, 2002). This pattern of behaviour can be generated with silent and audible markings, facial expressions, hand and arm movements or tone of voice (Ashforth and Humphrey, 1993, p. 92).
Deep Acting: In deep acting, the worker strives to harmonize their true feelings with those expected of them (Grandey, 2003). Deep action means self-perceptiveness while adopting emotions at the subconscious level and being called by individuals and in harmony with the emotions expected by enterprises (Scalise, 2007, p. 146). Workers experience these feelings in person while striving to harmonize their true feelings with those expected (Beğenirbaş and Çalışkan, 2014, p. 111). Contrary to surface acting, deep action focuses on inner feelings, and individuals try to resort to the true feelings and feelings actually shown (Wang et al., 2016).
Genuine Acting: The genuine acting on natural emotions has been demonstrated by Ashforth and Humphrey (1993) in addition to Hochschild’s surface acting and deep acting. Genuine acting constitutes behaviors that are desired from employees in line with the objectives and enterprises (Dahling and Perez, 2010). When the code of conduct that businesses want and the feelings of the workers are in the same direction, the workers will not exhibit surface acting and deep acting and in this way, will be affected as little as possible by the negative consequences of EL. Genuine acting overlaps with natural emotions (Chu and Murrmann, 2006, p. 1182).
3. Organizational Commitment
OC is described as a structure with many components that define the employees’ feelings of commitment, identification and obligation to their organizations (Markovits et al., 2007, p. 79). OC is a case of workers seeing themselves on the same path as the institution and exhibiting common behaviors individuals adopt organizational goals and values and can fulfill responsibilities (Mohammed and Eleswed, 2013, p. 45), committing to help workers achieve the objectives and objectives of the organization, and includes the participation, identity and commitment levels of individuals (Caught vd., 2000). OC is defined as the combined strength of identity unity and commitment that a person enters with a particular organization (Leong et al., 1996). Schermerhorn et al. (1994, p. 144) express OC in the form of “the degree to which the person establishes a unity of force with the organization in which he or she works and feels part of the organization”. The OC model, widely used as a multidimensional structure, has been finalized as the “Three-Component OC Model” (Meyer and Allen, 1998). This model refers to three different forms of commitment, emotional, normative and continuance commitment.
Affective Commitment: Emotional commitment arises from a compromise between individual and organizational values that emotionally bind people to the organization and makes them happy to be a member of it (Wiener, 1982). Emotional commitment involves employees accepting organizational goals and values and making extraordinary efforts for the benefit of the organization (McGee and Ford, 1987). With such commitment, being a part of the organization gives the individual emotional pleasure and pride. These organizations mean a lot to their employees, both financially and spiritually. Therefore, emotional commitment is considered a strong type of commitment. Employees with such a commitment fully identify with the organization (Gangai and Agrawal, 2015, p. 270) fully identify with the organization (Gangai and Agrawal, 2015, p. 270).
Normative Commitment: In this type of commitment, we observed that the individual is connected to their organization because he or she feels obligated toward the organization. The basis of this type of commitment is out of necessity (Allen and Meyer 1990). Individuals remain in the organization as a result out of a sense of gratitude. This is because employers have value judgments that it is best to hire them at a time when they really need them or to stay with their employers. Such individuals believe that the organization has been good to them and therefore they owe it to the organization to work in the organization for a while (Bayram, 2005, p. 133).
Continuance Commitment: Continuance commitment is due to the desire to stay in this organization due to the personal investments made by the employee in the organization. These investments are close social relations with the colleagues, pension rights, seniority, career and special skills obtained from working in an organization for many years. Additionally, uncertainties about achieving better jobs elsewhere contribute to a continuance commitment (Obeng and Ugboro, 2003, p. 84). A person with a continuance commitment to an organization has the idea that he or she will have fewer possibilities if he leaves the organization. Some of these people may remain in the organization because they cannot find other work (Bayram, 2005, p. 133).
Since the fact that organizations consist mostly of highly committed workers has important consequences for both businesses and business people, it is important to determine how and how OC is established and to understand their relationship with behavior in business life (Buchanan, 1974, p. 533). In this context, it is suggested that the level of commitment to the organization affects the behavior (EL) exhibited toward customers in enterprises, and that OC is the premise of EL (Hsu, 2012; Yoğun, 2016; Kerse and Özdemir, 2018). The adoption of the organization of the workers, their belief in the objectives of the organization and the feeling that there is a psychological connection between the organization and them affects their internalization of the behavior exhibited toward the customers. Based on this approach, hypotheses H1a, H1b, H1c and H1d have been developed.
H 1a : There is a significant relationship between OC and EL.
H 1b : Emotional commitment increases as EL increases.
H 1c : EL increases as continuance commitment increases.
H 1d : EL increases as normative commitment increases.
It is believed that the emotional behavior of individuals exhibiting EL representation varies according to their gender. It can be said that women exhibit EL more than men (Kruml and Geddes, 2000; Özdemir et al., 2013). Women are more in most showing positive EL and men are more in the majority in showing negative EL (Erickson and Ritter, 2001; Kaya and Özhan, 2012). Some researchers (Cottingham et al., 2015; Cheung and Tang, 2010; Wharton and Erickson, 1993), noted that women are were more likely to participate in EL screening, but Simon and Nath (2004) concluded in their study that women did not exhibit more emotionally than men. The main reason for the EL difference between men and women is that women are relatively more successful and talented than men in jobs where EL should be displayed. While women can change their emotional representations in that direction by sensing extroverted emotional cues, men focus more on their introverted emotions and exhibit real emotional representations (Rafaeli, 1989).
Therefore, the behavior of men and women may differ in jobs that require EL. Based on this approach, hypothesis H1e has been proposed.
H 1e : EL varies significantly by gender.
There may also be a difference between the older and younger workers in showing EL. Studies in this field have shown that the older workers are more successful at controlling their emotions than the younger people (Dahling and Perez, 2010). Older workers have more life experiences, while having a positive effect on EL; young workers are often unwilling or unwilling to suppress their emotions, which can make it difficult for them to show EL (Lee, 2016, p. 1341). In their study, Dahling and Perez (2010) concluded that the older employees increased their motivation to increase their positive emotions by suppressing their negative moods in the display of EL at work. Accordingly, emotional control and regulation increase as age increases. Based on this approach, the hypothesis H1f has been created.
H 1f : EL varies significantly by age.
They spend more emotional effort because they are trained and equipped in professional matters and know how to behave toward their customers in matters related to their profession. Those who are not trained in their profession may have difficulties in dealing with customers, but they also have difficulty showing appropriate behavior. Accordingly, a high level of knowledge in the profession increases the knowledge of the worker toward his profession and positively affects his/her relations with the customer. Based on this approach, hypothesis H1g has been created.
H 1g : EL varies significantly according to educational status
Among the benefits of EL to the workers, financial gain is undoubtedly the first factor. Waiters who do not smile, doctors who do not show tips, sincerity and empathy are sick, and cold and rude lawyers lose clients. For paid employees, it refers to the additional income they will receive for a high performance rate they perform in their work. Therefore, it is stated that employees take care to show positive emotions (Wong and Wang, 2009). Based on this approach, hypothesis H1h has been created.
H 1h : EL varies significantly according to the monthly income level.
It is stated that long-term employees in jobs where it is necessary to serve people with various value judgments and expectations can gain significant emotional experiences, which can give them an advantage in regulating the feelings of employees (Dahling and Perez, 2010). Past work experiences are important in demonstrating the EL required by the work (Chu and Murmann, 2006, p. 1182; Hochschild, 1983, p.40). It appears that those who have worked in institutions for a long time are more successful in exhibiting EL (Kinman et al., 2011; Lee and Brotheridge, 2011). Based on this approach, hypothesis H1k has been created.
H1k: EL varies significantly according to work experience.
4. Research Methodology
4.1. The Population and Sample of the Research
The universe of research consists of private sector employees. The sample of the research consists of active workers working in private sector companies operating in Düzce/Türkiye. In the study, sampling and purposeful sampling methods have been used easily from unlikely sampling methods and data have been obtained from 462 private sector employees, but a sample volume of 443 people has been provided at an analysable level.Figure 1
4.2. The Data Collection Method of the Research
The data to be used in the study have been obtained by applying the face-to-face survey method. The survey used to obtain data consists of 2 scales in the 5-like structure, EL and OC. In the research, a scale of 3 dimensions and 19 substances developed by Chu and Murrmann (2006) and adapted to Turkish by Pala and Tepeci (2014) had been used to measure EL. For the purpose of measure organizational loyalty, a scale of 3 dimensions and 18 substances developed by Meyer et al. (1993) and adapted to Turkish by Wasti (1999) had been used.
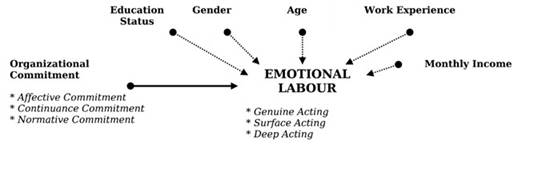
4.3. The Research Model
The main dependent variable of the research using the screening model is EL and sub-dependent variables are genuine acting, surface acting and deep acting. The main independent variable of the research is OC, while its sub-arguments are emotional commitment, continuance commitment and normative commitment.
4.4. Data Analysis of the Research
The data required to test the hypotheses proposed within the scope of the research were evaluated using SPSS 20.0 (Statistical Package for Social Sciences) and AMOS 24.0 (Analysis of Moment Structures) programs. Confirmatory Factor Analysis (CFA) had been used to determine the structural validity of the scales used in the study, reliability analysis in determining internal consistency, correlation analysis to determine the direction and severity of the relationship between variables, simple linear regression analysis to examine the relationship between variables and MANOVA (Multivariate ANOVA) analysis, Independent Sample T-Test and One-Way ANOVA Test had been used to determine differences.
5. Results
Descriptive statistics of the employees participating in the research are given in Table 1. According to this Table 1; 49.4% of the sample are male and 50.6% are female. When the age distribution is examined; the sample includes most of 77.6%, mostly in the 21-40 age range. It has been determined that 55.1% of the employees participating in the research are university graduates. When the monthly income level of private sector employees is examined; we observe that most of 55.5% have a monthly income at the minimum wage level. Considering the working time in the table, it has been determined that 90.1% of the sample has had more than 1 year of work experience.
Table 1 Descriptive Statistics
| Frequency | Percentage | |
|---|---|---|
| Gender | ||
| Male | 219 | 49,4 |
| Female | 224 | 50,6 |
| Age | ||
| Younger than 21 | 37 | 8,4 |
| 21-30 | 204 | 46,0 |
| 31-40 | 140 | 31,6 |
| 41-50 | 42 | 9,5 |
| 51-60 | 14 | 3,2 |
| Older than 60 | 6 | 1,4 |
| Education Status | ||
| Primary School | 47 | 10,6 |
| High School | 152 | 34,3 |
| Associate | 113 | 25,5 |
| Undergraduate | 115 | 26,0 |
| Post-Graduate | 16 | 3,6 |
| Monthly Income Level | ||
| Less than TRY* 1000 | 23 | 5,2 |
| Between TRY 1001 - 2000 | 246 | 55,5 |
| Between TRY 2001 - 3000 | 95 | 21,4 |
| Between TRY 3001 - 4000 | 37 | 8,4 |
| Between TRY 4001 - 5000 | 26 | 5,9 |
| TRY 5001 or more | 16 | 3,6 |
| Work Experience | ||
| Less than 1 year | 44 | 9,9 |
| 1-2 years | 77 | 17,4 |
| 2-3 years | 92 | 20,8 |
| 3-4 years | 39 | 8,8 |
| 4 years and above | 191 | 43,1 |
| * TRY= Turkish Liras | ||
Source: Authors’ own elaboration.
A Confirmatory Factor Analysis (DFA) has been applied to determine the structural validity of the scales used in the research, and the fit values obtained because of the factor analysis carried out for the OC scale consisting of 3 dimensions and 18 items are expressed in Table 2.
Table 2 OC Scale/Fit Values
| Fit Criteria | χ2 | P | χ 2/df | RMSEA | SRMR | NFI | CFI | GFI |
|---|---|---|---|---|---|---|---|---|
| Fit Values | 173.763 | 0.000 | 2.996 | 0.06 | 0.05 | 0.945 | 0.963 | 0.945 |
Source: Authors’ own elaboration.
When the fit values expressed in Table 2 are examined; it was been determined that the chi-square value is 173,763; the p value is 0.000; the RMSEA value is 0.06; the GFI value is 0.945; the chi-square/degree of freedom is 2,996; the SRMR value is 0.05; CFI value is 0.963 and the NFI value is 0.945. The standardized solution values for the OC scale tested in Figure 2 are specified.
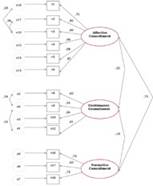
During the Confirmatory Factor Analysis, 5 items have been removed from the scale and the reliability analysis results for the dimensions of the revised OC scale are presented in Table 3.
Table 3 OC Scale - Reliability Analysis
| Cronbach’s Alpha | N of Items | |
|---|---|---|
| All Scale | 0.802 | 13 |
| Affective Commitment | 0.928 | 6 |
| Continuance Commitment | 0.790 | 4 |
| Normative Commitment | 0.723 | 3 |
Source: Authors’ own elaboration.
Because of the analyses carried out; it has been determined that the Cronbach’s Alpha coefficient is 0.928 for the emotional commitment dimension, 0.790 for the continuance commitment dimension and 0.723 for the normative commitment dimension. For the entire scale, the Cronbach’s Alpha coefficient is 0.802. According to these values obtained; it has been determined that all dimensions and scales have internal consistency.
Another scale used in the research is the EL scale. The fit values were obtained because of applying the Confirmatory Factor Analysis to this scale consisting of 3 dimensions and 19 items are expressed in Table 4.
Table 4 EL Scale / Fit Values
| Fit Criteria | χ2 | P | χ 2/df | RMSEA | SRMR | NFI | CFI | GFI |
|---|---|---|---|---|---|---|---|---|
| Fit Values | 147.802 | 0.008 | 2.206 | 0.08 | 0.06 | 0.882 | 0.907 | 0.914 |
Source: Authors’ own elaboration.
When the fit values in Table 4 are examined; it has been determined that the chi-square value is 147.802; the p value is 0.008; the RMSEA value is 0.08; the GFI value is 0.914; the chi-square/degree of freedom is 2.206; the SRMR value is 0.06; the CFI value is 0.907 and the NFI value is 0.882. The standardized solution values for the EL scale tested are specified in Figure 3.
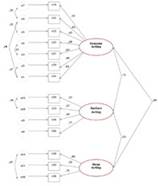
During the Confirmatory Factor Analysis, 5 items have been removed from the scale and the reliability analysis results for the dimensions of the revised EL scale have been stated in Table 5.
Table 5 EL Scale - Reliability Analysis
| Cronbach’s Alpha | N of Items | |
|---|---|---|
| All Scale | 0.879 | 14 |
| Genuine Acting | 0.841 | 7 |
| Surface Acting | 0.717 | 4 |
| Deep Acting | 0.756 | 3 |
Source: Authors’ own elaboration.
Because of the analyses carried out; the Cronbach’s Alpha coefficient is 0.879 for the genuine acting dimension, 0.717 for the surface acting dimension, 0.756 for the deep acting dimension and 0.879 for the entire scale. According to the values obtained, it was determined that all dimensions and scales have internal consistency. It has been determined that the proposed fit values of the OC scale expressed in Table 2 and the proposed fit values of the EL scale in Table 4 conform to with the goodness of fit statistics published by Schermelleh-Engel et al. (2003) and that the structural validity of these scales is acceptable.
The Kolmogorov-Smirnov and Shapiro-Wilk values were determined because of the normality test conducted for the data obtained within the scope of the research are presented in Table 6. When interpreted by considering the Shapiro-Wilk values due to the sample dimension (n=443), we observe that the data obtained from both of the scales and scale dimensions used in the research did not show a normal distribution. Therefore, the skewness and kurtosis values related to the relevant dimensions should also be examined.
Table 6 Normality Test Results
| Kolmogorov-Smirnov | Shapiro-Wilk | ||||||
|---|---|---|---|---|---|---|---|
| Statistics | df | Sig. | Statistics | df | Sig. | ||
| Organizational Commitment Scale | Entirety of Scale | 0.047 | 443 | 0.023 | 0.996 | 443 | 0.357 |
| Emotional Commitment | 0.132 | 443 | 0.000 | 0.941 | 443 | 0.000 | |
| Continuance Commitment | 0.066 | 443 | 0.000 | 0.984 | 443 | 0.000 | |
| Normative Commitment | 0.074 | 443 | 0.000 | 0.987 | 443 | 0.001 | |
| Emotional Labor Scale | Entirety of Scale | 0.067 | 443 | 0.000 | 0.978 | 443 | 0.000 |
| Genuine Acting | 0.115 | 443 | 0.000 | 0.942 | 443 | 0.000 | |
| Surface Acting | 0.143 | 443 | 0.000 | 0.957 | 443 | 0.000 | |
| Deep Acting | 0.092 | 443 | 0.000 | 0.979 | 443 | 0.000 | |
Source: Authors’ own elaboration.
The skewness and kurtosis values of the data obtained from the scales used in the study are detailed in Table 7. Upon reviewing this table; according to the Shapiro-Wilk value, the skewness and kurtosis values of the data sets that do not show a normal distribution are between -2 and +2, and according toGeorge’s classification and Mallery (2003), these data sets show a normal distribution.
Table 7 Normality Tests - Kurtosis and Skewness Values
| Skewness | Kurtosis | |
|---|---|---|
| OC Scale | 0.064 | -0.275 |
| Emotional Commitment | -0.448 | -0.838 |
| Continuance Commitment | -0.007 | -0.749 |
| Normative Commitment | 0.007 | -0.609 |
| EL Scale | -0.556 | 0.996 |
| Genuine Acting | -0.857 | 1.787 |
| Surface Acting | -0.597 | 0.372 |
| Deep Acting | -0.297 | -0.221 |
Source: Authors’ own elaboration.
Table 8 shows the results of the correlation analysis of the variables of the research. According to this table; a positive and moderately significant relationship was displayed between the main independent variable OC and the main dependent variable EL. It has been determined that there is a positive and moderately significant relationship between the independent sub-variables emotional commitment, normative commitment and EL. There is no statistically significant relationship between the continuance commitment and EL. A positive and low-level relationship has been found between the main dimension OC and the sub-dependent variables of genuine acting and surface acting, and a moderately significant and positive relationship between the other sub-dependent variables of deep acting and OC.
Table 8 Correlation Analysis Results
| OC Dimensions | ||||||
|---|---|---|---|---|---|---|
| OC | Emotional Commitment | Emotional Commitment | Normative Commitment | |||
| EL | Correlation | 0.422 | 0.461 | -0.067 | 0.432 | |
| Sig. (2-tailed) | 0.000 | 0.158* | 0.000 | |||
| EL Dimensions | Genuine Acting | Correlation | 0.374 | 0.448 | -0.116 | 0.381 |
| Sig. (2-tailed) | 0.000 | 0.000 | 0.058* | 0.000 | ||
| Surface Acting | Correlation | 0.253 | 0.213 | 0.058 | 0.241 | |
| Sig. (2-tailed) | 0.000 | 0.000 | 0.225* | 0.000 | ||
| Deep Acting | Correlation | 0.408 | 0.448 | -0.077 | 0.430 | |
| Sig. (2-tailed) | 0.000 | 0.000 | 0.107* | 0.000 | ||
| * p > 0.05 | ||||||
Source: Authors’ own elaboration.
Table 9 shows the ANOVA results of a simple linear regression analysis of the emotional commitment dimension of EL and OC. Because of a regression analysis is performed, it has been found that the regression model to be established expresses statistical significance.
Table 9 Emotional Commitment & Emotional Labor - ANOVA
| Emotional Labor | Sum of squares | Mean square | F | Sig. | |
|---|---|---|---|---|---|
| Regression | 9947.837 | 9947.837 | 119.335 | 0.000 | |
| Residual | 36762.023 | 83.361 | |||
| Total | 46709.860 | ||||
Source: Authors’ own elaboration.
The results of the analysis carried out using the Enter method are stated in Table 10. Upon examining this table; it has been determined that 21.1% of the change in the EL of the employees has been explained by the change in the emotional commitment dimension. The regression equation created according to these results is described as follows; “Emotional Labor = 50,413 + (0.693 x Emotional Commitment)”. According to the formula obtained because of the regression analysis; it has been determined that the 1-unit increase in the emotional commitment dimension caused an increase of 0.693 units on EL.
Table 10 Emotional Commitment & Emotional Labor - Model
| β | T | Sig. | r2 | Adjusted r2 | ||
|---|---|---|---|---|---|---|
| Emotional Labor | Constant | 50.413 | 36.596 | 0.000 | 0.213 | 0.211 |
| Emotional Commitment | 0.693 | 10.924 | 0.000 | |||
Source: Authors’ own elaboration.
The multivariate Analysis of Variance (MANOVA) was performed to determine whether there is a significant difference between emotional commitment and EL dimensions, and the results are provided in Table 11. Upon reviewing this table; the results of Pillai’s Trace and Wilks’ Lambda tests indicate that the significance value is less than 0.05 and that emotional commitment has a statistically significant effect on EL dimensions.
Table 11 MANOVA Analysis Results
| Effect | Value | F | Hypothesis df | Error df | Sig. | |
|---|---|---|---|---|---|---|
| Intercept | Pillai’s Trace | 0.974 | 5127.88 | 3.000 | 416.000 | 0.000 |
| Wilks’ Lambda | 0.026 | 5127.88 | 3.000 | 416.000 | 0.000 | |
| Hotelling’s Trace | 36.980 | 5127.88 | 3.000 | 416.000 | 0.000 | |
| Roy’s Largest Root | 36.980 | 5127.88 | 3.000 | 416.000 | 0.000 | |
| Emotional Commitment | Pillai’s Trace | 0.468 | 3.215 | 72.000 | 1254.000 | 0.000 |
| Wilks’ Lambda | 0.581 | 3.442 | 72.000 | 1244.071 | 0.000 | |
| Hotelling’s Trace | 0.640 | 3.685 | 72.000 | 1244.000 | 0.000 | |
| Roy’s Largest Root | 0.490 | 8.528 | 24.000 | 418.000 | 0.000 | |
Source: Authors’ own elaboration.
Because of the MANOVA test, the results are been presented in Table 12 by examining which of the dependent variables has a significant difference. When these results are examined, a significant difference is found in all dimensions of EL according to emotional commitment and it has been determined that emotional commitment has had the most effect on the genuine acting dimension and at least effect on surface acting.
Table 12 Tests of Between-Subjects Effects
| Source | Dependent Variable | Sum of squares | df | Mean square | F | Sig. |
|---|---|---|---|---|---|---|
| Corrected Model | Genuine Acting | 3121.295 | 24 | 130.054 | 7.794 | 0.000 |
| Surface Acting | 576.697 | 24 | 24.029 | 2.440 | 0.000 | |
| Deep Acting | 1979.762 | 24 | 82.490 | 5.686 | 0.000 | |
| Intercept | Genuine Acting | 219359.110 | 1 | 219359.11 | 13146.30 | 0.000 |
| Surface Acting | 63568.803 | 1 | 63568.803 | 6455.528 | 0.000 | |
| Deep Acting | 137668.454 | 1 | 137668.45 | 9489.659 | 0.000 | |
| Emotional Commitment | Genuine Acting | 3121.295 | 24 | 130.054 | 7.794 | 0.000 |
| Surface Acting | 576.697 | 24 | 24.029 | 2.440 | 0.000 | |
| Deep Acting | 1979.762 | 24 | 82.490 | 5.686 | 0.000 | |
| Error | Genuine Acting | 6974.746 | 418 | 16.686 | ||
| Surface Acting | 4116.125 | 418 | 9.847 | |||
| Deep Acting | 6064.013 | 418 | 14.507 |
Source: Authors’ own elaboration.
Table 13 shows the ANOVA results of a simple linear regression analysis of the normative commitment dimension of EL and OC. According to these results; Because of the p value is less than 0.05, it was determined that the regression model expressed statistical significance.
Table 13 Normative Commitment & Emotional Labor - ANOVA
| Sum of squares | Mean square | F | Sig. | ||
|---|---|---|---|---|---|
| Emotional Labor | Regression | 8709.813 | 8709.813 | 101.080 | 0.000 |
| Residual | 38000.047 | 86.168 | |||
| Total | 46709.860 | ||||
Source: Authors’ own elaboration.
The results of the analysis are carried out by the Enter method are stated in Table 14. Upon examining this table; it has been determined that 18.5% of the change in the EL of employees has been explained by the change in the level of normative commitment. According to these results, the value that the EL can receive is described as follows; “Emotional Labor = 46.085+ (0.959 x Normative Commitment)”. According to the formula obtained because of a regression analysis; it has been determined that the 1-unit increase in the normative commitment dimension caused an increase of 0.959 units in EL.
Table 14 Normative Commitment & Emotional Labor - Model
| β | t | Sig. | r2 | Adjusted r2 | ||
|---|---|---|---|---|---|---|
| Emotional Labor | Constant | 46.085 | 24.218 | 0.000 | 0.186 | 0.185 |
| Normative Commitment | 0.959 | 10.054 | 0.000 | |||
Source: Authors’ own elaboration.
The multivariate Analysis of Variance (MANOVA) was performed to determine whether there is a significant difference between the normative commitment and EL dimensions, and the results are provided in Table 15. Upon reviewing this table; the results of Pillai’s Trace and Wilks’ Lambda tests indicate that the significance value is less than 0.05 and that the normative commitment has a statistically significant effect on the EL dimensions.
Table 15 MANOVA Analysis Results
| Value | F | Hypothesis df | Error df | Sig. | ||
|---|---|---|---|---|---|---|
| Intercept | Pillai’s Trace | 0.943 | 2293.660 | 3.000 | 417.000 | 0.000 |
| Wilks’ Lambda | 0.057 | 2293.660 | 3.000 | 417.000 | 0.000 | |
| Hotelling’s Trace | 16.501 | 2293.660 | 3.000 | 417.000 | 0.000 | |
| Roy’s Largest Root | 16.501 | 2293.660 | 3.000 | 417.000 | 0.000 | |
| Normative Commitment | Pillai’s Trace | 0.427 | 3.022 | 69.000 | 1257.000 | 0.000 |
| Wilks’ Lambda | 0.613 | 3.216 | 69.000 | 1246.629 | 0.000 | |
| Hotelling’s Trace | 0.568 | 3.423 | 69.000 | 1247.000 | 0.000 | |
| Roy’s Largest Root | 0.438 | 7.973 | 23.000 | 419.000 | 0.000 | |
Source: Authors’ own elaboration.
Because of the MANOVA test, it has been tested which of the dependent variables has a significant difference and the results are presented in Table 16. When these results are examined, a significant difference is found in all dimensions of EL according to the emotional commitment and it has been determined that the emotional commitment has the most effect on the genuine acting dimension and the least effect on the surface acting.
Table 16 Tests of Between-Subjects Effects
| Source | Dependent Variable | Sum of squares | df | Mean square | F | Sig. |
|---|---|---|---|---|---|---|
| Corrected Model | Genuine Acting | 2503.375 | 23 | 108.842 | 6.006 | 0.000 |
| Surface Acting | 590.984 | 23 | 25.695 | 2.625 | 0.000 | |
| Deep Acting | 2169.935 | 23 | 94.345 | 6.730 | 0.000 | |
| Intercept | Genuine Acting | 103818.289 | 1 | 103818.28 | 5729.195 | 0.000 |
| Surface Acting | 28359.651 | 1 | 28359.651 | 2896.919 | 0.000 | |
| Deep Acting | 61395.537 | 1 | 61395.537 | 4379.543 | 0.000 | |
| Normative Commitment | Genuine Acting | 2503.375 | 23 | 108.842 | 6.006 | 0.000 |
| Surface Acting | 590.984 | 23 | 25.695 | 2.625 | 0.000 | |
| Deep Acting | 2169.935 | 23 | 94.345 | 6.730 | 0.000 | |
| Error | Genuine Acting | 7592.666 | 419 | 18.121 | ||
| Surface Acting | 4101.838 | 419 | 9.790 | |||
| Deep Acting | 5873.839 | 419 | 14.019 |
Source: Authors’ own elaboration.
When Table 17 is investigated, the relationship between EL and the gender of the employees who participated in the study. Upon reviewing this table; it has been determined that the significance value obtained because of the gender test has been greater than 0.05 and that the EL level of the employees did not differ significantly by gender.
Table 17 Gender - Emotional Labor
| Independent-Sample T | Levene’s Test for Equality of Variances | t-test for Equality of Means | |||||||
|---|---|---|---|---|---|---|---|---|---|
| F | Sig. | t | df | Sig. (2-tailed) | Mean Difference | Std. Error Difference | |||
| Gender | Mean | Equal variances assumed | 0.000 | 0.984 | -0.279 | 441 | 0.780 | -0.27328 | 0.97792 |
| Male | 64.5571 | ||||||||
| Female | 64.8304 | Equal variances not assumed | -0.279 | 440.2 | 0.780 | -0.27328 | 0.97812 | ||
Source: Authors’ own elaboration.
Table 18 shows the analyses of the relationship between EL and the age of the participants. Upon reviewing this table; because of the analysis, it has been determined that the significance value is less than 0.05 and that the level of EL varies significantly according to the age of the employees. However, a Post hoc analysis has been performed to determine which age group has the most significant differences.
Table 18 Emotional Labor - Age
| One-Way ANOVA | N | Mean | Std. Deviation | Std. Error | F | Sig. |
|---|---|---|---|---|---|---|
| Younger than 21 | 37 | 62.7297 | 10.78746 | 1.77345 | 3.466 | 0.004 |
| 21-30 | 204 | 63.0343 | 10.58970 | 0.74143 | ||
| 31-40 | 140 | 66.6214 | 9.12225 | 0.77097 | ||
| 41-50 | 42 | 67.8095 | 10.86780 | 1.67694 | ||
| 51-60 | 14 | 67.0000 | 8.40330 | 2.24588 | ||
| Older than 60 | 6 | 61.1667 | 11.37395 | 4.64339 |
Source: Authors’ own elaboration.
The homogeneity test results performed to determine the technique to be selected in the Post hoc analysis are stated in Table 19.
Table 19 Homogeneity Test of Variances
| Levene Statistic | df1 | df2 | Sig. |
|---|---|---|---|
| 0.705 | 5 | 437 | 0.620 |
Source: Authors’ own elaboration.
When the results in Table 19 are examined, we observe that the variances are homogeneous. However, considering that the distributions in the groups are not equal, the Scheffe test has been preferred in the Post hoc analysis. Upon reviewing it in detail; it was determined that the difference in EL by age is only significant between the age groups of 21-30 and 31-40, and that the EL is higher in the age group of 31-40 than among the employees between the ages of 21 and 30.
Table 20 analyzes the relationship between EL and educational status. Upon reviewing this table; we observe that the significance value is greater than 0.05. Accordingly, it has been determined that EL did not differ significantly according to the level of training of the employees.
Table 20 Emotional Labor - Education Status
| One-Way ANOVA | N | Mean | Std. Deviation | Std. Error | F | Sig. |
|---|---|---|---|---|---|---|
| High School | 47 | 67.0000 | 9.89290 | 1.44303 | 1.509 | 0.198 |
| Associate | 152 | 65.0197 | 10.69968 | 0.86786 | ||
| Undergraduate | 113 | 64.2212 | 8.37911 | 0.78824 | ||
| Post-Graduate | 115 | 63.3739 | 11.58073 | 1.07991 | ||
| Doctorate | 16 | 67.6875 | 8.69267 | 2.17317 |
Source: Authors’ own elaboration.
Table 21 displays the analyses of the relationship between the monthly income level and EL of the respondents. Upon reviewing this table; as a result of the analysis, it has been determined that the value of significance is less than 0.05 and that EL varies significantly according to the monthly income level of the employees. However, a Post-Hoc analysis has been performed to determine which income groups have differences.
Table 21 Emotional Labor - Monthly Income Level
| One-Way ANOVA | N | Mean | Std. Deviation | Std. Error | F | Sig. |
|---|---|---|---|---|---|---|
| Less than TRY 1000 | 23 | 61.8261 | 12.54683 | 2.61619 | 3.679 | 0.003 |
| Between TRY 1000 - 2000 | 246 | 63.6667 | 9.86659 | 0.62907 | ||
| Between TRY 2000 - 3000 | 95 | 64.5789 | 11.55890 | 1.18592 | ||
| Between TRY 3000 - 4000 | 37 | 67.9730 | 6.93015 | 1.13931 | ||
| Between TRY 4000 - 5000 | 26 | 69.7308 | 8.62349 | 1.69121 | ||
| TRY 5000 or more | 16 | 69.5625 | 9.52868 | 2.38217 |
Source: Authors’ own elaboration.
The homogeneity test results were obtained to determine the technique to be selected in the Post hoc analysis, which are presented in Table 22.
Table 22 Homogeneity Test of Variances
| Levene Statistic | df1 | df2 | Sig. |
|---|---|---|---|
| 2.611 | 5 | 437 | 0.024 |
Source: Authors’ own elaboration.
When the results in Table 22 are examined, we observe that the variances are not homogeneous. However, considering that the distributions in the groups have been not equal, The Tamhane’s T2 test has been preferred in the Post hoc analysis. Upon reviewing it in detail; it has been determined that the differences in the monthly income level of EL are significant between the employees with incomes of TRY 4001-5000 and those with incomes of less than TRY 1000 and TRY 1001-2000, and that EL is most significant among the employees with incomes of TRY 4001-5000 and those with monthly incomes of at least TRY 1000.
Table 23 is an analysis of the relationship between the duration of the study participants’ work experience and EL. Upon reviewing this table; because of the analysis, it has been determined that the value of significance is less than 0.05 and that EL varies significantly according to work experience. However, Post hoc analysis has been performed to determine which work experience periods there has been a significant difference.
Table 23 Emotional Labor - Work Experience
| One-Way ANOVA | N | Mean | Std. Deviation | Std. Error | F | Sig. |
|---|---|---|---|---|---|---|
| Less than 1 year | 44 | 63.3182 | 11.45420 | 1.72679 | 2.555 | 0.038 |
| 1-2 years | 77 | 62.9221 | 10.64099 | 1.21265 | ||
| 2-3 years | 92 | 63.2174 | 10.61600 | 1.10679 | ||
| 3-4 years | 39 | 65.0513 | 9.22796 | 1.47766 | ||
| 4 years and above | 191 | 66.3665 | 9.70793 | 0.70244 |
Source: Authors’ own elaboration.
The homogeneity test results were obtained to determine the technique to be selected in the Post hoc analysis are presented in Table 24.
When the results in Table 24 are reviewed, we observe that the variances are homogeneous. However, considering that the distributions in the groups are not equal, the Scheffe test has been preferred in the Post hoc analysis. Because of this test, the significance value was found to be greater than 0.05 among all groups. Therefore, it has been determined that the differences in the EL level according to work experience are not due to the groups but from within the group (between groups= 1064.8 & within groups= 45644.9).
6. Conclusions and Recommendations
According to the results of the research; a positive and moderately significant relationship between OC and EL has been found. There are studies supporting this situation in the relevant literature; the finding in Hsu’s research (2012) on store employees and Yogun’s (2016) research on nurses that OC positively and significantly affects EL explains this. While a positive and moderately significant relationship has been determined between emotional commitment, normative commitment and EL, there has been no statistically significant relationship determined between continuance commitment and EL. A positive and low-level relationship has been found between OC and the sub-dependent variables of genuine acting and surface acting, and a moderately significant and positive relationship between the other sub-dependent variables, deep acting and OC. According to the normative commitment, a significant difference has been detected in all dimensions of EL and it has been determined that the normative commitment has had the most effect on the genuine acting dimension and the least effect on surface acting. Based on the results, H 1a, H 1b, H 1d have been accepted and H 1c has been rejected.
It has been determined that the EL level of the employees does not differ significantly by gender. As a result, the H1e has been rejected. It has been determined that the level of EL varies significantly according to the age of the employees. It has been determined that the difference in EL by age is only significant between the age groups of 21-30 and 31-40, and that the EL is higher in the age group of 31-40 than among the employees between the ages of 21 and 30. Based on this result, H1f has been accepted. It has been determined that EL does not differ significantly according to the level of education of the employees. Based on these results, the H1g level was rejected. It has been determined that EL varies significantly according to the monthly income level of the employees. Upon reviewing the findings in detail; it has been determined that the differences in the monthly income level of EL are significant between employees with incomes of TRY 4001-5000 and those with incomes of less than TRY 1000 and TRY 1001-2000, and that EL is most significant among employees with incomes of TRY 4001-5000 and those with monthly incomes of at least TRY 1000. Accordingly, it is said that as income increases, EL increases. Based on this result, H1h is accepted and H1k is accepted as EL varies significantly according to work experience.
Recently, the number of research studies examining the role of emotions, EL and individual factors in work life has been increasing. It is observed that researchers such as Polatçı and Özyer (2015, p. 146) have conducted studies on emotional intelligence and events by taking the EL as an independent variable, Seçer (2005, p. 813) on feelings and, Beğenirbaş and Basım (2013, p. 45) on demographic factors and personality traits. There is no clear consensus on the research findings obtained from these studies. Villiers (2015, p. 101) has examined the relationships between EL, personality traits and commitment to work, and has found that there is a significant relationship between deep acting from the sub-dimensions of EL and commitment to work, and there had been no significant relationship between surface acting and a commitment to work. The study, conducted in Taiwan by Lin et al. (2015, p. 493), has revealed significant relationships between EL and a commitment to work. Mróz and Kaleta (2016, p. 776) have concluded that there is a slightly significant relationship between deep acting, which is the sub-dimension of EL, in the relationship between EL and commitment to work. In the Turkish literature, Türkay et al. (2011, p. 201) has found that the EL of the managers of the service enterprises has a significant relationship with a commitment to work. Gök (2015, p. 292) has found that EL affects work commitments of pharmaceutical representatives, and Gülova and Palamutçuoğlu (2013, p. 41) have concluded that EL in university employees has had a positive and statistically significant relationship between their commitments to work.
To create EL, enterprises should be able to properly manage the EL of employees by establishing a sense of OC within the organization and encouraging them to show EL. Future studies may examine whether the results of this study, which has been conducted in the service sector, are supported by using a different sample. Additionaly, new results can be produced by associating OC and EL variables with different variables.

