


 Inglés (pdf)
 Articulo en XML
 Referencias del artículo
 Enviar articulo por email
 Citado por SciELO
  Citado por Google
  Similares en
SciELO
Similares en
SciELO  Similares en Google
 Permalink
1. Introduction
Consumers cannot avoid brands because they provide a platform to explore their feelings when making choices. Initially, it was believed that consumers made decisions based on the features and advantages of the products, but this paradigm has started to be challenged. Instead, the union of scientific disciplines such as marketing and neuroscience has started to study the emotions elicited by the stimuli produced by brands (Kumar et al., 2021; González, 2022).
Through their narrative stories that highlight the emotional appeal, identity, and reach of the brand, advertisements serve as mediating components that can elicit emotional responses to strategies, strengthening the brand’s personality. The goal of advertising firms is to elicit favorable reactions that enable them to establish an emotional bond with their target audience (Mostafa and Kasamani, 2021; Haase et al., 2022).
From an initial focus on rational choice, where advertising exposure to individuals demonstrated that around two million TV, 316 print, 144 radio, and 45 magazine commercials per week, barely reaches a measly 0.2% recall among consumers, emotional reach has changed consumer behavior. This represents a progression in advertising exposure toward an apparently unreasonable method conceived under broad dimensions such as a person’s positive and negative affect (Kemp et al., 2020; Jímenez and Sánchez, 2023).
Emotional advertising is considered an effective communication for brand promotion because it seeks to generate positive sensations, capture attention, and generate an affective connection in consumers (García, 2019), through which they experience feelings and associations that come to life when they experience the deepest and most lasting connections (Khatoon and Rehman, 2021; Tiwari et al., 2021).
This represents a favorable environment for businesses who use social networks to elicit emotions from their target market. According to Hootsuite, Facebook receives 6% of the advertising budget in Latin American nations like Brazil, 5.3% in Mexico, and 5.1% in Colombia. According to these statistics, 44% of women and 56% of men are exposed to brand advertisements (Mejía, 2023).In a similar vein, sensory marketing tactics are used by 40% of the Fortune 500 ranking organizations, with the senses of sight accounting for 58% of these methods, smell for 45%, hearing for 41%, taste for 31%, and touch for 25%. This enables the exploration and growth of emotional impressions and long-term brand memory (Crist et al., 2018; Kuoa et al., 2020; Marcos et al., 2021).
It has become clear that brand loyalty rises by 28% when the sensory senses are positively engaged, by 43% when two or three sensory features support a brand, and by 58% when four or five senses are involved. This illustrates how a multisensory brand is created based on the experiences and increased value of the products from the perspective of consumers (Kumar et al., 2021). However, because consumers reveal their purchase decision in just 2.5 seconds and 98% of them express unconscious reactions in the brain, this foundation makes it necessary to identify sensory components and the representation of the brand as an attraction factor (Fernandez and Moreira, 2019; Trump and Newman, 2021).
Taking into account everything said above, it is crucial to investigate emotions as components that emerge from the stimuli that come from information sources and can cause consumers to have both positive and negative emotional reactions, some of which are under the advertiser’s control and others not (Kumar et al., 2021). Numerous studies have examined how emotion research contributes to a general understanding of consumer psychology in light of the fact that emotions are reactions that trigger internal or external stimuli that are processed by all the information perceived by the senses that generate an emotional connection in consumers (Crist et al., 2018; Mordoño, 2018; Tiwari et al., 2021).
1.1. Emotional soda brands and advertising
In an experiment that lasted about 59 seconds per participant where the visual stimulus was applied in the commercial advertisements of Coca Cola Life in Argentina, it was found that 41% of men displayed negative emotional peaks while 59% of women displayed the highest positive emotional peaks (Kumar et al., 2021), this indicated that men are selective processors, meaning they make simple decisions with minimal effort, but women are integral processors, meaning they understand information in a precise and meticulous manner (Mostafa and Kasamani, 2021). However, emotional intensity in both sexes reached 66% in happiness, 12% in wrath, and 8% in surprise and grief (Cedillo & Salguero, 2016; Becheur et al., 2017; Tinoco et al., 2019).
Happiness showed scenes where the participants felt involved and were associated with real-life events, whereas anger and sadness were associated with the facial expressions of protagonist of the commercial (Tinoco et al., 2019; Trump and Newman, 2021). In order to position itself in the consumer’s heart and mind, emotional responses were identified as 67% with the advertising interaction of childhood, family, and Christmas times. This allowed for the creation of moments of optimism and happiness (Ahn and Joon, 2018; Young et al., 2019; Kemp et al., 2020).
According to studies, soft drinks are actually consumed by the young population in Simón Bolvar University and Culiacán-Sinaloa in the proportion of 94% and 75%, respectively and they prefer the Coca-Cola brand (Fernandez and Moreira, 2019; Mostafa and Kasamani, 2021). Soft drinks are also regarded as a basic, traditional, and fundamental drink (Efrat and Asseraf, 2019). In contrast, athletic events only manage to capture 9% of consumers’ memories, compared to 60% for Pepsi Cola, whereas bear fashion events account for 67% and yoyo fashion events for 17% of Coca-Cola brand customers, respectively (Trump and Newman, 2021).
In a Coca Cola audiovisual ad, 94.4% revealed that musical, emotional and visual persuasions allow consumers to have emotions of joy; however, in the response associated with the product in the market, and from the perspective of the young people, color red symbolizes happiness and according to 60% of them, a combination with white color represents the Coca Cola brand (Tiwari et al., 2021). This shows that an emotional brand influences customer behavior before a purchase in a favorable way because consumers of soft drink brands seek for loyalty because they trust, recognize quality, and enjoy its benefits. This determines competitive success in the market (Young et al., 2019; Kumar et al., 2021).
1.2. Emotional cosmetic brands and advertising
In a study carried out by Desmet (2009), emotional results were raised when speaking, perceiving aromas, and socializing soap campaigns in 384 people (Cedillo and Salguero, 2016). In the study, 31% of the Dove brand was preferred in the first place, while 11% of the Lux brand was the second choice. This advertisement for women’s beauty featured a model with a familiar face, which allowed for the creation of emotions of trust, expectation, interest, joy, and satisfaction. On the other hand, if the advertisement features a model with an unfamiliar face, it reflects various emotional stimuli such as disgust, sadness, and surprise (Tinoco et al., 2019; Efrat and Asseraf, 2019).
However, the findings of a study on the emotional stimulus of consumer satisfaction allowed for the reduction of negative emotions and influenced how people perceived the environment, the quality of the product, and the advertising experience of feeling sexy and attractive (Mordoño, 2018; Kemp et al., 2020). In reality, according to research done by (Kwang et al., 2021; Mostafa and Kasamani, 2021), the effects of beauty advertising were successful and left 60% of women feeling more attracted to and attached to males than women did.
On the other hand, more significant emotional results were demonstrated in a study of the Dimensions of Brand Personality model by Jennifer Aaker (1997), which had five traits: sincerity, sophistication, competence, enthusiasm, and robustness, where 65% reached sincerity and 30% enthusiasm in beauty advertising campaigns (Young et al., 2019). Moreover, in an emotional brand, it was found that 79.6% of consumers are willing to pay a high price and commit to the brand (Ahn and Joon, 2018; Crist et al., 2018).
1.3. Emotional brands technology and advertising
In an advertisement for the Apple and Samsung brands that emphasized the product’s quality regardless of price, emotions like surprise and joy were produced by 20% and 14%, respectively. This allowed for the development of fanaticism for the brands and the establishment of trust (Young et al., 2019). With regard to brands that transmit values and goals surrounding the product, 31% of respondents polled specifically mentioned being admirers of the Apple brand as opposed to the Samsung brand (Fernandez and Moreira, 2019; Tiwari et al., 2021).
In a study where the Thomson et al. (2005) three factor model was presented, it was revealed that 25% of the respondents have a bond of affection for the Apple brand and 23% for Samsung; 20% have a passion for Apple, and 25% have a connection with Samsung; and 24% have a connection with Apple, and 21% have a connection with Samsung (Kumar et al., 2021). These findings allowed us to demonstrate how a consumer’s desire to make a purchase is influenced by their emotional connection to a brand (Kemp et al., 2020; Kuoa et al., 2020).These results are supplemented by the fact that the three emotional elements produced satisfactory psychometric indices between the two competing brands and that they create an emotional tie between the brand and the consumer, allowing for an increase in their market value (Efrat and Asseraf, 2019; Young et al., 2019; Mostafa and Kasamani, 2021).
Love for technological brands gives positive feelings of affection, dedication, devotion, and sympathy in order to enhance customer knowledge and comprehend their behavior (Fernandez and Moreira, 2019). According to Becheur et al., (2017) and Ahn and Joon (2018), determinants are emotions that are beneficial to someone or something. When customers experiment with a brand, they communicate their gratifying emotional character, which indicated the brand’s connection, popularity, and recognition (Tinoco et al., 2019).
1.4. Paul Ekman’s Basic Emotions
After exploring important findings, which set the tone of the literature, it is time to account for the basic emotions proposed by Paul Ekman who postulated six basic emotions: joy, sadness, anger, surprise, fear and disgust, these are projected on facial expressions and have triggered an interface of studies by various psychologists, which have made it possible to demonstrate different perspectives regarding the human being and their emotional perception of a brand (Young et al., 2019).
Within this framework, joy explores feelings of well-being, security, desire or illusion (Cedillo and Salguero, 2016), which encompasses a variety of feelings of satisfaction and euphoria. In addition, there is a difference between joy and happiness in its duration, the latter is considered a frequent and lasting stage of happiness, in which emotional expressions of the face are accompanied by a rise in the cheeks, and wrinkles appear in the eyes (Kumar et al., 2021). On the other hand, sadness projects pessimism, grief, loneliness, or the loss of something significant (Trump and Newman, 2021), someone could even reach a depressive state. Their facial expressions are presented by a lowering of the upper eyelids and lips, where there is less focus of the gaze with respect to their point of attention (Becheur et al., 2017; Efrat and Asseraf, 2019; Tiwari et al., 2021). Surprise infers astonishment and is momentary, it has a cognitive character of knowing what is happening (Mostafa and Kasamani, 2021), it is not considered a positive emotion, but neither is it a negative one, and it contains physiological components of joy or fear (Cedillo and Salguero, 2016; Kuoa et al., 2020). Their expressions are shown with the opening of the mouth and eyes with an elevation of the muscles in the eyebrows (Young et al., 2019). While disgust expresses rejection emotions that involve unpleasant elements, it is not different from anger and is usually the physiological form of the same emotion. His expression is considered to wrinkle his nose or upper lip something similar to anger (Kemp et al., 2020). In addition, due to its nature, when feelings of fear or surprise occur, eyebrows are usually raised (Mordoño, 2018; Kuoa et al., 2020).
Fear occurs in dangerous scenarios, this could be real or something that is imagined (Trump and Newman, 2021); however, it must be differentiated from anxiety because its foreseeable nature is usually more indeterminate (Crist et al., 2018), as heart rates and breathing increase, as well as muscle tension and sweating. Facial expressions can be determined in the elevation and tension of the eyebrows, upper eyelids and the retraction of the lips (Fernandez and Moreira, 2019). On the other hand, anger shows feelings of irritability, indignation, and anger that is related to the activation of the nervous system and the adrenaline it releases (Tinoco et al., 2019). In addition, it increases the heart and respiratory rate. Their facial expressions are shown when the eyebrows are drawn closer and lower, the lips are pursed, the gaze shines, and the gaze expression is evil (Kemp et al., 2020). In this context, the exploration of important findings that are presented below is marked.
In this way, the discoveries generated by the stimuli in emotions and their reach in the brain are revealed in emotional marks as elements of the utmost importance in decision-making (Tiwari et al., 2021). It is expected to generate a good reputation, create emotional benefits at the time of purchase or consumption of the brand. This internalization manages to generate a positive feeling that reflects a feeling of happiness or joy (Kumar et al., 2021). This orientation allowed us to establish the objective of the study, where we sought to analyze whether there is a difference in the basic emotions presented by the brands of soft drinks, cosmetics, and technology through the method of correlated proportions, when observing advertising. This reference approach marked the purpose to define the most significant components in the perception of emotional brands, and thus, the following research question was structured as a basis: What are the most significant emotions presented by brands of soft drinks, technology, cosmetics in advertising campaigns?
2. Methodology
The systematic review approach, which was proposed in four stages, was used to conduct the study: 1) Identification and selection of potentially relevant articles (Havranek et al., 2020); 2) Specification of the inclusion and exclusion criteria, where significant aspects like the methodology and study design are exposed (Balduzzi et al., 2019); 3) Analysis of the information (Escrig et al., 2020); 4) Interpretation of systematic and meta-analytic results (Balduzzi et al., 2019; Escrig et al., 2020).
2.1. Identification and selection of information
According to the Paul Ekman model, a narrative systematic review of factors including brand and fundamental emotions was conducted (Escrig et al., 2020). Key terms like emotional brand, neuromarketing, face coding, and body modification before a brand were employed in the information search. Careful analysis was done on the data where models of emotions and their effects on brands were identified. A thorough collection of materials, including regional, scientific articles, and theses, that were examined is summarized in (Table 1).
Table 1 Database Collected in Terms of Emotions and Brands
| Scientific Resources | Institutions | Acronym |
|---|---|---|
| Scielo | Universidad de Chile | Uchile |
| Dialnet | Universidad Pontifica Comillas | Comillas |
| Redalyc | Universidad de la Veras Cruz | UVC |
| Base | Universidad Autónoma de Barcelona | UAB |
| Google Scholar | Universidad Complutense Madrid | UCM |
| Research Gate | Universidad Europea | UE |
| Scopus | Vytautas Magnus University Institutional Research | VDU and Pub |
| Instituto Politécnico Loyola | IPL | |
| Universidad Autónoma de Sinaloa | UAS | |
| Universidad Autónoma de Occidente | Red UAO | |
| Universidad Católica Santiago de Guayaquil | UC |
Note: Information from the documentation in several scientific sources, including Scielo, Dialnet, Redalyc, Base, Google Scholar, Research Gate, and Scopus, was gathered for this study.
Source: Authors’ own elaboration.
2.2. Inclusion criteria exclusion of information
In this process, 45 documents were collected: Scielo 2, Dialnet 3, Redalyc 1, Base 8, Google Scholar 6, Research Gate 2, Scopus 7. In Thesis repositories: Uchile 1, Comillas 3, UVC 2, UAB 2, UCM 1, UE 2, VDU and Pub 1, IPL 1, UAS 1, UAO Network 1, UC 1; 2 duplicate studies were eliminated and 37 eligible studies were included. With this, selection criteria were applied such as: Type of method, dimension, indicators, type of study, findings of emotional expressions, basic emotions and brands. In the exclusion criteria, 13 study documents that do not contain criteria and specific characteristics of analysis were excluded. One qualitative study regarding the criteria of basic emotions was included, while 29 documents that meet the selection criteria for the development of the meta-analysis were included. The description of this process can be seen in (Figure 1) through a Quorum flowchart (Balduzzi et al., 2019).
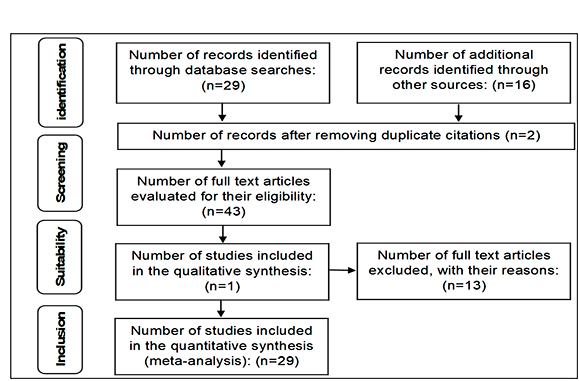
Note: Quorum Flowchart developed for the selection of information in the exclusion and inclusion criteria. Source: Authors’ own elaboration based on Balduzzi et al. (2019) .
Figure 1 Selection of information in the exclusion and inclusion criteria
2.3. Analysis of the information
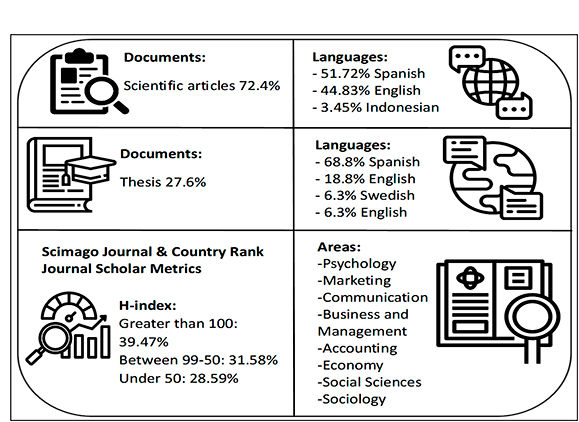
According to the studies explored, 72.4% were articles, 27.6% theses: 51.72% in Spanish, 44.83% in English, 3.45% in Indonesian. Moreover, for theses, 68.8% were in Spanish, 18.8% in Portuguese and 6.3% in Swedish and English. Regarding the studies that were included, 39.47% have an H index greater than 100, 31.58% between 99-50 and less than an H index of 50, 28.59% are in areas such as Psychology, Marketing, Communication, Business, Management and Accounting, Economics, Social Sciences and Sociology. (Figure 2) depicts the process of collecting the studies in detail.
2.4. Meta-analysis
This statistical technique, which enables both qualitative and quantitative analysis of reviews in the scientific literature on a particular research subject, forms the foundation of this methodological commitment to systematic review and meta-analysis (Havranek et al., 2020). Within this framework, five scenarios were presented: a) formulation of the problem or question, b) search for studies, c) coding of studies, d) statistical analysis and interpretation, and e) publication (Xing and Wang, 2021).
To demonstrate the technical richness of the study, in the formulation of the problem or question, the association between variables and their relationship was sought (Balduzzi et al., 2019; Xing and Wang, 2021), under the development of the PICO structure (Patient, Intervention, Comparison, Results/Outcomes) that allowed the formulation of a structured question and appropriate terms to respond based on the data obtained in the studies (Escrig et al., 2020). A number of 29 items were grouped according to basic emotions: joy, sadness, surprise, disgust, fear, and anger under the advertising perspectives of soft drink brands: Coca Cola and Pepsi Cola, cosmetic brands: Dove and Lux, technology brands: Samsung and Apple.
In this way, in the data collection process, authors, year of publication of articles and theses, and finally results of basic emotions, brands and participants were listed. The meta-analysis statistical analysis was then applied in the NCSS 12 Data Windows software, and the correlated proportions meta-analysis approach (Escrig et al., 2020) was used to aggregate the results of a group of separate research. outcomes with random effects sampling where it was believed that the size of the research is not equal and there is variability between existing investigations (Sutton et al., 2000 quoted by García, 2019). Therefore, the studies were based on their particular characteristics (Balduzzi et al., 2019; Havranek et al., 2020).
The application of equality effects testing (heterogeneity), which refers to parts that are distinct from one another but are yet a part of a set or group (Xing and Wang, 2021), equality effects tests (Heterogeneity) were used, which refer to components that are distinct from one another but are yet a part of a set or group (Xing and Wang, 2021). It was evaluated through the Cochran’s Q test:
Which showed the tests or statistical models and their distribution that does not fit the so-called criteria, under the parameters of the null hypothesis which infer that there were no differences between the groups and the alternative hypothesis which infer that there is a difference between the study groups (Escrig et al., 2020).
Therefore, the Odd Ratio was analyzed using the paired design from a randomly drawn sample and the following McNemar formulas and a Mantel-Haenszel estimator were used: . Additionally, the logarithm of possibilities was used for the distribution of smaller sample sizes. This was followed by the odds of the log risk ratio that was most closely approximated according to the distribution of smaller samples:
Sahai and Khurshid (1995) cited by Havranek et al., 2020), this allowed the development of the Forest Plot graph and the radial graph.
3. Results
The analysis is offered in this section within the framework of three sections: a) The most important fundamental emotions associated with the brands are compared using the equality test. b) Emotional qualities are distinguished using the forest plot diagram. c) The relationship between basic emotions and particular studies is examined using the radial graph.
Equality test to compare the most significant basic emotions of brands
In relation to the fundamental emotions of happiness, disgust, anger, fear, surprise, and sadness, brands such as MG (Soft brands), MC (Cosmetic Brands), and MT (Technology Brands) are shown in Table 2 with significance levels greater (>) or equal (=) 0.05 representing homogeneity and significance levels less (<) than 0.05 representing heterogeneity.
Table 2 Equality test for the most significant basic emotions of brands
| Emotions | Outcomes | Soft drinks (MG) | cosmetics (MC) | Technology (MT) | ||||||
|---|---|---|---|---|---|---|---|---|---|---|
| Cochran’s | DF | Prob Level | Cochran’s | DF | Prob Level | Cochran’s | DF | Prob Level | ||
| Happiness | Odds Ratio | 13.12 | 20 | 0.20 | 2.08 | 8 | 0.65 | 36.90 | 4 | 0.12 |
| Disgust | Odds Ratio | 0.00 | 0 | 0.00 | 0.00 | 0 | 0.00 | 0.00 | 0 | 0.00 |
| Anger | Odds Ratio | 9.63 | 3 | 0.02 | 0.00 | 0 | 0.00 | 0.00 | 0 | 0.00 |
| Fear | Odds Ratio | 0.00 | 0 | 0.00 | 0.00 | 0 | 0.00 | 0.00 | 0 | 0.00 |
| Surprise | Odds Ratio | 0.00 | 0 | 0.00 | 3.33 | 0 | 0.07 | 0.00 | 1 | 0.00 |
| Sadness | Odds Ratio | 3.83 | 2 | 0.15 | 4.17 | 1 | 0.12 | 1.24 | 2 | 0.27 |
| Combination | Odds Ratio | 29.57 | 30 | 0.08 | 10.88 | 11 | 0.37 | 42.89 | 10 | 0.03 |
Note: Equality test table for the basic emotions of joy, disgust, anger, fear, surprise, and sadness, with a significance level greater than or equal to 0.05 for homogeneity and a significance level less than 0.00 for heterogeneity in the MG (Soft drink brands), MC (Cosmetic Brands), and MT (Technology Brands).
Source: Authors’ own elaboration based on the correlated proportions meta-analysis approach.
In studies where brands of soft drinks (Coca Cola and Pepsi Cola), cosmetics (Dove and Lux), and technology brands (Apple and Samsung) were examined, there was evidence in the three groups of brands where the emotions were shown with the greatest significance: joy (MG: 0.20>0.05, MC: 0.65>0.05, and MT: 0.12>0.05), sadness (MG: 0.15>0.05; MC: 0.12>0.05, and MT: 0.27>0.05), and surprise.
However, the feelings of disgust, fear, and rage in the MG, MC, and MT had similar values of (0.00-0.05), (MG: 0.02-0.05), and (MC and MT: 0.00-0.05), which caused heterogeneity. Regarding the general combination in the three brand groups, the most significant value was (MC: 0.37>0.05), followed by (MG: 0.08>0.05) which are respective values with uniformity difference of (MT: 0.030.05) which reflects heterogeneity in basic emotions with respect to brands.
Forest Plot to distinguish the emotional attributes of each individual study.
In (Figure 3), the code for each study is presented in detail: The brands (MG: Soft drink Brands; MC: Cosmetic Brands; and MT: Technology Brands), as well as articles (AR) and theses (T), of the primary emotions (happiness, disgust, fear, surprise, and sadness) and sub-emotions identified in each research study are presented. There is a significance weight assigned to each study’s findings, and the results with higher values are more useful and there is a relationship between the two variables: brands and emotions. In general, it was observed that the joy emotion, in the three groups of brands: soft drinks, cosmetics and technology, maintained a significant weight, such as MG: -2.90 in the sub-emotion (happiness), MC: -2.85 in (satisfaction), MT: -2.63 in (affection) and MG: -2.58 in (fun and happiness), resulting in effective research studies and that there is a relationship between the two main variables brands and basic emotions.
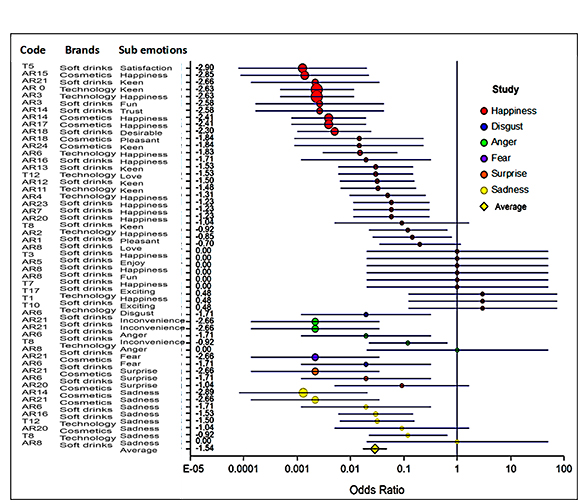
Note: Forest Plot graph results according to the code of each study, Article (AR) and Thesis (T), brands (MG: Soft Drink Brands; MC: Cosmetic Brands and TM: Technology Brands), basic emotions (joy, disgust, fear, surprise, and sadness) and sub-emotions found in each research study. Each study has a significance weight, and outcomes with greater values indicate more successful research and a connection between the two variables: brands and emotions. Source: Authors’ own elaboration.
Figure 3 Forest Plot to distinguish the emotional attributes of each study
Disgust, fear, surprise, and sadness each had a weight of (-1.71), while anger had a weight of (-2.66). On the other hand, anger was the most significant of the four significant sub-emotions of soft drinks. In the category of beauty brands, the sub-emotions of disgust, fear, surprise, sadness (-2.66), and in the category of technology brands, the sub-emotions of annoyance with a weight (-0.92), and sadness (-1.50), emerged as favorable reactions from the research study on brands and emotions. With regard to the overall findings, they demonstrated a weight of -1.54, indicating that the majority of the research have been successful and that there is a connection between the two variables, brands and fundamental emotions, in terms of advertising. It is essential to keep in mind that there is no association between brands and emotions. This is supported by the findings of three research on the emotion of pleasure, which found a non-significant weight in (MT and MG: 0.48) in the sub-emotions of excitement and happiness. Additionally, investigations using the codes T17, T10, and T1 yielded poor results. The most promising studies for future research have been outlined, and they are as follows: MC: AR15, AR21, AR14, AR18; MG: AR3, T7, AR8, AR5, AR6, AR 14, T12, T1; and MT: AR10, AR13, T8 according to the codes of each study.
List of individual studies according to basic emotions.(Figure 4) demonstrates the number of studies that are connected with one another by means of codes such as article (AR) and thesis (T), for the following MG brands: Brands of soft drinks; cosmetics brands; and technology brands. Confirmation that the findings of relevant studies and the Forest Plot graph are accurate. The research that have been provided are, for the most part, reliable, and there is a relationship between the two main variables, namely, brands and basic emotions. It was discovered that MC: AR15, AR14, and AR18; MG: AR3, T7, AR8, AR5, AR6, T12, and T1; and MT: AR10 and T8 received larger relevance inside the axis (y). On the other hand, investigations T10 and T17 were not included because their outcomes were unfavorable; more specifically, their data demonstrated values that were not typical for the research. According to the research that were conducted, it is important to note that negative feelings, such as anger, fear and sadness, as well as positive feelings, such as joy and surprise, play an important role in the face of brand advertising.
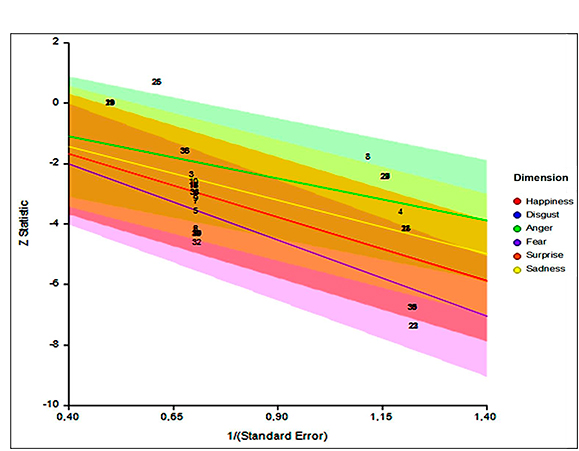
Note: Radial figure results according to the code of each study, Article (AR) and Thesis (T), of MG brands: soft drinks; MC: Cosmetic brands and MT: Technology brands. Verification of results of effective studies and Forest Plot graph. Source: Authors’ own elaboration
Figure 4 Relationship of studies according to basic emotions
4. Discussion
The results of this study identified the sub-emotions associated with advertising as well as the emotions that were most significant for the brands of technology, soft drinks, and cosmetics.
Happiness and sadness were the two main fundamental emotions that consumers displayed in front of the advertisement (Cedillo and Salguero, 2016). The activation of consumers’ feelings and emotions allowed them to recognize the products, the brand, and even the company (Kumar et al., 2021). Soft drinks brands that mostly featured happy scenarios in their advertising stood out (Trump and Newman, 2021). However, there is a chance that consumers will create situations of boredom in response to an advertisement that lacks emotional activation and may be misconstrued as representing sadness, fear, or disgust.
Women were shown as the primary target in commercials for cosmetics brands, and desire stimuli were associated with feeling and looking attractive. When discussing beauty, emphasis was placed on sensory and emotional stimuli that can vary and cause emotions like surprise, joy, or sadness (Cedillo and Salguero, 2016). Unlike technology brands that focused on product quality, regardless of price with advertising visual perception for consumers to identify and build trust, to the point of becoming fans of those brands emotionally interpreted with affection and passion (Tiwari et al., 2021).
In general, advertising revealed high emotional arousals as consumers felt involved in the scenes and in some issues, they associated it with real life events (Crist et al., 2018; Efrat and Asseraf, 2019). These emotions could be interpreted as: satisfaction, affection, passion, fun and happiness. In other cases, it could be deduced as: disgust, fear, surprise, sadness, and anger. Indeed, the advertisement of brands can cause positive and negative emotional activations that allow potential consumers to perceive the information and succeed or fail to persuade them to buy.
5. Conclusions
In short, emotional advertising works as a communication tool between brands and consumers, it generates feelings of joy such as: satisfaction, affection, passion, fun and happiness, it allows the consumer to identify with the product, brand and even with the company. That is, positive emotions allow the consumer not to doubt their preference and loyalty to the brand before the competition. On the other hand, if a brand creates advertising without a story or strategy that allows the consumer to perceive the advertising message clearly, it leads to boredom for the consumer and to be interpreted in the emotions of sadness, fear or disgust.
Companies are constantly looking for tools to create strong emotional connections with their consumers, with the aim of achieving greater attachment to the brand. This attachment is exposed when consumers remember the messages and manage to generate positive feelings.
Finally, an emotional brand with an advertising strategy manages to achieve an emotional connection of positive responses and feelings of emotional satisfaction, likewise, a close bond between the company and the consumer and the positioning of the brand in the consumer’s mind.

