


 Inglés (pdf)
 Articulo en XML
 Referencias del artículo
 Enviar articulo por email
 Citado por SciELO
  Citado por Google
  Similares en
SciELO
Similares en
SciELO  Similares en Google
 Permalink
1. Introduction
The present article is based on a research project carried out within the framework of interadministrative contract No. 2021-01819 of 2021, signed between the Faculty of Social and Human Sciences of the University of Antioquia (UdeA) through the Center for Opinion Studies (CEO), which is affiliated with the Department of Sociology, and the Mayor’s Office of Medellín - Medellín Valuation Fund (FONVALMED). The project was implemented in the second semester of 2021. The main objective of the study is to estimate the profitability that the development of urban projects in residential properties located in the study area or influenced by the Western Longitudinal (Circunvalar) Project can generate. These properties are likely to be affected by the Medellín valuation system, as outlined in Agreement 058 of 2008. To achieve this objective, a research group was formed, consisting of professionals in sociology, economics, finance, statistics, systems engineering, and social communication.
According to the Territorial Planning Plan (POT) of Medellín (2014), the territory has a series of projects and megaprojects supported by implementation processes in institutional and management systems. The research project focuses on the analysis of the Western Longitudinal Project, which encompasses eight districts: District 7 (Robledo), District 11 (Laureles), District 12 (La América), District 13 (San Javier), District 15 (Guayabal), District 16 (Belén), and Corregimiento 70 (Altavista), including a total of 85 neighborhoods/rural areas and 209,702 residential registrations. The main objective of this project is to serve as support for Avenida 80, which runs longitudinally through the western part of the Metropolitan Area of Valle de Aburrá. This road experiences high mobility demand in the Metropolitan Area, and its efficiency has continuously decreased, generating negative impacts on economic, social, and environmental aspects.
According to the Master Mobility Plan 2007-2020 (Metropolitan Area of Valle de Aburrá, 2007), the Western Longitudinal was conceived as a complementary road development in Valle de Aburrá, enabling connection with transverse road systems in the west, such as urban roads, bike lanes, Line B of the Metro, Metroplús, and Metrocables. The study “Western Multimodal Connectivity Project” (Fonvalmed, 2020) highlights how the current POT for the city, approved through Agreement 048 of 2014, considers the Western Longitudinal as a metropolitan, regional, and municipal territorial strategy (Article 10, numeral 2, literal C).
In order to fulfill the research purpose, a literature review exercise was conducted, along with an analysis of regulations and the utilization of various methodologies to calculate profitability. Additionally, a matrix was constructed as an instrument to gather primary and secondary information. Priority dimensions were defined, along with the variables associated with those dimensions, which underwent reasoned and informed discussions among the academics and technicians of FONVALMED.
In this regard, the research involved calculating profitability, both in percentage and monetary terms, taking into account the Consumer Price Index (CPI) to determine the annual average rental value. Additionally, the Real Estate Valuation Index (PVI), Residential Property Price Index (IPPR), and Fixed-Term Deposit Rate (DTF) were considered to determine the average selling price of the most representative strata and typologies in each municipality within the area of influence. The study also included searching for references of residential properties available for sale or rent, including houses and apartments. Sampling was conducted using the known finite population method, and a weighting factor was determined to extract the number of registrations per municipality and stratum for investigative purposes. The primary tool employed was photography, and market research was complemented by coordinated fieldwork conducted by the Faculty of Social Sciences and Humanities, collecting information from 344 residences. This data, along with a territorial perception exercise, enabled the determination of the property’s offering price and annual rental concept for each municipality and stratum. These findings were subsequently processed to facilitate the projection of profitability.
The importance of conducting this research lies in calculating the profitability generated by real estate assets characterized by their location, municipality, stratification, and construction typologies over a specific period of time. The aim is to find reference values and estimate the potential profitability that these real estate assets can generate for their owners based on rental income and future interest returns derived from the economic value of the property. This analysis is complemented by a qualitative, territorial, and contextual examination of the city of Medellín, which has gained international recognition in the last two decades due to its social, cultural, economic, and urban transformation.
Therefore, the University presents a methodological proposal that combines qualitative and quantitative research for profitability calculation. This proposal establishes a clear path for analyzing urban projects that have the potential to generate profitability. Additionally, it aims to develop a financing mechanism through valorization instruments. Conversely, the research also seeks to demonstrate opposing scenarios. Public administrations are invited to make informed decisions based on the dynamics of the city.
The main results will be presented in terms of methodological insights for calculating profitability, including: 1) rental profitability, 2) profitability based on the offering sale price, and 3) Return On Investment (ROI). Additionally, territorial aspects will be addressed. These results will be complemented by qualitative aspects that emerged during the data collection process. The article will include a dedicated section describing the methodology, with the objective of emphasizing the adopted methodological process. This represents the main contribution of academia to decision-making that benefits society as a whole.
2. Theoretical Framework
According to Law 75 of 2001, residential properties are buildings or complexes intended for housing individuals and are acquired as private co-ownership assets. Furthermore, properties are considered assets due to their capacity to generate income and value over a specific period. According to Ponce and Tubio (2013), “real estate constitutes the primary asset of households in many markets” (p. 2).
Regarding income, a residential property generates cash flows, usually through rental payments. According to Navarrete (2009), real estate is considered an asset that generates future rental income, either in the form of rents or accommodation services (p. 13).
On the other hand, the value of a property is defined as the sum of the present value of future cash flows that the asset can generate for its owner (Aznar, 2012, as cited in Castaño and Tamayo, 2014). This value generated over time can be determined by various characteristics, such as: (1) economic aspects (supply and demand, inflation, new real estate projects, geography), (2) social and cultural aspects (historical component), and (3) infrastructure aspects (size, shape, quality, age, location, accessibility), as mentioned by Scatigna et al. (2014).”
“Demographics, preferences, and buyer demand can influence the increase in housing prices in highly attractive locations, while properties in other areas may depreciate due to a lack of demand or a decrease in local economic activity” (p. 3).
Considering the income and value of properties, they are regarded as economic assets that generate profitability. According to Quintana et al. (2013), profitability refers to the capacity of an asset to generate profits or income, and it is used for analyzing and evaluating investment projects, as well as estimating capitalization values.
In essence, the value of a property is determined by considering its various characteristics and the rental income generated over time, which is reflected in its economic profitability (ROI - return on investment) or the future capitalization rate (typically measured as a percentage). According to Rojas (2008), “ROI is a performance measure used to evaluate the efficiency of an investment or compare the efficiency among different investments” (p. 30). Therefore, if an investment does not yield a positive ROI or if there are other opportunities with a higher ROI, the investment should be discarded.
When calculating ROI, it is crucial to consider the risks or operating costs associated with the investment, such as vacancies, maintenance, repairs, and market conditions that can impact the property value and, consequently, the profitability. In other words, to determine the potential of an investment to generate increased benefits in percentage terms, both the rental value or monthly rental income and the associated operating costs must be taken into account (Chile Propiedad, n.d.).
Therefore, the calculation of profitability is a relevant topic in the field of tax and urban law as it demonstrates that valorization and, consequently, profitability are sources of financing primarily in the territorial context for public works that generate urban development and benefits for real estate owners. In exchange for paying their contributions, they obtained these social and economic benefits, both in terms of their quality of life and the increased value of the real estate property” (Flórez G, 2020).
On the other hand, population growth, the increase in horizontal property, and migration of residents to certain urban areas due to economic, social, cultural, and infrastructural reasons have led to transformations in mobility and accessibility. According to Cuenya (2009), “urban projects are developed in a context marked by profound economic, social, political, and spatial transformations that major cities around the world have experienced since the latter part of the 20th century” (p. 232).
For this reason, urban projects aim to organize activities spatially, transform the environment, and change consumption patterns and lifestyles of the population. These projects have various impacts on the territory, such as modifying the profitability of land uses, functional and spatial changes in strategic central areas, and modifications in public management mechanisms” (Cuenya, 2011).
Furthermore, Cuenya (2011) points out that urban projects are characterized by their ability to generate extraordinary land valorization, both in the project site and the surrounding areas (p. 236-237). According to Agreement 058 of 2008, “Valorization Contribution is a real tax applied to real estate properties that benefit or are benefited by the execution of public interest works” (Fonvalmed, 2009, p. 6). In summary, valorization refers to the economic contribution made by individuals directly benefiting from a project to finance and construct it in a specific manner, which is reflected in an increased valuation of their real estate properties (Municipio de Medellín, 2021).
3. Methodology
The market research matrix for data collection, along with territorial analysis and perception, plays a fundamental role in calculating the profitability of constructing a property that will be affected by urban projects. The methodology section presents five stages: i) sample design, ii) market research, iii) territorial analysis and perception, iv) information collection and technological support, and v) profitability calculation.
Stage 1: Sample Design
The information used to construct the sampling framework is obtained from the number of residential registrations in the study area provided by FONVALMED for the year 2020. The sampling is conducted using the finite population or known method, where a significant global sample is extracted. Then, through a weighting factor, the sample is disaggregated by municipality and stratum, which facilitates market research without affecting the sample size.
This process takes into account that the proportion of rental properties in the city of Medellín is approximately 34%. In this regard, the values of P → Q are assumed, where P equals 0.34, which represents the variance value for the binomial distribution at that P value, and Q equals 1 - P = 0.66 (Thompson, 2012). A margin of error of 5% is obtained, considering the formula used to estimate this margin is:
Regarding the confidence interval for the proportion, which provides greater reliability by considering the value when obtaining the maximum result of the product p×q (Thompson, 2012), it is as follows:
Lastly, with the initial values, the formula to estimate the sample size for a known population is as follows:
By replacing the variables with their respective values in equation (3), the required sample size, without stratification, for the study of the longitudinal average, and knowing that the total population (N) is 209,702, is obtained as follows:
Once the size of the overall sample is determined, a weighting factor is applied to disaggregate this sample by stratum and municipality, while maintaining the significant sample representation from the area of influence (Table 1).
Table 1 Sample
| Stratum | Commune 7 (Robledo) | Commune 11 (Laureles) | Commune 12 (Ámerica) | Commune 13 (San Javier) | Commune 15 (Guayabal) | Commune 16 (Belén) | Village 70 (Altavista) |
|---|---|---|---|---|---|---|---|
| Stratum 1 | 6 | 0 | 0 | 19 | 0 | 1 | 0 |
| Stratum 2 | 18 | 0 | 1 | 22 | 4 | 12 | 3 |
| Stratum 3 | 19 | 0 | 13 | 17 | 11 | 37 | 0 |
| Stratum 4 | 10 | 14 | 25 | 5 | 4 | 29 | 1 |
| Stratum 5 | 3 | 31 | 15 | 0 | 0 | 23 | 0 |
| Stratum 6 | 0 | 1 | 0 | 0 | 0 | 0 | 0 |
| Total | 56 | 46 | 54 | 63 | 19 | 102 | 4 |
Source: Centro de Estudios de Opinión- UdeA, FONVALMED, 2021.
Stage 2: Market Research
This stage involves the actions of identifying, collecting, analyzing, and categorizing information. To carry out this stage, a territorial analysis is conducted to identify the specific characteristics of the municipalities, facilitating the classification of physical and functional typologies, as well as ensuring homogeneity in their surroundings (Table 2).
Table 2 Typologies
| Typology | Description | Type |
|---|---|---|
| Single-family house | Neighborhoods | House |
| Two-family house (with common areas) | Closed units | House |
| Three-family (with common areas) | Closed units | Apartment |
| Three-family (without common areas) | Open units or units in neighborhoods | Apartment |
| Multi-family house (with common areas) | Closed units | House |
| Multi-family (up to 5 flats with common areas) | Closed units | Apartment |
| Multi-family (up to 5 flats without common areas) | Open units or units in neighborhoods | Apartmen |
Source: Centro de Estudios de Opinión- UdeA, FONVALMED, 2021.
The methodology applied in this stage consists of conducting both direct and indirect market research on the real estate properties that are the subject of this study. Both fieldwork-collected information and data obtained from website searches are taken into account. Relevant variables for the analysis of residential properties for sale and rent are extracted, including offering price, area, typology, age, stratum, neighborhood, photographic records, and other property details.
Based on the sample design (Table 1), the information search considers each municipality within the area of influence, along with the most representative stratum and typology (Table 2). The researcher determines the typologies that are predominantly found in each municipality through territorial analysis. The objective is to extract variables from the search sources and calculate averages by stratum and typology according to the analyzed zone. The variables include average area (for sale and rent), average offering price (for sale and rent), average price per square meter (for sale and rent), and average rental income (monthly and annual). The handling of variables (Table 3) to construct the matrix instrument was done using Rstudio software, which allowed for processing and georeferencing of the information. An attempt is made to maintain the same typologies per stratum and municipality for both sale and rent, in order to maintain consistent criteria. However, in certain strata of some municipalities, the supply is limited, so additional typologies were added while keeping a similar average price per square meter to the base typology. We operate under the assumption of no vacancy, and a limitation of this study is that the publication date of the property is not available on some websites. Additionally, the results are subject to biases due to the quality of the data.
Table 3 Description of matrix variables
| Variable | Description |
|---|---|
| Study area | Analysis Commune |
| Neighborhood | Analysis neighborhood |
| Code | Property reference number or code |
| Address | Address of the property found |
| Typology | Classification of the property according to the number of apartments |
| Type | House or apartment |
| Age | Average age of construction of the building |
| Offer | Value of the property |
| Area | Area of the property |
| Value m2 | Value of the m2 of the property calculated as offer/área |
| ADM | Management value |
| PRED (year) | Value of property tax (annual) |
| Elevator | Whether or not it has an elevator |
| Gje | Number of garages or parking spaces in the property |
| Useful room | Whether or not it has useful room |
| Common areas | Whether or not it has common areas |
| Phone | Contact telephone number |
| Source | Page where the property was found |
| Published by | Real estate agency or individual listing the property |
| Date of publication | Month and year of publication of the property |
| Link | Web address of the property |
| Description | Property details |
Source: Centro de Estudios de Opinión- UdeA, FONVALMED, 2021
Stage 3: Territorial Analysis and Perception
Within the framework of qualitative analysis, the objective is to understand the essential characteristics of the territory in order to identify specific aspects that facilitate a better dynamic in market research. To achieve this, an analysis of the territory in question is conducted, considering its history, the perception of focus groups to gather information and opinions on the territorial analysis of the Western Longitudinal Axis, the POT, and tools such as Google Maps. The analysis encompasses different temporal and spatial scales, including biophysical, physical-spatial, and socio-economic dynamics (Franco, et al., 2009).
In this regard, Comuna 15 (Guayabal) is characterized by a predominantly flat topography, which has resulted in a greater presence of industries and retail businesses in the area. This municipality, located in the southwest and near the Medellín River, has primarily experienced industrial growth due to the convenient disposal of waste through the river. Additionally, its proximity to Olaya Herrera Airport fosters an active economic dynamic. In terms of the urban area, there are mainly single-family, two-family, and three-family housing typologies. However, there is observed urban growth towards the south, in the neighborhood of La Colina, with the construction of gated residential units.
Comuna 16 (Belén), located in the southwest of the city, features a topography with gentle to moderate slopes and is situated near Olaya Herrera Airport. This municipality combines residential uses with economic activities, with residential use predominating due to its geographical configuration and construction activities in the area. Various structures can be found, including single-family houses and buildings over 5 floors, both gated and open.
Comuna 11 (Laureles), located in the central-western zone, is characterized primarily by residential land use. It retains its architectural essence of single-family houses in some sectors. However, due to the city’s ongoing growth and the construction of horizontal properties, these single-family houses have been transformed into multi-family units. Additionally, in recent years, this area has witnessed an increase in the number of nighttime commercial establishments around the first and second parks, making it a dynamic area that combines residential and commercial aspects.
On the other hand, Comuna 12 (La América) is characterized by a residential land use combined with some basic activities and complementary services related to housing. It is located in the central-western zone of the metropolitan area and exhibits urban growth towards the mountains in the west of Medellín, where architectural typologies range from single-family houses to multi-family buildings in gated communities.
Comuna 7 (Robledo) is located in the northwest of the city of Medellín and is primarily characterized as residential, with a topography featuring medium to high slopes. This municipality is home to the university zone in the northern Valle de Aburrá, where higher education institutions are situated. The proximity to educational centers has partly driven the migration from two-family and three-family housing typologies to buildings over 5 floors in gated communities to meet the housing demand of students. However, due to this expansion and narrow roads, mobility issues arise, with high vehicular traffic during peak hours.
Comuna 13 (San Javier), situated in the central-western zone of the city, features steep slopes in its topography. Its land use is primarily residential, although some basic economic activities and small commercial corridors can be found. Mobility in this municipality is limited due to narrow roads, and public transportation coverage is scarce. However, the municipality has access to Metrocable Line J.
Corregimiento 70 (Altavista) is a rural area located in the southwest of Medellín. Due to its location, the land use is mainly oriented towards industrial activities. Additionally, it has an area designated as an expansion zone according to the POT, which is intended for residential use by socioeconomic strata 4, 5, and 6.
Stage 4: Information Collection and Technological Support
The process of collecting information through the matrix instrument was conducted virtually using market research, ensuring compliance with the sample by municipality, neighborhoods, and socioeconomic strata. The sampling was carried out randomly by blocks to guarantee randomness, complemented with a territorial perception and reading exercise as explained earlier.
For the application of the matrix instrument, an Android presentation was obtained using the LimeSurvey application designed for this purpose (Offline Survey). This application allows for automatic synchronization with the platform’s servers and, at the same time, saves the survey in the mobile device’s memory for subsequent submission if these functions are activated in the application. The platform has its own servers to store and record the collected information, requiring the activation of automatic synchronization. Additionally, real-time tracking of the number of completed surveys in a specific period and geographic area can be done through an internet or data connection. For this reason, each enumerator was provided with a cellphone provided by the CEO that had a data plan.
Once the information collection is completed, a spatial process is carried out to represent the georeferenced datasets using coordinates, blocks, neighborhoods, or municipalities. This information is stored in PostgreSQL using the PostGIS extension and accessed in R to build visualization models using SF (Simple Features), as well as in Python through GeoPandas.
Stage 5: Profitability Calculation
“Once the market study for residential properties is conducted, using the variables described in Table 3, a matrix is constructed to identify the average values per square meter for both sale and rent, as well as the income (rental income) per municipality, stratum, and the overall total. Additionally, an adjustment is made for the missing strata that were not considered in the sampling, in order to approximate the total for the area of influence later on. To make this adjustment, the average variation of the sale price per square meter by municipality and stratum is taken into account to determine the necessary average values and carry out the proposed methodologies. Three methodologies are used to project profitability: 1) rental profitability; 2) profitability based on the offering sale price, and 3) ROI.
The first methodology (rental profitability) is carried out using the static capitalization method (Equation 1), which aims to determine the profitability of a real estate property that generates rental income on a monthly, annual, etc., basis. It relies on the expected calculation of future income from the property, which is then brought to present value. The amount of income is related to time and the opportunity interest rate of capital. This methodology utilizes the incomes (rental value) from each municipality, stratum, and the overall total, and subtracts the expenses obtained from Table 4. Based on this result, which corresponds to net income, the projected increase in income is calculated using the CPI, and the variation or profitability is obtained. It is important to highlight that the total income result for projecting profitability is derived by summing the subtotals of annualized income per municipality and stratum.
Vf = Future value; Va = Present value; i = Capital opportunity rate; n = Number of years. Source: Fernández Navarrete (2017).
The second methodology (profitability based on the offering sale price) is carried out using the future value method, which calculates the value that an investment, specifically the offering sale price, will have in the future for a specific period of time and with an opportunity interest rate of capital. Three reference rates are used, provided in Table 4: PVI, IPPR, and DTF. This profitability analysis is based on the offering sale price per municipality, stratum, and the overall total. It is important to note that the total offering sale price is obtained by summing the subtotals of the sale offerings for each municipality.”
Tabla 4 IPC, PVI, IPPR, DTF
| Year | 2022 (%) |
|---|---|
| IPC | 3.62 |
| PVI | 4.49 |
| IPPR | 2.79 |
| DTF | 4.48 |
Source: Centro de Estudios de Opinión- UdeA, FONVALMED, 2021.
However, these two methodologies use the same formula but consider different current values. The first methodology utilizes the offering sale price, while the second methodology takes into account the income (rental income).
Furthermore, two variations or multiplications based on market research are applied in these methodologies: 1) the average offering price and the average income obtained from the market research are multiplied by the number of property registrations (Table 5, m2) for each stratum and municipality. This calculation yields the total offering value and annual income, respectively. 2) The average price per square meter for sale and rent is multiplied by the number of square meters of constructed private area (Table 5, registrations) for each stratum and municipality. This multiplication results in the total offering value and annual income, respectively.
Table 5 Registration and m2
| Stratum | Commune 7 (Robledo) | Commune 11 (Laureles) | Commune 12 (América) | Commune 13 (San Javier) | Commune 15 (Guayabal) | Commune 16 (Belén) | Village 70 (Altavista) | |||||||
|---|---|---|---|---|---|---|---|---|---|---|---|---|---|---|
| Registration | M2 | Registration | M2 | Registration | M2 | Registration | M2 | Registration | M2 | Registration | M2 | Registration | M2 | |
| Stratum 1 | 3436 | 205194,3 | 0 | 0,0 | 66 | 3839,5 | 11432 | 802088,2 | 16 | 682,0 | 658 | 54972,3 | 132 | 2505,0 |
| Stratum 2 | 10718 | 927614,2 | 3 | 110,0 | 357 | 37041,8 | 13237 | 1182315,9 | 2174 | 202189,5 | 7116 | 692686,9 | 1887 | 153272,5 |
| Stratum 3 | 11481 | 808674,9 | 17 | 2669,0 | 8084 | 728669,3 | 10255 | 960361,6 | 6917 | 725994,1 | 22809 | 2081915,7 | 183 | 31331,2 |
| Stratum 4 | 5946 | 463221,4 | 8732 | 883620,7 | 15248 | 1464051,8 | 3299 | 280965,8 | 2407 | 283103,0 | 17653 | 1625715,4 | 668 | 43154,0 |
| Stratum 5 | 1868 | 162461,5 | 18650 | 2594352,5 | 9428 | 1108482,7 | 24 | 1699,2 | 3 | 342,7 | 13788 | 1555704,1 | 2 | 636,0 |
| Stratum 6 | 0 | 0,0 | 762 | 99263,7 | 129 | 8525,1 | 0 | 0,0 | 0 | 0,0 | 117 | 9892,4 | 0 | 0,0 |
| Total | 33449 | 2567166,4 | 28164 | 3580015,9 | 33312 | 3350610,2 | 38247 | 3227430,7 | 11517 | 1212311,3 | 62141 | 6020886,7 | 2872 | 230898,7 |
Source: Centro de Estudios de Opinión- UdeA, FONVALMED, 2021.
The third methodology, Return on Investment (ROI) Equation 2), indicates the relationship between the net income generated by the monthly rental of a property, subtracting the associated expenses (such as taxes), and the purchase value of the property. All these calculations are done on an annual basis (Chile Propiedades, s.f.). Starting with the annual income, annual expenses, and offering sale price, the expenses are subtracted from the income (Table 6), and the net annual income is projected using the CPI (3.62%). The offering sale price is also projected using the CPI. Once both values are projected, the formula presented in Equation 2 is applied.
Source: Chile Propiedades. (s.f.).
For the first and third methodologies (rental profitability and ROI), expenses (Table 6) are taken into account, which are calculated using property taxes (1.5% of the cadastral value of the property), maintenance (5% of the annual income or rentals), and real estate commission (10% of the annual income or rentals). These expenses are subtracted from the reported income (rentals) by municipality and stratum.
Table 6 Expenditure
| Variant | |||
|---|---|---|---|
| Commune | Stratum | Mult. Registration | Mult. m2 |
| Commune 7 | 1 | $ 7.241.372.051 | $ 7.826.931.101 |
| 2 | $ 28.483.087.144 | $ 39.254.719.129 | |
| 3 | $ 36.970.031.762 | $ 42.703.941.029 | |
| 4 | $ 29.577.187.800 | $ 27.247.474.641 | |
| 5 | $ 11.151.958.885 | $ 12.325.223.399 | |
| Commune 11 | 2 | $ 14.183.381 | $ 7.159.998 |
| 3 | $ 78.520.425 | $ 166.205.025 | |
| 4 | $ 53.815.939.714 | $ 74.976.437.626 | |
| 5 | $ 195.241.603.935 | $ 248.384.880.079 | |
| 6 | $ 10.218.420.000 | $ 11.849.652.875 | |
| Commune 12 | 1 | $ 239.749.996 | $ 147.111.792 |
| 2 | $ 1.477.980.000 | $ 1.619.255.491 | |
| 3 | $ 37.620.451.957 | $ 42.568.390.096 | |
| 4 | $ 77.821.522.560 | $ 92.977.874.572 | |
| 5 | $ 73.312.122.315 | $ 70.326.822.426 | |
| 6 | $ 1.126.050.616 | $ 607.161.502 | |
| Commune 13 | 1 | $ 33.741.852.091 | $ 35.988.370.559 |
| 2 | $ 42.465.501.573 | $ 55.463.700.475 | |
| 3 | $ 40.373.086.122 | $ 60.827.848.005 | |
| 4 | $ 15.851.876.907 | $ 19.274.883.703 | |
| 5 | $ 136.072.938 | $ 137.547.734 | |
| Commune 15 | 1 | $ 36.928.838 | $ 29.478.891 |
| 2 | $ 5.434.456.500 | $ 9.464.757.422 | |
| 3 | $ 29.451.328.364 | $ 40.944.484.517 | |
| 4 | $ 12.234.179.250 | $ 18.591.799.312 | |
| 5 | $ 16.417.588 | $ 24.231.035 | |
| Commune 16 | 1 | $ 1.415.358.000 | $ 1.622.568.398 |
| 2 | $ 23.002.470.000 | $ 29.903.192.895 | |
| 3 | $ 110.162.524.373 | $ 110.457.895.262 | |
| 4 | $ 95.331.678.517 | $ 116.201.442.032 | |
| 5 | $ 97.660.404.000 | $ 123.092.808.512 | |
| 6 | $ 1.133.952.776 | $ 1.071.020.768 | |
| Village 70 | 1 | $ 178.197.699 | $ 47.734.395 |
| 2 | $ 4.421.241.000 | $ 5.303.047.260 | |
| 3 | $ 595.116.068 | $ 1.634.596.793 | |
| 4 | $ 2.615.220.000 | $ 3.009.808.644 | |
| 5 | $ 11.148.535 | $ 64.285.821 | |
| Grand Total | $ 1.080.672.438.193 | $ 1.306.176.890.897 | |
Source: Centro de Estudios de Opinión- UdeA, FONVALMED, 2021.
4. Results
This section presents the results obtained during the market research and profitability calculation, and it is structured into four aspects: i) market research results, ii) rental profitability, iii) profitability based on the offering sale price, and iv) ROI.
a. Market research results
The data collected in the research reveals, both by municipality and stratum, the average price per square meter for sale, the average sale price of a property, the average price per square meter for rent, and the average monthly rental income.
In the following set of graphs, summarized statistics are presented to describe the behavior of properties in the real estate market within the influence area of the Western Longitudinal project. A robust statistic is used, which is less sensitive to outliers, allowing for the identification of the central tendency of values and the distributional behavior.
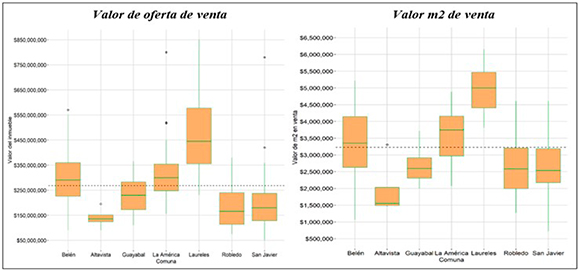
Graph 1 displays the properties for sale in the project’s influence area. The black dashed line represents the overall median prices of the properties. In the case of Graph 4 (offering sale price, located on the left), it is COP 268,000,000. The highest values are found in Laureles, where 50% of the properties range between COP 350,000,000 and COP 570,000,000. Some properties in La América and San Javier have prices between COP 750,000,000 and COP 800,000,000, characterized by a large area in square meters. In Robledo and San Javier, prices generally fluctuate between COP 130,000,000 and COP 240,000,000. In La América, 50% of the properties range between COP 250,000,000 and COP 350,000,000. Altavista has the lowest median value, below COP 150,000,000, and there is not a large dispersion observed among the property prices.
Source: Centro de Estudios de Opinión- UdeA, FONVALMED, 2021.
Graph 1 Box and whisker plot of sale prices (offering price and price per square meter) of properties by municipality in the area of interest
Highlighting these differences in offering values and showcasing notable price movements, the variations in the value per square meter (m2) by municipality and stratum are crucial. In fact, the median value of m2 is observed to be COP 3,228,507 (represented by the black dashed line in Graph 2, located on the right side), with values of COP 3,741,000 and COP 5,000,000 for La América and Belén, respectively. In Laureles, 50% of the investigated properties have an m2 value ranging between COP 4,000,000 and COP 5,450,000. This dispersion is wider for 50% of the registered properties in La América and Belén. On the other hand, the differences in the median value of m2 in Guayabal, Robledo, and San Javier are minimal, approximately around COP 2,500,000.
Source: Centro de Estudios de Opinión- UdeA, FONVALMED, 2021.
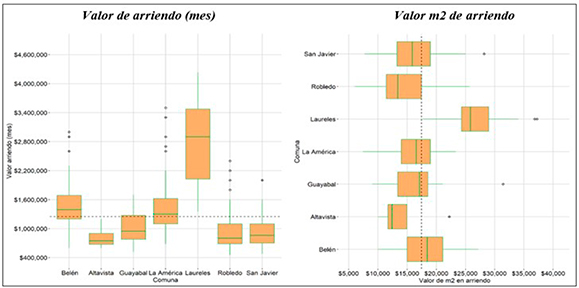
Graph 2 Box and whisker plot of rental prices (monthly value and price per square meter) of properties by municipality in the area of interest
Graph 2 provides details on rental values (monthly income and value per m2). The monthly rental value refers to the gross cash flow generated by a property. Overall, the median value of monthly rental is COP 1,250,000 (located on the left side of Graph 2). Laureles has the highest median value (COP 2,900,000), while Altavista has the lowest (COP 750,000). In Laureles, the highest dispersion in monthly rental value is observed, where 50% of the properties range between COP 2,025,000 and COP 3,475,000. Conversely, Altavista exhibits the lowest dispersion in that value, with a range of 50% of the investigated properties between COP 675,000 and COP 900,000. Robledo and San Javier show a fairly similar dispersion in 50% of the records, ranging between COP 680,000 and COP 1,100,000.
The behavior of the average rental price per square meter (m2) by stratum (Graph 2, located on the right side) for La América shows that the highest m2 value is found in stratum 4 (COP 17,294), followed by stratum 5 (COP 15,056) and stratum 6 (COP 16,900). This can be attributed to the consolidation of the environmental, cultural, and economic dynamics in which the properties in stratum 4 are located, offering a higher value compared to stratum 5 and 6. As for stratum 1, the lowest average is found in Altavista (COP 6,390), while the highest average is in San Javier (COP 14,573). However, despite Altavista having the lowest average m2 value in stratum 1, stratum 5 exhibits the highest average value overall, reaching COP 32,205. In contrast, in La América, stratum 5 shows a decrease in price, with an average of COP 15,056. In the municipalities of San Javier, Robledo, and Guayabal, there is not a significant difference in the average m2 values by stratum, ranging between COP 12,000 and COP 24,000.
b. Rental profitability
Using the Consumer Price Index (3.62%) to project the one-year profitability using the static capitalization method, a profitability of $2,654,145,296,563 (4.47%) is obtained by multiplying it by the number of property registrations, and a profitability of $3,352,463,608,499 (4.83%) is obtained by multiplying it by the constructed area of private areas in square meters. These results are presented in Table 7
Table 7 Rental Profitability with Consumer Price Index (CPI)
| Territory | Rent. X Yield IPC | ||||
|---|---|---|---|---|---|
| Rent. Mult. Registration | Rent. Mult. M2 | ||||
| Commune | Stratum | Rent. $ | Rent. (%) | Rent. $ | Rent. (%) |
| Commune 7 | 1 | 20.124.186.514 | 5,59 | 20.115.727.073 | 4,84 |
| 2 | 68.622.745.221 | 4,33 | 102.091.623.474 | 4,94 | |
| 3 | 92.274.820.926 | 4,60 | 04.826.706.804 | 4,47 | |
| 4 | 70.639.859.257 | 4,26 | 9.755.925.100 | 4,81 | |
| 5 | 28.703.989.957 | 4,85 | 32.617.051.108 | 5,10 | |
| Commune 11 | 2 | 35.481.632 | 4,62 | 17.529.704 | 4,45 |
| 3 | 243.285.674 | 4,89 | 518.933.581 | 4,75 | |
| 4 | 134.627.800.375 | 4,62 | 183.563.564.371 | 4,45 | |
| 5 | 529.912.056.407 | 5,34 | 643.968.952.061 | 4,92 | |
| 6 | 22.573.217.847 | 3,75 | 33.193.560.167 | 5,67 | |
| Commune 12 | 1 | 543.639.258 | 3,91 | 266.450.364 | 2,77 |
| 2 | 3.351.357.516 | 3,91 | 2.927.922.352 | 2,77 | |
| 3 | 78.544.944.791 | 3,43 | 108.964.070.166 | 4,81 | |
| 4 | 185.399.466.669 | 4,24 | 218.477.092.980 | 4,15 | |
| 5 | 201.785.554.925 | 5,49 | 134.643.005.806 | 3,01 | |
| 6 | 3.099.361.214 | 5,49 | 1.162.430.589 | 3,01 | |
| Commune 13 | 1 | 82.269.462.453 | 4,41 | 108.047.659.793 | 6,51 |
| 2 | 99.040.155.960 | 4,10 | 146.150.966.310 | 5,06 | |
| 3 | 82.691.140.531 | 3,33 | 173.786.725.998 | 5,89 | |
| 4 | 34.849.098.094 | 3,72 | 54.006.330.057 | 5,67 | |
| 5 | 299.145.596 | 3,72 | 385.395.234 | 5,67 | |
| Commune 15 | 1 | 82.049.975 | 3,78 | 78.723.091 | 5,19 |
| 2 | 12.074.493.759 | 3,78 | 25.275.542.420 | 5,19 | |
| 3 | 74.800.836.853 | 4,74 | 120.100.516.846 | 6,21 | |
| 4 | 25.631.696.824 | 3,45 | 60.021.182.590 | 7,59 | |
| 5 | 34.396.312 | 3,45 | 78.226.716 | 7,59 | |
| Commune 16 | 1 | 3.442.354.640 | 4,40 | 5.153.937.300 | 7,33 |
| 2 | 68.110.604.841 | 6,32 | 98.899.583.975 | 8,02 | |
| 3 | 272.824.385.949 | 4,54 | 277.746.780.771 | 4,66 | |
| 4 | 217.369.801.943 | 3,95 | 289.110.021.464 | 4,57 | |
| 5 | 216.490.676.341 | 3,77 | 303.251.727.819 | 4,49 | |
| 6 | 2.513.712.757 | 3,77 | 2.638.569.242 | 4,49 | |
| Village 70 | 1 | 477.322.299 | 5,22 | 149.574.991 | 7,11 |
| 2 | 11.842.784.319 | 5,22 | 16.617.016.811 | 7,11 | |
| 3 | 1.544.992.716 | 4,93 | 4.894.664.483 | 6,47 | |
| 4 | 7.257.202.532 | 5,57 | 8.805.159.434 | 6,17 | |
| 5 | 30.937.043 | 5,57 | 188.067.407 | 6,17 | |
| Grand Total | 2.654.145.296.563 | 4,47 | 3.352.463.608.499 | 4,83 | |
Source: Centro de Estudios de Opinión- UdeA, FONVALMED, 2021.
c. Rental Profitability based on Offering Sale Price
Using the DTF (4.48%) to project the one-year profitability using the static capitalization method, a profitability of $2,659,832,125,450 is obtained by multiplying the number of property registrations, and a profitability of $3,110,748,890,754 is obtained by multiplying the constructed area of private areas in square meters (Table 8). Furthermore, a profitability of $2,667,072,538,803 is obtained by multiplying the number of property registrations, and $3,119,216,758,929 by multiplying the constructed area of private areas in square meters (Table 9). Finally, a profitability of $1,658,108,897,281 is obtained by multiplying the number of property registrations, and $1,939,205,246.68 by multiplying the constructed area of private areas in square meters (Table 10).
Table 8 Rental Profitability based on Offering Sale Price: DTF
| Rent. X DTF | |||||
|---|---|---|---|---|---|
| Territory | Rent. Mult. Registration | Rent. Mult. M2 | |||
| Commune | Stratum | Rent. ($) | Rent. (%) | Rent. ($) | Rent. (%) |
| Commune 7 | 1 | 16.137.288.482 | 4,48 | 18.620.949.873 | 4,48 |
| 2 | 71.064.627.200 | 4,48 | 92.522.472.172 | 4,48 | |
| 3 | 89.929.826.896 | 4,48 | 105.145.575.199 | 4,48 | |
| 4 | 74.240.328.960 | 4,48 | 65.020.028.648 | 4,48 | |
| 5 | 26.500.693.361 | 4,48 | 28.645.101.038 | 4,48 | |
| Commune 11 | 2 | 34.442.916 | 4,48 | 17.662.605 | 4,48 |
| 3 | 222.841.937 | 4,48 | 489.305.377 | 4,48 | |
| 4 | 130.686.604.800 | 4,48 | 184.955.248.551 | 4,48 | |
| 5 | 444.227.117.419 | 4,48 | 586.891.280.362 | 4,48 | |
| 6 | 26.968.704.000 | 4,48 | 26.217.469.076 | 4,48 | |
| Commune12 | 1 | 622.655.062 | 4,48 | 430.438.596 | 4,48 |
| 2 | 3.838.464.000 | 4,48 | $ 4.741.349.412 | 4,48 | |
| 3 | 102.575.761.640 | 4,48 | 101.590.604.089 | 4,48 | |
| 4 | 195.670.142.976 | 4,48 | 235.962.167.019 | 4,48 | |
| 5 | 164.782.332.446 | 4,48 | 200.535.026.855 | 4,48 | |
| 6 | 2.531.003.620 | 4,48 | 1.731.304.557 | 4,48 | |
| Commune 13 | 1 | 83.481.036.800 | 4,48 | 74.410.188.037 | 4,48 |
| 2 | 108.306.578.252 | 4,48 | 129.354.714.279 | 4,48 | |
| 3 | 111.234.657.855 | 4,48 | 132.136.315.901 | 4,48 | |
| 4 | 41.958.320.603 | 4,48 | 42.636.481.967 | 4,48 | |
| 5 | 360.171.353 | 4,48 | 304.258.721 | 4,48 | |
| Commune 15 | 1 | 97.123.693 | 4,48 | 67.999.538 | 4,48 |
| 2 | 14.292.745.600 | 4,48 | 21.832.542.219 | 4,48 | |
| 3 | 70.709.346.909 | 4,48 | 86.694.604.895 | 4,48 | |
| 4 | 33.293.624.000 | 4,48 | 35.411.891.842 | 4,48 | |
| 5 | 44.678.192 | 4,48 | 46.152.973 | 4,48 | |
| Commune 16 | 1 | 3.507.929.600 | 4,48 | 3.151.270.180 | 4,48 |
| 2 | 48.244.582.400 | 4,48 | 55.255.352.498 | 4,48 | |
| 3 | 269.508.934.609 | 4,48 | 267.211.537.309 | 4,48 | |
| 4 | 246.719.301.959 | 4,48 | 283.324.616.773 | 4,48 | |
| 5 | 257.205.908.035 | 4,48 | 302.292.048.990 | 4,48 | |
| 6 | 2.986.464.743 | 4,48 | 2.630.219.152 | 4,48 | |
| Village 70 | 1 | 410.009.354 | 4,48 | 94.183.766 | 4,48 |
| 2 | 10.172.691.200 | 4,48 | 10.463.334.894 | 4,48 | |
| 3 | 1.404.659.540 | 4,48 | 3.388.999.159 | 4,48 | |
| 4 | 5.835.648.000 | 4,48 | 6.389.717.695 | 4,48 | |
| 5 | 24.877.036 | 4,48 | 136.476.533 | 4,48 | |
| Grand Total | 2.659.832.125.450 | 4,48 | 3.110.748.890.754 | 4,48 | |
Source: Centro de Estudios de Opinión- UdeA, FONVALMED, 2021.
Table 9 Rental Profitability based on Offering Sale Price: PVI
| Rent. X PVI | |||||
|---|---|---|---|---|---|
| Territory | Rent. Mult. Registration | Rent. Mult. m2 | |||
| Commune | Stratum | Rent. ($) | Rent. (%) | Rent. ($) | Rent. (%) |
| Commune 7 | 1 | 16.181.216.307 | 4,49 | 18.671.638.551 | 4,49 |
| 2 | 71.258.074.475 | 4,49 | 92.774.330.526 | 4,49 | |
| 3 | 90.174.627.729 | 4,49 | 105.431.795.303 | 4,49 | |
| 4 | 74.442.420.913 | 4,49 | 65.197.021.730 | 4,49 | |
| 5 | 26.572.831.739 | 4,49 | 28.723.076.776 | 4,49 | |
| Commune 11 | 2 | 34.536.674 | 4,49 | 17.710.685 | 4,49 |
| 3 | 223.448.542 | 4,49 | 490.637.331 | 4,49 | |
| 4 | 131.042.350.950 | 4,49 | 185.458.721.097 | 4,49 | |
| 5 | 445.436.362.139 | 4,49 | 588.488.875.723 | 4,49 | |
| 6 | 27.042.116.364 | 4,49 | 26.288.836.480 | 4,49 | |
| Commune 12 | 1 | 624.350.011 | 4,49 | 431.610.307 | 4,49 |
| 2 | 3.848.912.805 | 4,49 | 4.754.255.989 | 4,49 | |
| 3 | 102.854.986.372 | 4,49 | 101.867.147.094 | 4,49 | |
| 4 | 196.202.782.876 | 4,49 | 236.604.487.114 | 4,49 | |
| 5 | 165.230.891.657 | 4,49 | 201.080.909.609 | 4,49 | |
| 6 | 2.537.893.345 | 4,49 | 1.736.017.396 | 4,49 | |
| Commune 13 | 1 | 83.708.283.177 | 4,49 | 74.612.742.369 | 4,49 |
| 2 | 108.601.403.022 | 4,49 | 129.706.834.848 | 4,49 | |
| 3 | 111.537.453.244 | 4,49 | 132.496.008.356 | 4,49 | |
| 4 | 42.072.536.678 | 4,49 | 42.752.544.087 | 4,49 | |
| 5 | 361.151.787 | 4,49 | 305.086.954 | 4,49 | |
| Commune 15 | 1 | 97.388.077 | 4,49 | 68.184.642 | 4,49 |
| 2 | 14.331.652.336 | 4,49 | 21.891.973.274 | 4,49 | |
| 3 | 70.901.827.064 | 4,49 | 86.930.599.028 | 4,49 | |
| 4 | 33.384.253.629 | 4,49 | 35.508.287.675 | 4,49 | |
| 5 | 44.799.812 | 4,49 | 46.278.607 | 4,49 | |
| Commune 16 | 1 | 3.517.478.646 | 4,49 | 3.159.848.353 | 4,49 |
| 2 | 48.375.910.507 | 4,49 | 55.405.764.845 | 4,49 | |
| 3 | 270.242.573.424 | 4,49 | 267.938.922.306 | 4,49 | |
| 4 | 247.390.904.392 | 4,49 | 284.095.863.695 | 4,49 | |
| 5 | 257.906.056.391 | 4,49 | 303.114.927.760 | 4,49 | |
| 6 | 2.994.594.294 | 4,49 | 2.637.378.955 | 4,49 | |
| Village 70 | 1 | 411.125.454 | 4,49 | 94.440.147 | 4,49 |
| 2 | 10.200.382.605 | 4,49 | 10.491.817.470 | 4,49 | |
| 3 | 1.408.483.209 | 4,49 | 3.398.224.461 | 4,49 | |
| 4 | 5.851.533.402 | 4,49 | 6.407.111.348 | 4,49 | |
| 5 | 24.944.755 | 4,49 | 136.848.040 | 4,49 | |
| Grand Total | 2.667.072.538.803 | 4,49 | 3.119.216.758.929 | 4,49 | |
Source: Centro de Estudios de Opinión- UdeA, FONVALMED, 2021.
Table 10 Rental Profitability based on Offering Sale Price: PPRI
| Rent. X IPPR | |||||
|---|---|---|---|---|---|
| Territory | Rent. Mult. Registration | Rent. Mult. m2 | |||
| Commune | Stratum | Rent. ($) | Rent. (%) | Rent. ($) | Rent. (%) |
| Commune 7 | 1 | 10.059.800.900 | 2,79 | 11.608.086.978 | 2,79 |
| 2 | 44.300.875.050 | 2,79 | 57.677.449.956 | 2,79 | |
| 3 | 56.061.224.572 | 2,79 | 65.546.547.874 | 2,79 | |
| 4 | 46.280.571.171 | 2,79 | 40.532.741.511 | 2,79 | |
| 5 | 16.520.228.862 | 2,79 | 17.857.028.059 | 2,79 | |
| Commune 11 | 2 | 21.471.320 | 2,79 | 11.010.666 | 2,79 |
| 3 | 138.917.113 | 2,79 | 305.027.371 | 2,79 | |
| 4 | 81.468.533.334 | 2,79 | 115.298.984.581 | 2,79 | |
| 5 | 276.926.099.493 | 2,79 | 365.861.305.454 | 2,79 | |
| 6 | 16.811.981.336 | 2,79 | 16.343.670.085 | 2,79 | |
| Commune 12 | 1 | 388.156.037 | 2,79 | 268.330.493 | 2,79 |
| 2 | 2.392.854.515 | 2,79 | 2.955.702.944 | 2,79 | |
| 3 | 63.944.555.520 | 2,79 | 63.330.419.581 | 2,79 | |
| 4 | 121.978.527.102 | 2,79 | 147.096.113.628 | 2,79 | |
| 5 | 102.723.419.621 | 2,79 | 125.011.240.019 | 2,79 | |
| 6 | 1.577.798.682 | 2,79 | 1.079.275.441 | 2,79 | |
| Commune 13 | 1 | 52.041.122.651 | 2,79 | 46.386.459.375 | 2,79 |
| 2 | 67.517.080.990 | 2,79 | 80.638.248.031 | 2,79 | |
| 3 | 69.342.412.294 | 2,79 | 82.372.266.638 | 2,79 | |
| 4 | 26.156.336.725 | 2,79 | 26.579.094.756 | 2,79 | |
| 5 | 224.526.698 | 2,79 | 189.671.404 | 2,79 | |
| Commune 15 | 1 | 60.545.798 | 2,79 | 42.390.134 | 2,79 |
| 2 | 8.909.933.984 | 2,79 | 13.610.156.880 | 2,79 | |
| 3 | 44.079.397.383 | 2,79 | 54.044.424.213 | 2,79 | |
| 4 | 20.754.864.057 | 2,79 | 22.075.367.979 | 2,79 | |
| 5 | 27.851.874 | 2,79 | 28.771.235 | 2,79 | |
| Commune 16 | 1 | 2.186.803.154 | 2,79 | 1.964.465.755 | 2,79 |
| 2 | 30.075.120.365 | 2,79 | 34.445.554.185 | 2,79 | |
| 3 | 168.008.784.501 | 2,79 | 166.576.613.324 | 2,79 | |
| 4 | 153.801.988.402 | 2,79 | 176.621.322.600 | 2,79 | |
| 5 | 160.339.218.579 | 2,79 | 188.445.402.705 | 2,79 | |
| 6 | 1.861.727.932 | 2,79 | 1.639.648.509 | 2,79 | |
| Village 70 | 1 | 255.595.138 | 2,79 | 58.713.082 | 2,79 |
| 2 | 6.341.539.237 | 2,79 | 6.522.723.189 | 2,79 | |
| 3 | 875.648.677 | 2,79 | 2.112.663.279 | 2,79 | |
| 4 | 3.637.876.157 | 2,79 | 3.983.276.862 | 2,79 | |
| 5 | 15.508.060 | 2,79 | 85.077.909 | 2,79 | |
| Grand Total | 1.658.108.897.281 | 2,79 | 1.939.205.246.682 | 2,79 | |
Source: Centro de Estudios de Opinión- UdeA, FONVALMED, 2021
d. ROI
Taking into account the one-year future values of annual net income and offering sale price, the established formula in the profitability methodology is applied to calculate the ROI. By multiplying it by the number of property registrations, a profitability of $2,540,571,059,695 (4.28%) is obtained. Similarly, by multiplying it by the constructed area of private areas in square meters, a profitability of $3,198,057,865,729 (4.61%) is obtained. These results are detailed in Table 11.
Table 11 ROI
| ROI | ||||||
|---|---|---|---|---|---|---|
| Territory | Rent. Mult. Registration | Rent. Mult. M2 | ||||
| Commune | Stratum | Rent. ($) | Rent. (%) | Rent. ($) | Rent. (%) | |
| Commune 7 | 1 | 19.059.371.049 | 5,29 | 19.187.140.961 | 4,62 | |
| 2 | 65.777.184.233 | 4,15 | 97.282.608.781 | 4,71 | ||
| 3 | 88.219.528.291 | 4,39 | 100.344.888.856 | 4,28 | ||
| 4 | 67.751.782.845 | 4,09 | 66.556.988.567 | 4,59 | ||
| 5 | 27.375.596.763 | 4,63 | 31.033.947.389 | 4,85 | ||
| Commune 11 | 2 | 33.916.356 | 4,41 | 16.783.462 | 4,26 | |
| 3 | 231.941.420 | 4,66 | 495.395.976 | 4,54 | ||
| 4 | 128.688.681.211 | 4,41 | 175.749.242.463 | 4,26 | ||
| 5 | 503.029.521.296 | 5,07 | 613.796.560.415 | 4,69 | ||
| 6 | 21.757.354.363 | 3,61 | 31.411.859.546 | 5,37 | ||
| Commune 12 | 1 | 523.175.350 | 3,76 | 259.260.519 | 2,70 | |
| 2 | 3.225.204.242 | 3,76 | 2.849.101.076 | 2,69 | ||
| 3 | 75.939.863.299 | 3,32 | 103.968.231.060 | 4,58 | ||
| 4 | 177.850.007.844 | 4,07 | 209.775.547.205 | 3,98 | ||
| 5 | 191.291.275.938 | 5,20 | 130.711.267.552 | 2,92 | ||
| 6 | 2.938.172.464 | 5,20 | 1.128.486.213 | 2,92 | ||
| Commune 13 | 1 | 78.790.860.910 | 4,23 | 101.448.243.726 | 6,11 | |
| 2 | 95.142.452.140 | 3,94 | 139.109.636.915 | 4,82 | ||
| 3 | 80.025.953.269 | 3,22 | 164.116.751.400 | 5,56 | ||
| 4 | 33.598.906.421 | 3,59 | 51.106.216.220 | 5,37 | ||
| 5 | 288.413.917 | 3,59 | 364.699.696 | 5,37 | ||
| Commune 15 | 1 | 79.057.873 | 3,65 | 74.841.441 | 4,93 | |
| 2 | 11.634.175.308 | 3,65 | 24.029.265.136 | 4,93 | ||
| 3 | 71.416.257.265 | 4,52 | 113.082.320.252 | 5,84 | ||
| 4 | 24.777.131.385 | 3,33 | 55.785.215.765 | 7,06 | ||
| 5 | 33.249.533 | 3,33 | 72.705.902 | 7,06 | ||
| Commune 16 | 1 | 3.297.392.881 | 4,21 | 4.802.084.280 | 6,83 | |
| 2 | 64.059.023.929 | 5,95 | 91.557.927.204 | 7,42 | ||
| 3 | 260.988.274.932 | 4,34 | 265.388.611.905 | 4,45 | ||
| 4 | 209.115.866.242 | 3,80 | 276.471.195.312 | 4,37 | ||
| 5 | 208.623.838.417 | 3,63 | 290.209.085.674 | 4,30 | ||
| 6 | 2.422.369.466 | 3,63 | 2.525.086.247 | 4,30 | ||
| Village 70 | 1 | 453.661.578 | 4,96 | 139.639.929 | 6,64 | |
| 2 | 11.255.741.110 | 4,96 | 15.513.282.250 | 6,64 | ||
| 3 | 1.472.437.244 | 4,70 | 4.597.207.875 | 6,08 | ||
| 4 | 6.874.217.803 | 5,28 | 8.293.177.620 | 5,81 | ||
| 5 | 29.304.401 | 5,28 | 177.132.103 | 5,81 | ||
| Grand Total | 2.540.571.059.695 | 4,28 | 3.198.057.865.729 | 4,61 | ||
Source: Centro de Estudios de Opinión- UdeA, FONVALMED, 2021.
4.1 Qualitative, Territorial, and Contextual Characteristics of the Project’s Influence Zone
Over the past two decades, the city of Medellín has gained international recognition for its social, cultural, economic, and urban transformation. It has emerged as an attractive tourist destination, a thriving business hub, and a place that offers a high quality of life and well-being to its residents and visitors. In 2013, Medellín was honored as the world’s most innovative city in a competition led by The Wall Street Journal and Citigroup. In 2020, it was recognized as a smart city and ranked among the leading “mega-cities” in the digital domain by Netexplo, an international observatory of digital trends sponsored by UNESCO. The city’s privileged location, pleasant climate, advanced transportation system, technological infrastructure, and affordability were highlighted as key factors contributing to its international acclaim. In 2021, the Private Council for Competitiveness ranked Medellín as the most innovative city for the second consecutive year based on the City Competitiveness Index. In 2022, Medellín was nominated as the best destination in South America across categories such as business travel, getaways, events and festivals, meetings and conferences, cultural experiences, and emerging tourism. Moreover, Medellín has been recognized as one of the top 50 places in the world to visit.
Undoubtedly, the aforementioned context has made Medellín a preferred destination for migration over several decades, attracting individuals in search of opportunities and attracted by the city’s high quality of life. This has led to significant improvements in infrastructure, mobility, road development, and other aspects, thereby transforming the environment, economic activities, and lifestyles.
Specifically, since the 1980s, a road development project known as the Western Longitudinal has been planned for the western zone of Medellín. This project is part of the broader framework of the Master Mobility Plan 2007-2020 (AMVA, 2007), which aims to enhance the road system in the Aburrá Valley, particularly Avenida la 80, to connect with other road systems in the western area, including urban roads, bicycle paths, Metro Line B, Metroplús, and Metrocables. The study ‘Western Multimodal Connectivity Project’ (Fonvalmed, 2020) emphasizes that the current POT of the city, approved through Agreement 048 of 2014, recognizes the Western Longitudinal as a territorial strategy at the metropolitan, regional, and municipal levels (Article 10, numeral 2, literal C). Furthermore, it is mentioned that this project is part of the ‘green routes’ envisaged in the public and collective system of the POT’s mobility subsystem.
This project is complemented by the plan for the Light Rail of Avenida 80, as outlined in the Medellín Development Plan 2020-2023. The goal is to maximize mobility conditions, improve the synergy between different modes of transportation, and promote a sustainable and inclusive road system, as defined in the POT. Therefore, the pre-feasibility and feasibility studies for a road of this nature remain relevant and necessary.
Mobility processes derived from the development of sustainable roads and the consolidation of green corridors aim to have a positive impact on both the mobility of the impact zone and the accessibility of the population residing or utilizing these roads. Furthermore, the objective is to improve the quality of life, productivity, efficient use of time, conditions of green infrastructure, risks and vulnerability to climate change, availability and quality of public space, inclusive facilities and infrastructure, as well as gender adaptation in these spaces, constructions, and facilities (Heldt et al., 2021; Nieuwenhuijsen, 2020; Vecchio et al., 2020).
The Western Longitudinal is classified as a megaproject in the city that seeks to promote urban development and further position Medellín on a global level. This project has had an impact on the value of properties in the influence zone, characterized by nearly 50% of them belonging to socioeconomic strata 4 and 5, and approximately 30% to stratum 3. This has led to a concentration of middle, upper-middle, and upper-class social groups in the area. According to Rolnik (2019) and Sassen (2021), housing has become a commodified asset that is part of the new political economy driven by digital technology and is considered as ‘fixed capital whose value lies in the expectation of generating future profits based on fluctuations in real estate prices’ (21), in other words, to obtain profitability. On the other hand, Herrero-Beaumont (2020) argues that a city integrated into the global market is exposed to difficulties in controlling urban space and speculation regarding the value of housing by the local citizens, due to the influence of the international market, currency volatility, and depreciation of the local currency against the dollar and the euro, which have created different housing conditions for both high and modest incomes.
In the impact zone of the Western Longitudinal project, an urban renewal and development process is taking place on urban land, in accordance with the 2014 POT. This plan aims for the future consolidation of urban sectors with excellent quality and the fulfillment of goals related to the provision of public spaces, roads, facilities, and suitable public services for the new population (334). It also seeks appropriate densification and development in line with the occupation model defined in the Plan, ensuring an adequate provision of public space, facilities, road infrastructure, and public services (320). This process provides the possibility for further densification in the area.
In recent years, a noticeable increase in inflation has been observed, which has impacted the rising prices of new, used, or rental housing. The project’s location is characterized by scarce land and positive urban classification attributes, making it a strategic location in the city with great investment potential.
Moreover, according to Rolnik (2019) and Svampa and Viale (2014), these types of projects in globally positioned cities often involve the presence of the global financial sector, construction companies, and a state that facilitates the political framework and attracts investments, with the aim of consolidating privately-owned residential markets. These markets, through corporate agents, integrate with rental digital platforms, which will be used as mechanisms to obtain real estate appreciation (Rolnik, Guerreiro, and Marín-Toro, 2022).
Another relevant aspect is touristification, also associated with this phenomenon. According to Rolnik (2019), the transnational elite acquires high-end houses and apartments in global, cultural, or tourist cities as a way to secure their assets. This phenomenon is more prominent in major globally located cities.
5. Discussion
Collecting information for profitability calculation in urban projects financed by valorization presents technical, conceptual, methodological, and institutional trust challenges. There are concerns regarding the acquisition of information related to residential properties due to sensitive variables such as location security, socioeconomic stratum, housing typology, and surroundings. However, constructing this information is essential for the implementation of public infrastructure projects in the city as it enables crucial decision-making and evaluation of project relevance for affected residents.
Regarding methodological challenges, data collection relied on a market study matrix complemented with territorial analysis and perception. Technological and digital tools were utilized, allowing for automatic synchronization with platform servers and storing surveys and photos in the mobile device’s memory for subsequent submission. The platform has its own servers to store collected information and enables real-time tracking of the number of completed surveys in specific geographic areas. This ensures sample compliance per district, neighborhoods, and socioeconomic strata, with distribution at the block level.
Turning to the results, the different methodologies used are highlighted. Table 12 presents the results of the two variants or multiplications: profitability through property registration multiplication and profitability through multiplication by the constructed area of private properties, both in monetary and percentage terms.
Table 12 Summary of methodologies
| Methodology | Rent. Mult. Registration | ||
|---|---|---|---|
| Rent. ($) | Rent. (%) | ||
| Rent. Reference | Bid value PVI | 2.667.072.538.803 | 4,49 |
| Rent. Reference | Bid value DTF | 2.659.832.125.450 | 4,48 |
| Rent. Found | Rental IPC | 2.654.145.296.563 | 4,47 |
| Rent. Found | ROI | 2.540.571.059.695 | 4,28 |
| Rent. Reference | Bid value IPPR | 1.658.108.897.281 | 2,79 |
| Methodology | Rent. Mult. m2 | ||
| Rent. ($) | Rent. (%) | ||
| Rent. Found | Rental IPC | 3.352.463.608.499 | 4,83 |
| Rent. Found | ROI | 3.198.057.865.729 | 4,61 |
| Rent. Reference | Bid value PVI | 3.119.216.758.929 | 4,49 |
| Rent. Reference | Bid value DTF | 3.110.748.890.754 | 4,48 |
| Rent. Reference | Bid value IPPR | 1.939.205.246.682 | 2,79 |
Source: Centro de Estudios de Opinión- UdeA, FONVALMED, 2021.
For profitability through property registration multiplication, which references profitability rates from PVI, DTF, and IPPR methodologies, a range between $1,658,108,897,281 (2.79%) and $2,667,072,538,803 (4.49%) is observed. On the other hand, the methodologies using IPC for projecting future rental value and offering sale price, namely ‘valor oferta IPC’ and ROI, yield profitability values of 4.47% ($2,654,145,296,563) and 4.28% ($2,540,571,059,695) respectively. These values fall within the established range of reference profitability rates (PVI, DTF, and IPPR).
For profitability calculated through square meter multiplication, three reference profitability rates or given rates used in the PVI, DTF, and IPPR methodologies result in a range between $3,119,216,758,929 (4.49%) and $1,939,205,246,682 (2.79%). However, in this case, the profitability calculated through IPC rent and ROI exceeds this range, with values between $3,352,463,608,499 (4.83%) and $3,198,057,865,729 (4.61%) respectively.
It is important to emphasize that the results obtained from profitability calculations, both in monetary and percentage terms, need to be analyzed within the qualitative, territorial, and contextual context, taking into account the position that the city of Medellín has established in the international arena over the past two decades. The city’s social, cultural, economic, and urban transformation has made it an appealing destination for tourism, a thriving business center, and a place that offers a high quality of life and well-being to its residents and visitors. This transformation has influenced the value of properties as tradable assets, creating a relationship between financial corporations and property owners supported by assets that can be traded in global financial markets. This dynamic is particularly pronounced in major cities worldwide.

