


 English (pdf)
 Article in xml format
 Article references
 Send this article by e-mail
 Cited by SciELO
  Cited by Google
  Similars in
SciELO
Similars in
SciELO  Similars in Google
 Permalink
1. Introduction
Research has been conducted worldwide that relates knowledge management to software development but does not integrate variables relevant to project management aspects.
In software development projects, effort data are fundamental for estimating, planning, and monitoring activities and resources. However, studies show that there are always discrepancies between planning and execution. It is not only due to the effectiveness of planning and estimation but also to factors related to the knowledge of the project team.
Given that in Colombia, in the software sector, most of the companies are micro and small (Restrepo, 2022), the main proposal of the paper is based on the analysis of the relationships between knowledge management and the performance of projects of micro and small companies dedicated to software development, through a process of research, reflection, and application of system dynamics systems to analyze the current situation and review the trends on the subject.
This research has been performed through a case study in Expert Projects SAS, a small custom software development company established in Colombia in 2002, which fulfills the characteristics of the subject under study.
2. Methodology
As a first step, an initial check is performed in the Scopus database owned by Elsevier, where it is possible to identify 23. Nine hundred eleven articles (TITLE-ABS-KEY ( projects AND problems AND software ) ) were used as a base. However, those corresponding to the years 2020 to 2023 (TITLE-ABS-KEY ( projects AND problems AND software ) AND PUBYEAR > 2019 AND PUBYEAR < 2024) were filtered, reducing the number to 4,304, classified in 2,099 conference papers, 1,999 articles, 108 book chapters, 77 reviews, and 41 conference reviews. However, searching for items related to knowledge management (TITLE-ABS-KEY ( ( ( projects AND problems AND software ) AND ( knowledge AND management ) ) AND PUBYEAR > 2019 AND PUBYEAR < 2024) are included in the search, very few research results are observed with only 83 articles, 69 conference papers, eight conference reviews, four reviews and two books for a total of 168 documents. These 168 papers, supplemented with 151 extracted from IEEE (the same query is used) and some earlier ones, are reviewed for relevance.
2.1. Literature Review
A combination of the groupings proposed by Thayer (Thayer et al., 1981) and Mujtaba Hassan (Hassan et al., 2019) has been used to classify and group problems and challenges, detailed in the following.
2.1.1. Planning problems.
Corresponding to this category: optimistic planning (Fairley and Willshire, 2003; Stepanek, 2005; Baldonedo and Montequín, 2017), excessive schedule pressure (Ahonen and Junttila, 2003; Ramos Blanco et al., 2011; Lamandi et al., 2015), poor time estimation (Pino et al., 2006; Martínez and Arango, 2017; Dini and Stumpo, 2018; Farooq et al., p. 20-21), lack of project plan documentation (Stepanek, 2005; Martinez and Arango, 2017), lack of technical specifications (Stepanek, 2005; Qu et al., 2014; Martinez and Arango, 2017), and inclusion of unsolicited requirements (Maglyas et al., 2012; Qu et al., 2014).
2.1.2. Organizational problems.
The problems belonging to this category are the following: Supplier failures (Henriquez, 2009; Riaño and Mauricio, 2014; Qu et al., 2014), quality process inadequacies (Pino et al., 2006; Maglyas et al., 2012; Stepanek, 2005; Bowers and Khorakian, 2014; Liu and Liu, 2015; Almomani et al., 2015; Farooq et al., 2021), communication problems (Fairley and Willshire, 2003; Ahonen and Junttila, 2003; Roger et al., 2005; Rubin, 2012; Qu et al., 2014; Jigeesh et al., 2015; Jeffries and Melnik, 2018 Wozniak, 2021), poor engineering practices (Özkaya et al., 2011), lack of methodology (Stepanek, 2005; Martinez and Arango, 2017; Farooq et al., 2021), and high team turnover (Ahonen and Junttila, 2003; Özkaya et al., 2011; Kuo-Pin and Graham, 2012; Mei-Ying and Yung-Chih, 2014; Ma et al., 2020).
2.1.3. Management Problems.
The problems corresponding to this category are the following: Multiple rework (Maglyas et al., 2012; Haile and Altmann, 2016; Farooq et al., 2021), Misspecification (Maglyas et al., 2012; Esteban and Palacio, 2017), Changing requirements (Larsson and Venkatesh, 2010; Maglyas et al., 2012; Peixoto et al., 2014; Chen et al., 2016; Haile and Altmann, 2016; Toro and Peláez, 2018), and lack of user involvement (Ahonen and Junttila, 2003; Maglyas et al., 2012; Haile and Altmann, 2016).
2.1.4. Control problems.
The problems corresponding to this category are the following: Failure in risk management (Stepanek, 2005; Martinez and Arango, 2017; Liu and Liu, 2015; Almomani et al., 2015; Al et al., 2019; Mahdi et al., 2021), inadequate control (Özkaya et al., 2011; Wang et al., 2012; Martinez and Arango, 2017), and lack of security and confidentiality (Ahonen and Junttila, 2003; Haile and Altmann, 2016).
2.1.5. Cultural problems.
The problems belonging to this category are: Lack of ethics (Fairley and Willshire, 2003; Ahonen and Junttila, 2003; Stepanek, 2005; Jigeesh et al., 2015; Liu and Liu, 2015), weak motivation (Özkaya et al., 2011; Jigeesh et al., 2015; Liu and Liu, 2015; Tanner and Mackinnon, 2015; Naz et al., 2016), lack of stakeholder participation (Ahonen and Junttila, 2003; Maglyas et al., 2012; Riaño and Mauricio, 2014; Haile and Altmann, 2016), and friction between developers and users (Ahonen and Junttila, 2003; Maglyas et al., 2012; Riaño and Mauricio, 2014; Haile and Altmann, 2016; Chen et al., 2016; Wozniak, 2021).
2.1.6. Knowledge management problems.
The problems corresponding to this category are Knowledge problems (Fairley and Willshire, 2003; Özkaya et al., 2011; Ahonen and Junttila, 2003; Stepanek, 2005; Wozniak, 2021; Farooq et al., 2021), new technologies (Martinez and Arango, 2017), and inadequate human resources (Stepanek, 2005; Özkaya et al., 2011; Mei-Ying and Yung-Chih, 2014; Rosenberg et al., 2020).
2.1.7. Experience Problems.
The problems corresponding to this category are Lack of experience (Ahonen and Junttila, 2003; Stepanek, 2005; Al Hafidz and Sensuse, 2019). With these problems identified, we proceed to take a first approach using system dynamics that allows us to understand these factors at the level of an individual project.
2.2. The Analysis
The analysis of the system project is done through modelling in two moments; first an analysis is made based on the relationships between the different variables identified in a project, recognising leverage points and systemic archetypes, and according to them propose alternatives that allow making changes and improvements in the system. In the second step, a simulation is performed by modelling with Forrester diagrams and using Vensim® software from Ventana.
2.2.1. Moment 1.
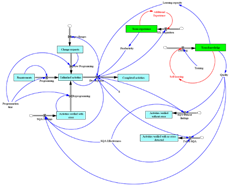
Analysis of the relations. First, the system is defined as a software development project, and the model is identified in its entirety with all the relationships the variables have, in order to avoid dividing the system and losing important relationships that could leverage the relationships (Figure 1).
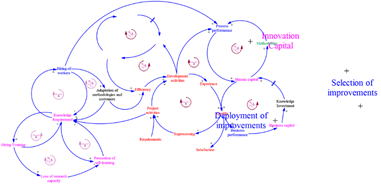
Although the complete model is analyzed, for the sake of presentation and understanding, some aspects of the model are highlighted as follows:
Improvements: In these loops, the variables are presented (without losing the relationships with the other variables) that have to do with the improvement aspects of the project (Figure 1), having as main variables the following: Innovation capital, selection of improvements, development of activities, and efficiency.
Knowledge: These loops represent the variables related to the knowledge aspects of the project (Figure 2), with the following main variables: Process Performance, Methodology, Human Capital, Quality, Business Performance, Business Capital, and Knowledge Investment.
Performance: In these loops, the variables related to the performance aspects of the project (Figure 1) have as main variables the following: Efficiency, Development of Activities, Experience, Quality Reprocessing, Satisfaction, Project Activities, and Requirements.
Once the modeling is done, systemic archetypes are revealed that can be attacked according to the strategies described in The Fifth Discipline (Senge, 2019) and the archetypes identified:
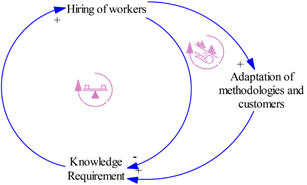
Quick fixes that fail (Figure 2): This archetype shows how knowledge needs are overcome by hiring personnel. However, new personnel must be adapted to the company’s methods and customers’ business models, resulting in knowledge needs that continue to be presented. If the system is further pressured, it will respond similarly, exacerbating the problem.
According to the recommendations of The Fifth Discipline (Senge, 2019), the following strategies can be tried: The amplifying process cannot be avoided but can be slowed down without loss, either through a better requirement process or a pricing strategy that controls demand and has fewer customers but does not reduce profits. Similarly, the constraining process can be improved by increasing capacity with productivity increases, and this point will be discussed later in Moment 2 of the analysis.
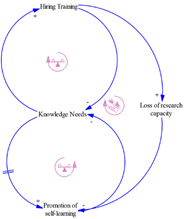
Shifting the burden (Figure 3): Like the previous archetype, however, new elements appear in this one due to the delay in promoting key variables such as self-learning, allowing the creation of spaces for it, or investing in training (which can be even more delayed), resulting in the loss of research capacity in such a changing environment as software development.
According to the recommendations of The Fifth Discipline (Senge, 2019), the following strategies can be tried: Focus on the fundamental solution and encourage self-learning and do not stop applying the temporary solution and do not push with this one, but this solution cannot be maintained over time due to the impact it has not only on this archetype but also on the previous one.
2.2.2. Moment 2. Simulation analysis using Forrester diagrams.
Once the basic loops of the system had been identified, a Forrester model was created with an approach based on a real project; for this simulation, data and methodologies used in the company Expert Projects SAS were taken.
As mentioned above, the model presents some initial assumptions and methodological definitions taken from a real company. However, some theoretical elements were added to contribute to the simulation, and, although it is a systemic model, it has a high analytical component to simulate the operation of the project (Figure 4).
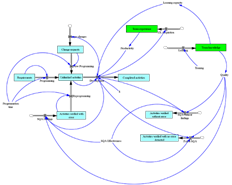
The simulation of this project was based on the existence of a backlog or number of requirements that are measured in a basic unit of size of requirements called points of complexity, with which each requirement is measured based on variables such as type of system and type of transactions that the system has; likewise, an adjustment is made to these points of complexity according to the degree of maturity of the client and its operational processes.
These initial requirements are stored in the Requirements variable at the beginning of the model. After going through programming carried out by the project manager, they become Pending Activities. Once the work team (Development flow variable) develops these activities, they are stored in Finished Activities. The Development variable is significant at this point because it moves important aspects, such as the quality of the work done, which leads to rework and change requests, which lead to additional work.
Since the development variable becomes an important leverage point, special emphasis is placed on it and its analysis, as well as on the variables that influence it, such as Productivity and Learning Capacity.
Learning curve formulas were used to calculate development, (Chase et al., 2009), where the time to develop a unit is given by Equation 1.
Where:
K: Time to produce the first complexity point;
Y: Time to produce the x-th unit.
b: The percentage used to smooth learning.
Since it is desired to determine the average time of a group of requirements (measured in complexity points), it is necessary to calculate the area of the curve of Equation 2 as follows:
Where:
T: Time to complete n complexity points.
Which can be approximated by Equation 3:
It is necessary to define the parameters K and b to determine the values of these approximate development times, which in the model are defined as K: productivity and b: learning capacity.
Productivity is defined with possible ranges of values according to the team’s experience, which increase as more complexity points are developed according to Table 1.
Table 1 Productivity Ranges
| Range | Productivity |
|---|---|
| [0, 3000) | 0.09 |
| [3000, 6000) | 0.08 |
| [6000, 15000) | 0.07 |
| [15000, ∞) | 0.05 |
Source: Authors’ own elaboration.
The learning capacity is defined with possible value ranges according to the knowledge acquired by the team, which increases with the hours dedicated to training and self-learning, according to Table 2.
Table 2 Learning capacity ranges
| Range | Learning (%) |
|---|---|
| [0, 1000) | 0.98 |
| [1000, 3000) | 0.95 |
| [3000, 7000) | 0.94 |
| [7000, ∞) | 0.93 |
Source: Authors’ own elaboration.
Based on this knowledge of the equipment, the quality ranges (percentage of complexity points without errors) are defined according to Table 3.
Table 3 Quality Ranges
| Range | Quality (%) |
|---|---|
| [0, 1000) | 0.85 |
| [1000, 3000) | 0.95 |
| [3000, 7000) | 0.97 |
| [7000, ∞) | 0.98 |
Source: Authors’ own elaboration.
The other variables depend on the quality of the product since the quantities of requirements without errors, with detected errors (reprocessing), and with undetected errors are determined.
3. Simulation results and discussion
After the system is modeled in Vensim®, the simulation lasts 350 days. In the simulation, it is possible to identify some important aspects of the behavior of the variables. In the case of the requirements (Figure 5), they behave as expected since they are programmed at a constant rate to become pending activities (Figure 5).
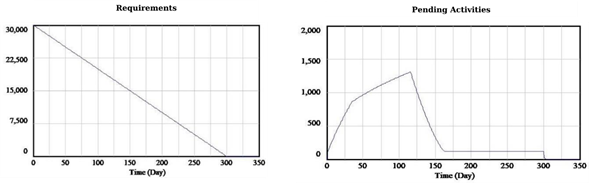
In the particular case of Pending Activities, this variable presents a behavior in which these activities accumulate, fed not only by the requirements but also by the activities that must be reprocessed due to poor quality and the change requests presented in the project during its development. Furthermore, these activities start to decrease as development is generated, a complex flow variable (many iterations with other variables), which will be explained below.
At first glance, the behavior of the Pending Activities may seem strange to see its decrease and stabilization. However, let us compare it with the behavior of the Development variable. We can see that it is consistent, and the latter is the one that needs a more profound analysis (Figure 6).
Source: Authors’ own elaboration.
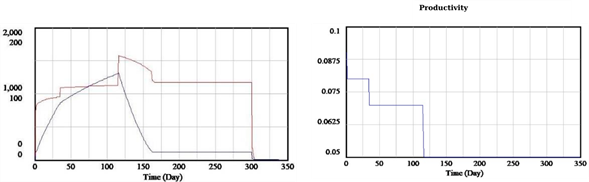
Figure 6 Behaviour of pending activities and development and productivity
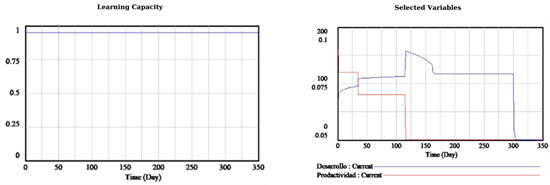
The development variable, which is an important leverage point, has a behavior given by Productivity (Figure 6) and Learning Capacity (Figure 7), which show staggered behaviors as the work team gains experience and knowledge, especially the Productivity variable since the Learning Capacity does not change much over time.
Source: Authors’ own elaboration.
Figure 7 Behaviour of Learning Capacity and Productivity and Development
By comparing productivity and development, we can see how the former influences the latter (Figure 7).
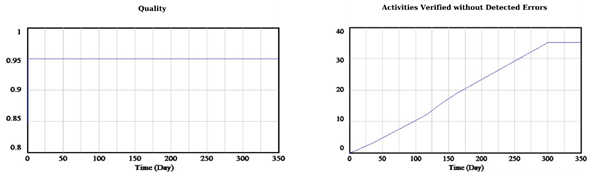
Another variable of interest because it is the cause of the rework is the Quality variable, which remains relatively constant over time, partly because it takes a lot of time and effort to improve this indicator (Figure 8).
Source: Authors’ own elaboration.
Figure 8 Behaviour of Quality and Activities Verified without Detected Errors
According to current conditions, the pending activities would be completed in 300 days (Figure 8). Besides, there are several unverified errors (35.2525 complexity points) according to the simulation (Figure 8).
Based on the previous analysis and the identified behaviors, it is decided to make changes in the system to generate improvements in the variables Team Experience Team Knowledge since they directly influence the variables Learning Capacity, Productivity, and Quality, which are identified as leverage points.
3.1. Suggestion
In the spirit of making positive changes in the system (which could be measured as an improvement in the variable Activities Verified without Error Detected and the completion time of Pending Activities Variable), these changes have been performed to the current model. The simulation was rerun, identifying the new simulation as E02 in the graphs and E01 in the original simulation.
The proposed changes (variables in red) consist of adding Additional Experience and Self-Learning, running a new simulation, and comparing the results and effects on the leverage variables (Figure 9).
In the case of additional experience, the idea is to create recreational and practical activities that allow the work team to generate more experience, which would be reduced (but always maintained) as more experience is gained and productivity improves. This addition increases the accumulation of the experience variable of the team, which in turn generates that, in productivity, the desired productivity levels are reached sooner.
However, it should be noted that more effort is needed to increase productivity since a value of 0.05 (the desired value according to the current evaluation model) is reached on day 98 and without the proposed changes on day 116, which is not so representative in the duration of the project.
Regarding the self-learning variable, the idea is to encourage learning through incentives and the creation of spaces for it (documentation, forums, multipliers, etc.) to generate more team knowledge and thus influence the learning capacity and be able to reach the desired levels of this variable.
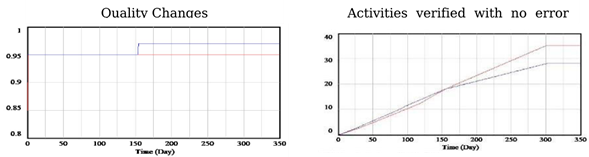
However, these changes are also not representative and do not lead to a reduction in project completion time. The other important variable in the system is Verified Activities without Detected Errors (Figure 10) since it represents the errors that reach the customer without being detected by the quality system and are influenced by the quality variable (Figure 10).
Source: Authors’ own elaboration.
Figure 10 Quality Changes and Activities verified with no error detected
A significant improvement (21% improvement) is presented in the variable “activities verified without detected errors,” which is significant for a customer. Based on this new simulation, it is concluded that modifying the development times, the productivity improvement, or the work team’s learning capacity requires more extraordinary efforts than those presented, which could already generate costs related to the proposed programmers.
3.2. Sensitivity analysis
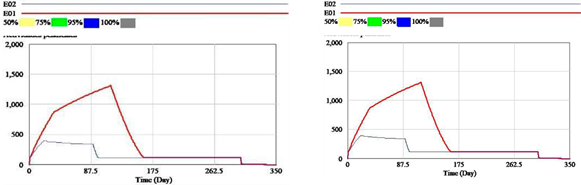
According to the analysis carried out in the previous simulations, it is necessary to perform a sensitivity analysis related to the variables Training, Pending Activities, and Verified Activities without detected error (Figure 11).
Source: Authors’ own elaboration.
Figure 11 Sensitivity of Verified Activities without Detected Errors and Pending Activities
According to the analysis, it is found that when making the different simulations varying the parameter in feasible values from the point of view of capacity (from one hour daily training to three, which is already very difficult to implement), there is slight variation in the activities that reach the customer with problems; likewise, it was found that the activities pending completion have no variation, indicating that this is not the means to achieve changes.
4. Conclusions
Based on the analyses and simulations performed, the following conclusions can be drawn:
Although the focus of this study was initially carried out with a purely systemic view, the model designed by Forrester to determine the behavior presents the necessary analytical components.
In the company Expert Projects, SAS models are presented to determine the productivity of work teams; these models should be reviewed to identify all aspects and variables that affect them, whether environmental, social, or technical factors, such as learning capacity and knowledge management, allowing for improvement in the projects.
Although there are improvements in the quality of the product to be delivered to the client through changes in the training of the work teams, the capacity to complete the project is still maintained. In addition, the variables that affect this system project are much more than those already identified, for which a broader study is recommended, where a much more complex model is involved.
When the system is pressed, it reacts in the same way, which means that the changes presented in the simulation are not so significant; however, it is possible that these changes were not presented at the time of one project but at the time of many projects, and therefore it is recommended to make a study focussing more on the organization over time and not on a particular project.

