


 English (pdf)
 Article in xml format
 Article references
 Send this article by e-mail
 Cited by SciELO
  Cited by Google
  Similars in
SciELO
Similars in
SciELO  Similars in Google
 Permalink
1. Introduction
Customer Analytics Capabilities (CAC) is a concept recently integrated into business management vocabulary, which emerges from the combination of organizational capabilities and customer analytics. The first component has been extensively studied under approaches that define it as a set of organizational routines that are imperfectly imitable and hardly substitutable, among other characteristics (e.g., dynamic capabilities approach; Teece et al., 1997). However, the second component is more ambiguous, as no consensus has yet been reached on its definition. This is evidenced by the different conceptions underlying the attempts to define customer analytics: as an action or method (e.g., dealing with recognizing customer behavior and predicting their buying patterns; Nethravathi et al., 2020); as a process (e.g., acquisition, storage, processing, and analysis of vast volumes, variety, and velocity of customer-related data; Hallikainen et al., 2020); and as a strategic resource (e.g., final insertion of the analytics concept into marketing and strategy disciplines; Louro et al., 2019).
Despite these considerations, some authors have made efforts to operationalize CAC. Hossain et al. (2020a) propose a measurement scale obtained from the review of 59 empirical studies that address analytics in the retail context. Consequently, the scale does not capture the multiple facets in which interactions between organizations and customers can occur, but only those typical in the retail context. Furthermore, CAC is approached as a formative construct, implying that it exists as the result of executing marketing routines. This approach contradicts the interpretation of CAC as a process, through which organizational routines capable of reconfiguring customer-related operational routines are executed. Likewise, the empirical manifestations considered (e.g., detecting trends, creating creative strategies for new offers, investing resources to make current offers) do not describe the role of data analytics in their execution.
Louro et al. (2019) propose a CAC measurement scale with three dimensions: customer information quality; team expertise; and customer knowledge absorption. The “team expertise” dimension includes three skills that people who process customer data must have: technical skill; technological skill; and business skill. This view makes it difficult to understand and represent CAC as organizational routines that create value for the organization. So much so that the scale does not specify those practices that an organization should adopt to guide the development of concrete work plans for analytics departments in customer contexts.
Hallikainen et al. (2020) model CAC as a unidimensional construct with seven empirical manifestations. Although a unidimensional scale is useful because of its parsimony, it does not delve into the dimensions underlying the phenomenon and, therefore, does not make explicit the main macro-themes that make up the CAC. The seven items on this scale capture the use of big data to segment customers and markets, to evaluate customer retention and lifetime value, to personalize offers and channels, and to identify the best customers. Therefore, it leaves out other possible interactions of the organization with the customer, such as the deployment of loyalty strategies, the launch of new products, and the execution of strategies aimed at deepening the relationship with the customer.
Given the opportunity to provide a new scale that synthesizes and describes the main organizational routines involved in CAC based on empirical manifestations extracted from scientific literature, this work aims to answer the following research question:
How can CAC be measured, considering an organizational routines approach emerging from scientific evidence on the subject and ensuring psychometric quality?
Answering the above question makes it easier for scholars to carry out comprehensive, reliable, and valid measurements of CAC, in such a way that they can relate the construct to business performance, as well as carry out effective organizational diagnoses on the subject and generate agendas and plans for the improvement of analytics departments.
This study is organized in five sections. The first section introduces the problem to be addressed. The second part presents a theoretical framework that conceptualizes analytics, customer analytics, and customer analytics capabilities. In the third section, the analysis methods used are described and the results are presented in the fourth. The fifth section presents the discussion, followed by conclusions and future challenges. Finally, in section seven the limitations of our study are provided.
2. Theoretical framework
2.1. Conceptualization of analytics, customer analytics and CAC
The concept referred to as CAC still needs to be addressed in organizational management. To clarify such a concept, it is necessary to resort to foundational concepts, such as customer analytics, and frame them within the organization’s capabilities. The taxonomy presented in Figure 1 illustrates the relationship between different denominations that can be found in the literature to refer to customer analytics, as well as the differentiation between customer analytics and CAC.
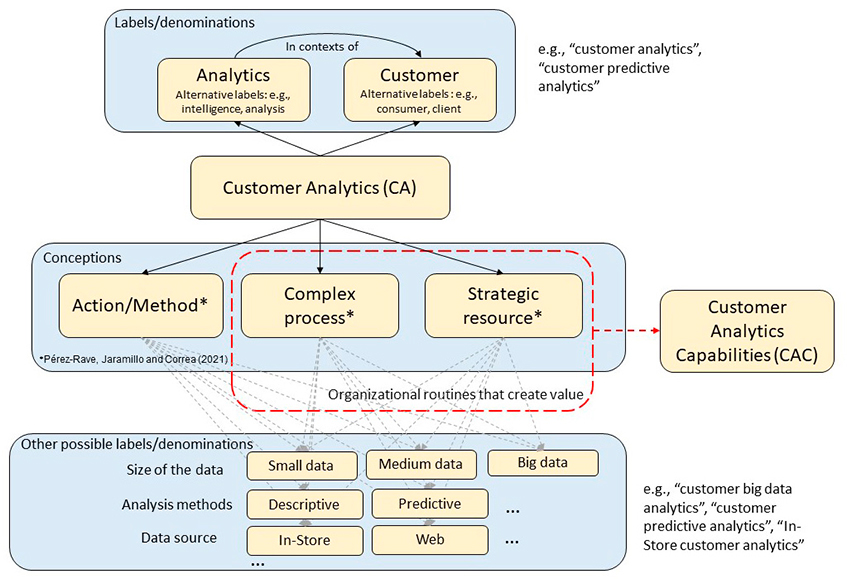
Source: Authors’ own elaboration.
Figure 1 Representation of the conceptual difference between customer analytics and CAC
Figure 1 shows that the study of customer analytics lies at the intersection between analytics and the customer. Analytics can be understood as the application of processes and techniques that transform raw data into relevant information for decision-making (Wilder and Ozgur, 2015). Analytics is a primary concern for decision-makers in the current business environment. Due to organizational complexity, decision-makers cannot rely on their limited knowledge and are turning to analytics to improve the results of their decisions (Rezaei et al., 2022). Analytics has been highlighted by several authors as a capability that helps organizations have better competitive performance. Thus, Gunasekaran et al. (2017) find that analytics positively affects organizational performance, O’Neill and Brabazon (2019) found a significant relationship between higher levels of analytics skill and the ability to generate organizational value and competitive advantage, and Dubey et al. (2018) also found that analytics is effective in gaining competitive advantage.
Customer analytics is one of the subdimensions of marketing analytics, which is, at the same time, a subdimension of analytics (Hossain et al., 2020b) and has recently been gaining importance due to the rise of innovative technologies and because of the pressure that exists today, more than ever, to satisfy customers by leveraging structured and unstructured data (Sun et al., 2014).
As seen in Figure 1, although some authors refer to customer analytics with the literal term, it is possible to find in the literature that the terms “analytics” and “customer” have different labels or names referring to the same essence: analytics in customer contexts. Thus, for example, it is possible to find references to “customer intelligence” (Dinh et al., 2022), “client analytics” (Ediger et al., 2014), “consumer analytics” (Erevelles et al., 2016), among others, referring to analytics within the specific domain of the customer.
Given the lack of conceptual maturity that still exists regarding customer analytics, different conceptions underlying the attempts to define analytics in customer contexts can be identified. Thus, there is a conception that refers to it as an action or a method. For example, Nethravathi et al. (2020) define it as the discipline that deals with recognizing customer behavior and predicting their purchasing patterns to improve business and environmental sustainability. In this sense, Fernández (2019) suggests that organizations can thus develop personalized products and services and even anticipate their needs, which enhances the user experience. Another conception refers to analytics in customer contexts as a process. For example, Hallikainen et al. (2020) define it as the acquisition, storage, processing, and analysis of an immense volume, variety, and velocity of customer-related data, with the aim of creating meaningful information for decision-making in the company and discovering insights in a timely manner. A third conception of analytics in the customer context refers to it as a strategic resource. Louro et al. (2019) point out that customer analytics is the final insertion of the concept of analytics into the disciplines of marketing and strategy.
Under these considerations, CAC can be understood as a set of organizational routines that create value for the organization, within the framework of processes and methods for exploring and exploiting customer data and their interactions with the organization.
2.2. CAC as a source of competitive advantage using the dynamic capabilities approach
Teece et al. (1997) define dynamic capabilities as the ability to integrate, build, and reconfigure internal and external competencies to rapidly cope with environmental changes. Pavlou and Sawy (2011) propose that they are an essential driver of an organization’s competitive advantage, through the renewal of operational capabilities. Consistent with that conceptualization, Louro et al. (2019) define CACs as a dynamic capability present in organizations that continuously respond to trends in their markets and remain attentive to potential customer opportunities.
A market-oriented organization places importance on understanding both the expressed and unexpressed needs of its customers, as well as on building unique capabilities to satisfy their desires (Slater and Narver, 1999). CAC, by acting on the operational routines of marketing and related areas (Hossain et al., 2020a) to reconfigure them, contributes to achieving competitive advantages to the extent that it enables the organization to address all customer- management fronts in a rare, valuable, imperfectly imitable, and difficult-to-substitute manner, in accordance with the theory of resources and capabilities.
2.3. Psychometric properties for the development of measurement scales
According to the Real Academia Española (s.f.), a construct is a theoretical framework used to comprehend a particular issue. CAC is conceptualized as a construct, serving as an underlying factor in a series of observed manifestations.
The traditional paradigm for the development of construct measurement scales includes: generation of items; definition of the evaluation scale; evaluation of content validity; selection of a sample; execution of exploratory factor analysis; evaluation of internal consistency; execution of confirmatory factor analysis; and the evaluation of convergent and discriminant validity (Swanson and Holton, 2005). Following these steps leads to the development of measurement scales that meet the following psychometric properties:
Content validity: the degree to which a measure covers the content domain of what it is trying to measure (Yaghmale, 2003; Pérez-Rave, 2021a)
Construct validity: the degree to which the measurement of a given construct evaluates what it is supposed to measure. Thus, it is expected that the measures among themselves reflect convergence towards the underlying construct, but also that they help to discriminate with respect to the measures of other constructs. It includes convergent and discriminant validity (Pérez-Rave, 2021a; Ployhart and Schneider, 2012; Sackett et al., 2012).
Reliability: has to do with the measurement error in the measurement process. In general, reliability is the tendency towards consistency of scores, which gives an idea of the precision of the instrument and its ability to generate stable scores (Martínez, Hernández and Hernández, 2006; Pérez-Rave, 2021aa.
Equity: this is the ability of the instrument to evaluate individual differences impartially, independent of personal characteristics such as gender, age, position held, etc. (AERA et al., 1999; Pérez-Rave, 2021a).
3. Method
This section describes the formulation of the items, the participants and the analytical framework used.
3.1. Formulation of the items
The generation of the items was based on the identification of the manifestations or uses of analytics in customer contexts, as found in the 42 studies subjected to the previously conducted systematic literature review (Maya-Restrepo, 2023). From these manifestations, an adjustment process was conducted considering the inclusion, where appropriate, of different phases of the analytical process in which such manifestation could occur (e.g., collecting, analyzing, evaluating). That is, for example, if the use of analytics in a customer context was found as “identifying the best customers for the company,” it was transformed into “analyzing transactional data to identify the best customers for the company.”
Twenty-eight items were developed to represent CAC. An example of these is “How often does the organization where you work analyze data on the performance of competitors on customer-related issues?” The response format was a 5-point Likert scale: 1= Not carried out or carried out more frequently than once a year; 2 = At least once a year; 3 = At least once every six months; 4 = At least once every three months; 5 = At least once a month. In Table 1, the items associated with the reference studies from which they were extracted are observed. The items of the final scale after psychometric validation are presented in Appendices 1 and 2.
Table 1 Items associated with the studies from which they originated
| Item | Reference study | item | Reference study |
|---|---|---|---|
| CAC1 | Sohrabi et al. (2019) | CAC15 | Nethravathi et al. (2020) |
| CAC2 | Sohrabi et al. (2019) | CAC16 | Hallikainen et al. (2020) |
| CAC3 | Holland et al. (2019) | CAC17 | Hossain et al. (2020a) |
| CAC4 | Holland et al. (2019) | CAC18 | Ramana et al. (2019) |
| CAC5 | Boldosova (2019) | CAC19 | Mariani & Wamba (2020) |
| CAC6 | Petrescu et al. (2020) | CAC20 | Kolsarici et al. (2020) |
| CAC7 | Vecchio et al. (2020) | CAC21 | Cao & Tian (2020) |
| CAC8 | Yerpude & Singhal (2019) | CAC22 | Cao & Tian (2020) |
| CAC9 | Rajan (2019) | CAC23 | Cao & Tian (2020) |
| CAC10 | Hallikainen et al. (2020) | CAC24 | Liao & Hsu (2020) |
| CAC11 | Cao & Tian (2020) | CAC25 | He et al. (2019) |
| CAC12 | Rajendran (2020) | CAC26 | Mariani & Wamba (2020) |
| CAC13 | Le et al. (2020) | CAC27 | Mariani & Wamba (2020) |
| CAC14 | Le et al. (2020) | CAC28 | Rakhman et al. (2019) |
Source: Authors’ own elaboration.
3.2. Content validity analysis
Following the above, the analysis of the content validity of the proposed items was conducted. The method used to carry it out was the expert panel, in which a group of experts in the area of interest (in this case, organizational administration) assessed the attributes of the items. Egaña et al. (2014) conducted a literature review of 40 studies to capture the methods used to carry out the analysis of content validity in the design of measurement scales. According to them, the expert panel is the most used method for evaluating this type of validity. The same authors cite references indicating that the appropriate number of experts can range from 7 to 30 and suggest that the most important aspect when using this method is to select experts with the appropriate profile. The present study involved 10 experts in organizational management, who evaluated the attribute of clarity of the items. Although the attribute of relevance is also often evaluated as part of content validity, it was not considered on this occasion, as the items were obtained from empirical evidence provided by the 42 studies previously reviewed.
For the evaluation of the attribute of clarity, a matrix-type format was developed, which included the formulated items (rows) and five possible ratings for the clarity of the items: very clear (5); clear (4); moderately clear (3); unclear (2); and very unclear (1). As mentioned, it was administered to 10 experts in the field of organizational management. Table 2, shows the descriptive statistics of the scores. Items rated 4 or 5 were immediately accepted and those rated 3 or less were subject to modifications to improve clarity.
Table 2 Descriptive statistics of the attribute of clarity
| n | Mean | Min | Max | St. Dev. | Item | Mean | Min | Max | St. Dev. |
|---|---|---|---|---|---|---|---|---|---|
| CAC1 | 4.5 | 3 | 5 | 0.71 | CAC15 | 4.9 | 4 | 5 | 0.32 |
| CAC2 | 4.4 | 3 | 5 | 0.70 | CAC16 | 5 | 5 | 5 | 0 |
| CAC3 | 4.5 | 3 | 5 | 0.71 | CAC17 | 4.6 | 3 | 5 | 0.70 |
| CAC4 | 4.4 | 3 | 5 | 0.70 | CAC18 | 4.7 | 4 | 5 | 0.48 |
| CAC5 | 4.2 | 3 | 5 | 0.92 | CAC19 | 4.8 | 4 | 5 | 0.42 |
| CAC6 | 4.5 | 3 | 5 | 0.71 | CAC20 | 4.7 | 4 | 5 | 0.48 |
| CAC7 | 4.7 | 4 | 5 | 0.48 | CAC21 | 4.8 | 4 | 5 | 0.42 |
| CAC8 | 4.5 | 4 | 5 | 0.53 | CAC22 | 4.8 | 4 | 5 | 0.42 |
| CAC9 | 4.5 | 3 | 5 | 0.71 | CAC23 | 4.7 | 4 | 5 | 0.48 |
| CAC10 | 4.6 | 4 | 5 | 0.52 | CAC24 | 4.5 | 3 | 5 | 0.71 |
| CAC11 | 4.5 | 4 | 5 | 0.53 | CAC25 | 4.6 | 3 | 5 | 0.70 |
| CAC12 | 4.9 | 4 | 5 | 0.32 | CAC26 | 4.7 | 4 | 5 | 0.48 |
| CAC13 | 4.7 | 4 | 5 | 0.48 | CAC27 | 4.6 | 2 | 5 | 0.97 |
| CAC14 | 4.7 | 4 | 5 | 0.48 | CAC28 | 4.7 | 4 | 5 | 0.48 |
Source: Authors’ own elaboration.
According to Table 2, 11 out of the 28 items underwent some form of modification after evaluation by the experts, as they received a rating equal to or less than 3.
Table 3 shows the basic information of the experts who served as validators of the proposed instrument: gender; activity with which their current professional work is most related; highest academic degree; training undergraduate degree; and years of work experience. Table 3 corroborates the suitability of the experts to carry out the evaluation, due to their academic degree, field of training related to organizational administration, and years of professional experience.
Table 3 General information about the experts
| Expert | Gender | Activity | Academic degree | Undergraduate program | Years of experience |
|---|---|---|---|---|---|
| E1 | M | Teaching/Research | Ph.D. | Administrative eng. | 16 |
| E2 | M | Teaching/Research | Ph.D. | Economics | 11 |
| E3 | F | Teaching/Research | Ph.D. | Administrative eng. | 15 |
| E4 | F | Teaching/Research | Ph.D. | Accounting | 14 |
| E5 | F | Teaching/Research | Ph.D. | Business management | 18 |
| E6 | M | Teaching/Research | M.Sc. | Industrial eng. | 15 |
| E7 | M | Strategic, tactical and operational tasks in a company | M.Sc. | Software eng. | 10 |
| E8 | F | Teaching/Research | Ph.D. | Business management | 15 |
| E9 | M | Teaching/Research | Ph.D. | International business | 12 |
| E10 | M | Teaching/Research | M.Sc. | Business management | 14 |
Source: Authors’ own elaboration.
Table 4 shows a sample of the items before and after content validation with the experts. The changes made corresponded to the suggestions and evaluation of the experts to improve the clarity of the item. As seen in Table 4, clarity adjustments primarily involved substituting those words that held some degree of ambiguity and précising the action that was intended to be talked about (e.g., determine, monitor, etc.).
Table 4 Items before and after the content validation process described above
| Items before content validity analysis | Item ID | Items after analysis of content validity (final version) |
|---|---|---|
| Collect data on the variables that affect the company’s income | CAC1 | Monitor the variables that most affect the company’s economic performance |
| Collect data on competitors’ behavior in customer-related dimensions | CAC3 | Collect data on competitors’ behavior on customer-related issues |
| Determine the best commercial strategy to implement based on the analysis of customer-related data (e.g., needs, preferences, sociodemographic variables, recommendation intentions). | CAC5 | Define commercial strategies to implement based on the analysis of customer-related data (e.g., needs, preferences, sociodemographic variables, recommendation intentions) |
Source: Authors’ own elaboration.
3.3. Sample description
Between September and October 2022, the questionnaire was administered to professionals working in areas related to customer data analysis (e.g., marketing, customer-centric data analytics, consumer insight, market surveillance). Most of the professionals were contacted through LinkedIn, the largest professional social network in the world with more than 200 million members (Sumbaly et al., 2013), and others through professional networks in Colombia. In total, approximately 520 requests were sent out, of which 101 completed questionnaires were obtained (response rate: 19%, boosted by the promise of receiving an executive report upon completion of the study). The respondents belong to 101 different companies and include individuals working in analytics (26.7%; analysts: 7.9%; supervisors or coordinators: 11.8%; director or manager: 6.9%), in marketing or related functions (72.2%; analysts: 10.8%; supervisors or coordinators: 27.7%; director or manager: 33.6%) and in general management (1%). Eighty-two percent of the organizations to which the respondents belong are engaged in commerce or service provision, while the remaining 18% are involved in industrial activities.
3.4. Analytical framework
The study is cross-sectional, employing a design for the development and validation of scales with psychometric rigor. The methodology used to refine and validate the scale follows the MinerConstructo framework (Pérez Rave, 2021b), which contains seven stages, four of which are useful in the present study: observe ( a descriptive diagnosis of the variables is carried out using measures of central tendency, dispersion, and correlation); explore (the necessary conditions for conducting an exploratory factor analysis are assessed, potential underlying factors in the data are identified, an exploratory factor structure is provided, and the Cronbach’s Alpha reliability measure is calculated); confirm (a confirmatory factor analysis is performed in which the functional relationships between constructs and their factor loadings are identified, as well as the analysis of convergent and discriminant validity between factors); and communicate (the results are expressed through scientific article format). The other stages of the framework are not applied in this work (apply, explain, and predict), as covering structural relationship analysis and practical application (e.g., diagnoses) is beyond the scope of the study. This framework combines analytical capabilities (e.g., machine learning methods, automated tasks, among others) and psychometric analysis of latent variables, integrating resources from various R packages, and has been applied in other constructs, such as: dynamic capabilities of continuous improvement, (Pérez-Rave, Guerrero et al., 2022); quality of health services (Pérez-Rave, Figueroa et al., 2022) and dignified treatment for health workers (Pérez-Rave, González-Echavarría et al., 2022).
4. Results
The results are presented according to the above-mentioned stages.
4.1. Observe
Table 5 displays the descriptive statistics of the responses provided by the survey participants to the 28 items of the CAC scale.
Table 5 Description of responses to items
| Item | Min | Max | Mean | St.dev. | Median | Q1 | Q3 | Kurto | Assym | n.obs |
|---|---|---|---|---|---|---|---|---|---|---|
| cac1 | 1 | 5 | 4,782 | 0,642 | 5 | 5 | 5 | 14,397 | -3,594 | 101 |
| cac2 | 2 | 5 | 4,485 | 0,832 | 5 | 4 | 5 | 1,766 | -1,604 | 101 |
| cac3 | 1 | 5 | 4,05 | 1,081 | 4 | 4 | 5 | 0,93 | -1,18 | 101 |
| cac4 | 1 | 5 | 3,96 | 1,148 | 4 | 3 | 5 | 0,401 | -1,062 | 101 |
| cac5 | 1 | 5 | 4,495 | 0,844 | 5 | 4 | 5 | 4,468 | -2,01 | 101 |
| cac6 | 1 | 5 | 3,871 | 1,222 | 4 | 3 | 5 | -0,308 | -0,863 | 101 |
| cac7 | 1 | 5 | 3,97 | 1,323 | 4 | 4 | 5 | 0,363 | -1,256 | 101 |
| cac8 | 1 | 5 | 3,911 | 1,327 | 4 | 3 | 5 | -0,283 | -1,007 | 101 |
| cac9 | 1 | 5 | 3,97 | 1,33 | 5 | 3 | 5 | -0,036 | -1,108 | 101 |
| cac10 | 1 | 5 | 4,317 | 1,183 | 5 | 4 | 5 | 1,922 | -1,737 | 101 |
| cac11 | 1 | 5 | 4,208 | 1,211 | 5 | 4 | 5 | 1,148 | -1,502 | 101 |
| cac12 | 1 | 5 | 3,752 | 1,577 | 5 | 3 | 5 | -0,969 | -0,819 | 101 |
| cac13 | 1 | 5 | 2,901 | 1,473 | 3 | 1 | 4 | -1,463 | -0,017 | 101 |
| cac14 | 1 | 5 | 3,416 | 1,437 | 4 | 2 | 5 | -1,121 | -0,503 | 101 |
| cac15 | 1 | 5 | 3,663 | 1,478 | 4 | 3 | 5 | -0,781 | -0,832 | 101 |
| cac16 | 1 | 5 | 3,564 | 1,519 | 4 | 2 | 5 | -1,134 | -0,621 | 101 |
| cac17 | 1 | 5 | 3,99 | 1,237 | 4 | 3 | 5 | -0,101 | -1,017 | 101 |
| cac18 | 1 | 5 | 3,98 | 1,28 | 4 | 4 | 5 | 0,226 | -1,18 | 101 |
| cac19 | 1 | 5 | 3,97 | 1,338 | 4 | 3 | 5 | 0,083 | -1,163 | 101 |
| cac20 | 1 | 5 | 4,337 | 1,186 | 5 | 4 | 5 | 1,992 | -1,769 | 101 |
| cac21 | 1 | 5 | 3,95 | 1,252 | 4 | 3 | 5 | -0,073 | -1,028 | 101 |
| cac22 | 1 | 5 | 4,02 | 1,208 | 4 | 4 | 5 | 0,659 | -1,25 | 101 |
| cac23 | 1 | 5 | 4,208 | 1,16 | 5 | 4 | 5 | 1,559 | -1,546 | 101 |
| cac24 | 1 | 5 | 3,822 | 1,26 | 4 | 3 | 5 | -0,422 | -0,854 | 101 |
| cac25 | 1 | 5 | 3,683 | 1,392 | 4 | 3 | 5 | -0,639 | -0,816 | 101 |
| cac26 | 1 | 5 | 3,624 | 1,489 | 4 | 2 | 5 | -0,966 | -0,733 | 101 |
| cac27 | 1 | 5 | 4,05 | 1,299 | 5 | 4 | 5 | 0,27 | -1,229 | 101 |
| cac28 | 1 | 5 | 3,752 | 1,424 | 4 | 3 | 5 | -0,734 | -0,819 | 101 |
Source: Authors’ own elaboration.
As can be seen in Table 5, nearly all item scores range from 1 to 5, except for cac2, with mean values ranging between 2.901 (cac13) and 4.782 (cac1), and standard deviations ranging from 0.642 (cac1) to 1.577. (cac12). Ten of the 28 items had an average rating higher than 4, 17 of them between 3 and 4, and only one had an average rating lower than 3. The above shows that, although the survey managed to capture different positions among the respondents, there is a tendency to positively value customer analytics practices in organizations. Furthermore, all items have negative asymmetry values, which also indicates the tendency to adopt favorable positions regarding organizational practices related to customer analytics. In most cases (except for cac1 and cac5), kurtosis is between -2 and 2, suggesting that there are no extreme deviations from normality.
Table 6 contains the Pearson correlation coefficients for all pairs of items. The mean value of the correlation coefficients is 0.40, and the first and third quartiles are 0.34 and 0.504, respectively. The moderate correlation observed among most of the items suggests the presence of underlying patterns to be discovered in the following steps.
Table 6 Pearson correlations between items
| cac1 | cac2 | cac3 | cac4 | cac5 | cac6 | cac7 | cac8 | cac9 | cac10 | cac11 | cac12 | cac13 | cac14 | cac15 | cac16 | cac17 | cac18 | cac19 | cac20 | cac21 | cac22 | cac23 | cac24 | cac25 | cac26 | cac27 | cac28 | |
|---|---|---|---|---|---|---|---|---|---|---|---|---|---|---|---|---|---|---|---|---|---|---|---|---|---|---|---|---|
| cac1 | 0,462 | 0,174 | 0,083 | 0,072 | 0,142 | 0,11 | 0,13 | 0,227 | 0,197 | 0,149 | 0,084 | 0,146 | 0,045 | 0,133 | 0,158 | 0,161 | -0,03 | 0,179 | 0,018 | 0,074 | 0,096 | 0,035 | 0,088 | 0,09 | 0,039 | 0,025 | 0,072 | |
| cac2 | 0,462 | 0,307 | 0,24 | 0,167 | 0,328 | 0,04 | 0,248 | 0,176 | 0,076 | 0,097 | 0,024 | 0,276 | 0,064 | 0,118 | 0,208 | 0,267 | 0,112 | 0,175 | 0,157 | 0,273 | 0,12 | -0,002 | 0,16 | 0,048 | 0,076 | 0,107 | 0,085 | |
| cac3 | 0,174 | 0,307 | 0,816 | 0,499 | 0,482 | 0,456 | 0,484 | 0,502 | 0,387 | 0,344 | 0,488 | 0,493 | 0,405 | 0,399 | 0,513 | 0,554 | 0,218 | 0,423 | 0,471 | 0,564 | 0,436 | 0,438 | 0,381 | 0,369 | 0,329 | 0,233 | 0,398 | |
| cac4 | 0,083 | 0,24 | 0,816 | 0,464 | 0,374 | 0,368 | 0,496 | 0,386 | 0,466 | 0,351 | 0,403 | 0,453 | 0,331 | 0,499 | 0,569 | 0,507 | 0,258 | 0,448 | 0,407 | 0,576 | 0,455 | 0,352 | 0,327 | 0,399 | 0,412 | 0,256 | 0,343 | |
| cac5 | 0,072 | 0,167 | 0,499 | 0,464 | 0,644 | 0,506 | 0,441 | 0,423 | 0,362 | 0,456 | 0,416 | 0,434 | 0,389 | 0,391 | 0,31 | 0,57 | 0,324 | 0,527 | 0,581 | 0,534 | 0,579 | 0,415 | 0,356 | 0,475 | 0,38 | 0,315 | 0,477 | |
| cac6 | 0,142 | 0,328 | 0,482 | 0,374 | 0,644 | 0,598 | 0,523 | 0,502 | 0,291 | 0,431 | 0,414 | 0,476 | 0,458 | 0,524 | 0,368 | 0,614 | 0,427 | 0,512 | 0,603 | 0,499 | 0,537 | 0,449 | 0,453 | 0,558 | 0,396 | 0,451 | 0,527 | |
| cac7 | 0,11 | 0,04 | 0,456 | 0,368 | 0,506 | 0,598 | 0,545 | 0,591 | 0,402 | 0,385 | 0,476 | 0,455 | 0,343 | 0,399 | 0,352 | 0,422 | 0,295 | 0,452 | 0,485 | 0,518 | 0,539 | 0,604 | 0,477 | 0,56 | 0,421 | 0,373 | 0,421 | |
| cac8 | 0,13 | 0,248 | 0,484 | 0,496 | 0,441 | 0,523 | 0,545 | 0,423 | 0,413 | 0,509 | 0,5 | 0,527 | 0,512 | 0,53 | 0,343 | 0,42 | 0,44 | 0,562 | 0,617 | 0,605 | 0,463 | 0,46 | 0,457 | 0,472 | 0,393 | 0,455 | 0,353 | |
| cac9 | 0,227 | 0,176 | 0,502 | 0,386 | 0,423 | 0,502 | 0,591 | 0,423 | 0,362 | 0,42 | 0,454 | 0,448 | 0,341 | 0,376 | 0,271 | 0,498 | 0,299 | 0,393 | 0,539 | 0,468 | 0,492 | 0,555 | 0,367 | 0,421 | 0,393 | 0,221 | 0,345 | |
| cac10 | 0,197 | 0,076 | 0,387 | 0,466 | 0,362 | 0,291 | 0,402 | 0,413 | 0,362 | 0,708 | 0,321 | 0,231 | 0,275 | 0,376 | 0,228 | 0,426 | 0,301 | 0,221 | 0,394 | 0,369 | 0,374 | 0,396 | 0,273 | 0,456 | 0,278 | 0,289 | 0,279 | |
| cac11 | 0,149 | 0,097 | 0,344 | 0,351 | 0,456 | 0,431 | 0,385 | 0,509 | 0,42 | 0,708 | 0,388 | 0,382 | 0,392 | 0,576 | 0,262 | 0,536 | 0,506 | 0,325 | 0,522 | 0,561 | 0,558 | 0,453 | 0,333 | 0,52 | 0,404 | 0,337 | 0,413 | |
| cac12 | 0,084 | 0,024 | 0,488 | 0,403 | 0,416 | 0,414 | 0,476 | 0,5 | 0,454 | 0,321 | 0,388 | 0,476 | 0,558 | 0,423 | 0,334 | 0,44 | 0,359 | 0,342 | 0,521 | 0,444 | 0,338 | 0,493 | 0,445 | 0,492 | 0,424 | 0,338 | 0,378 | |
| cac13 | 0,146 | 0,276 | 0,493 | 0,453 | 0,434 | 0,476 | 0,455 | 0,527 | 0,448 | 0,231 | 0,382 | 0,476 | 0,657 | 0,416 | 0,472 | 0,455 | 0,375 | 0,501 | 0,529 | 0,572 | 0,428 | 0,369 | 0,464 | 0,506 | 0,58 | 0,436 | 0,408 | |
| cac14 | 0,045 | 0,064 | 0,405 | 0,331 | 0,389 | 0,458 | 0,343 | 0,512 | 0,341 | 0,275 | 0,392 | 0,558 | 0,657 | 0,448 | 0,418 | 0,424 | 0,423 | 0,365 | 0,498 | 0,389 | 0,387 | 0,307 | 0,511 | 0,451 | 0,494 | 0,519 | 0,393 | |
| cac15 | 0,133 | 0,118 | 0,399 | 0,499 | 0,391 | 0,524 | 0,399 | 0,53 | 0,376 | 0,376 | 0,576 | 0,423 | 0,416 | 0,448 | 0,544 | 0,572 | 0,398 | 0,511 | 0,516 | 0,531 | 0,519 | 0,426 | 0,451 | 0,492 | 0,523 | 0,352 | 0,445 | |
| cac16 | 0,158 | 0,208 | 0,513 | 0,569 | 0,31 | 0,368 | 0,352 | 0,343 | 0,271 | 0,228 | 0,262 | 0,334 | 0,472 | 0,418 | 0,544 | 0,461 | 0,145 | 0,412 | 0,354 | 0,446 | 0,462 | 0,307 | 0,372 | 0,407 | 0,417 | 0,416 | 0,592 | |
| cac17 | 0,161 | 0,267 | 0,554 | 0,507 | 0,57 | 0,614 | 0,422 | 0,42 | 0,498 | 0,426 | 0,536 | 0,44 | 0,455 | 0,424 | 0,572 | 0,461 | 0,423 | 0,538 | 0,527 | 0,542 | 0,556 | 0,371 | 0,454 | 0,515 | 0,378 | 0,361 | 0,521 | |
| cac18 | -0,03 | 0,112 | 0,218 | 0,258 | 0,324 | 0,427 | 0,295 | 0,44 | 0,299 | 0,301 | 0,506 | 0,359 | 0,375 | 0,423 | 0,398 | 0,145 | 0,423 | 0,268 | 0,433 | 0,38 | 0,446 | 0,259 | 0,5 | 0,541 | 0,337 | 0,415 | 0,271 | |
| cac19 | 0,179 | 0,175 | 0,423 | 0,448 | 0,527 | 0,512 | 0,452 | 0,562 | 0,393 | 0,221 | 0,325 | 0,342 | 0,501 | 0,365 | 0,511 | 0,412 | 0,538 | 0,268 | 0,669 | 0,578 | 0,526 | 0,384 | 0,448 | 0,419 | 0,441 | 0,381 | 0,39 | |
| cac20 | 0,018 | 0,157 | 0,471 | 0,407 | 0,581 | 0,603 | 0,485 | 0,617 | 0,539 | 0,394 | 0,522 | 0,521 | 0,529 | 0,498 | 0,516 | 0,354 | 0,527 | 0,433 | 0,669 | 0,692 | 0,582 | 0,545 | 0,502 | 0,52 | 0,475 | 0,366 | 0,5 | |
| cac21 | 0,074 | 0,273 | 0,564 | 0,576 | 0,534 | 0,499 | 0,518 | 0,605 | 0,468 | 0,369 | 0,561 | 0,444 | 0,572 | 0,389 | 0,531 | 0,446 | 0,542 | 0,38 | 0,578 | 0,692 | 0,662 | 0,496 | 0,52 | 0,53 | 0,548 | 0,383 | 0,548 | |
| cac22 | 0,096 | 0,12 | 0,436 | 0,455 | 0,579 | 0,537 | 0,539 | 0,463 | 0,492 | 0,374 | 0,558 | 0,338 | 0,428 | 0,387 | 0,519 | 0,462 | 0,556 | 0,446 | 0,526 | 0,582 | 0,662 | 0,611 | 0,482 | 0,533 | 0,566 | 0,541 | 0,561 | |
| cac23 | 0,035 | -0,002 | 0,438 | 0,352 | 0,415 | 0,449 | 0,604 | 0,46 | 0,555 | 0,396 | 0,453 | 0,493 | 0,369 | 0,307 | 0,426 | 0,307 | 0,371 | 0,259 | 0,384 | 0,545 | 0,496 | 0,611 | 0,388 | 0,456 | 0,399 | 0,371 | 0,37 | |
| cac24 | 0,088 | 0,16 | 0,381 | 0,327 | 0,356 | 0,453 | 0,477 | 0,457 | 0,367 | 0,273 | 0,333 | 0,445 | 0,464 | 0,511 | 0,451 | 0,372 | 0,454 | 0,5 | 0,448 | 0,502 | 0,52 | 0,482 | 0,388 | 0,731 | 0,438 | 0,5 | 0,505 | |
| cac25 | 0,09 | 0,048 | 0,369 | 0,399 | 0,475 | 0,558 | 0,56 | 0,472 | 0,421 | 0,456 | 0,52 | 0,492 | 0,506 | 0,451 | 0,492 | 0,407 | 0,515 | 0,541 | 0,419 | 0,52 | 0,53 | 0,533 | 0,456 | 0,731 | 0,55 | 0,545 | 0,656 | |
| cac26 | 0,039 | 0,076 | 0,329 | 0,412 | 0,38 | 0,396 | 0,421 | 0,393 | 0,393 | 0,278 | 0,404 | 0,424 | 0,58 | 0,494 | 0,523 | 0,417 | 0,378 | 0,337 | 0,441 | 0,475 | 0,548 | 0,566 | 0,399 | 0,438 | 0,55 | 0,63 | 0,55 | |
| cac27 | 0,025 | 0,107 | 0,233 | 0,256 | 0,315 | 0,451 | 0,373 | 0,455 | 0,221 | 0,289 | 0,337 | 0,338 | 0,436 | 0,519 | 0,352 | 0,416 | 0,361 | 0,415 | 0,381 | 0,366 | 0,383 | 0,541 | 0,371 | 0,5 | 0,545 | 0,63 | 0,515 | |
| cac28 | 0,072 | 0,085 | 0,398 | 0,343 | 0,477 | 0,527 | 0,421 | 0,353 | 0,345 | 0,279 | 0,413 | 0,378 | 0,408 | 0,393 | 0,445 | 0,592 | 0,521 | 0,271 | 0,39 | 0,5 | 0,548 | 0,561 | 0,37 | 0,505 | 0,656 | 0,55 | 0,515 |
Source: Authors’ own elaboration.
4.2. Explore
The result of the Bartlett test contrasts the hypothesis that the correlation matrix is the same (null hypothesis) or different (alternative hypothesis) from an identity matrix. The test yields a p value < 0.05 (0.000; chi.square = 1888.690, degrees of freedom = 378), so the null hypothesis is rejected. The Kaiser-Meyer-Olkin (KMO) test provides a measure of the proportion of global and individual variance that is possibly due to one or more latent factors. Values less than 0.5 are usually considered unacceptable, which is why cac1 is excluded. Table 7 details the KMO coefficients for each item.
Table 7 KMO coefficients of the items
| Global score: 0.872 | |||
|---|---|---|---|
| Item | KMO | Item | KMO |
| cac1 | 0.475 | cac15 | 0.865 |
| cac2 | 0.548 | cac16 | 0.83 |
| cac3 | 0.859 | cac17 | 0.93 |
| cac4 | 0.765 | cac18 | 0.891 |
| cac5 | 0.943 | cac19 | 0.882 |
| cac6 | 0.884 | cac20 | 0.888 |
| cac7 | 0.856 | cac21 | 0.924 |
| cac8 | 0.902 | cac22 | 0.912 |
| cac9 | 0.934 | cac23 | 0.913 |
| cac10 | 0.748 | cac24 | 0.874 |
| cac11 | 0.839 | cac25 | 0.893 |
| cac12 | 0.924 | cac26 | 0.857 |
| cac13 | 0.905 | cac27 | 0.843 |
| cac14 | 0.87 | cac28 | 0.879 |
Source: Authors’ own elaboration.
As Table 7 shows, the overall suitability value is 0.872 with individual values ranging from 0.548 (cac2) to 0.943 (cac5). These results justify proceeding with exploratory factor analysis to uncover potential association patterns.
According to the Kaiser criterion (eigenvalues greater than 1) and Horn’s parallel analysis (corrected eigenvalues greater than 1), 6 and 1 factor(s) should be considered, respectively. Table 8 presents the criteria used to select the number of factors.
Table 8 Criteria for factors selection
| Corrected eigenvalues | Eigenvalues | Bias |
|---|---|---|
| 11,217 | 12,349 | 1,132 |
| 0,834 | 1,782 | 0,948 |
| 0,64 | 1,452 | 0,812 |
| 0,559 | 1,255 | 0,696 |
| 0,542 | 1,138 | 0,596 |
| 0,578 | 1,081 | 0,503 |
| 0,576 | 0,995 | 0,418 |
Source: Authors’ own elaboration.
As Table 8 shows, based on Horn’s parallel analysis, a single-factor model is suggested (a single eigenvalue greater than 1). Likewise, under the Kaiser criterion it is suggested to have 6 factors (6 eigenvalues greater than 1).
The items from the single-factor model are presented in Table 9, in the supplemental material. The items and their respective factor loadings (correlation between the item scores and the respective factor) are presented there.
Table 9 One-factor model
| Item | Description | F1 |
|---|---|---|
| cac3 | … of competitors in customer-related matters | 0,661 |
| cac4 | … competitors in customer-related matters | 0,638 |
| cac5 | …to implement based on customer-related data analysis | 0,678 |
| cac6 | … service personalization strategies based on results obtained from customer data analysis | 0,729 |
| cac7 | …relationship strategies, supported by the analysis of social network data | 0,685 |
| cac8 | …most influence customer commitment to the brand, with the support of data analysis methods | 0,715 |
| cac9 | … digital performance metrics on the website or social networks | 0,628 |
| cac10 | … transaction data to identify the best customers for the company | 0,526 |
| cac11 | … retention level from data analysis | 0,658 |
| cac12 | … quality based on comments published on social networks | 0,635 |
| cac13 | … psychological variables of consumers to complement customer segmentation criteria | 0,691 |
| cac14 | … understand customer purchasing behavior | 0,635 |
| cac15 | … purchasing behavior based on historical data analysis. | 0,696 |
| cac16 | … company market share | 0,583 |
| cac17 | … reconfigure the value offer based on results derived from customer data analysis | 0,724 |
| cac18 | …customer retention supported by evidence derived from data analysis | 0,539 |
| cac19 | … of new products/services before, during, and after they are launched on the market | 0,666 |
| cac20 | … marketing campaigns on company performance, based on data analysis | 0,775 |
| cac21 | … marketing mixes (pricing, promotion, placement, product) considering customer data analysis | 0,783 |
| cac22 | … acquisition strategies supported by data analysis methods | 0,759 |
| cac23 | …performance with support in data analysis methods | 0,638 |
| cac24 | … at all touchpoints with the customer, with the help of data analysis methods | 0,666 |
| cac25 | … of loyalty strategies, based on evidence derived from data analysis | 0,752 |
| cac26 | …promotion of products/services based on customer geolocation data | 0,666 |
| cac27 | … from the segmentation analysis of current or potential customers. | 0,594 |
| cac28 | … cross-selling strategies (exploitation of complementary products) based on data on customer consumption patterns | 0,669 |
| Varianza explicada | 45.1 % | |
| Varianza explicada acum. | 45.1 % | |
Source: Authors’ own elaboration.
The one-factor model is composed of 26 items. Although the accumulated variance explained by this single factor is less than 50%, it will continue to be considered to verify the relevance of item refinement actions and compliance with the confirmatory criteria of psychometric quality.
The six-factor model contains two items with a factor loading of less than 0.45 (cac1 and cac2), so they are excluded. By excluding them, the model becomes one of five factors. The items and their respective factor loadings are presented in Table 10.
Table 10 Five-factors model
| ítem | Descripción | F1 | F2 | F3 | F4 | F5 |
|---|---|---|---|---|---|---|
| cac3 | … of competitors in customer-related matters | 0,778 | ||||
| cac4 | … competitors in customer-related matters | 0,827 | ||||
| cac5 | … to implement based on customer-related data analysis | 0,583 | ||||
| cac6 | … service personalization strategies based on results obtained from customer data analysis | 0,546 | ||||
| cac17 | … reconfigure the value offer based on results derived from customer data analysis | 0,524 | ||||
| cac19 | … of new products/services before, during, and after they are launched on the market | 0,621 | ||||
| cac20 | … marketing campaigns on company performance, based on data analysis | 0,644 | ||||
| cac21 | … marketing mixes (pricing, promotion, placement, product) considering customer data analysis | 0,51 | ||||
| cac7 | …relationship strategies, supported by the analysis of social network data | 0,669 | ||||
| cac9 | … digital performance metrics on the website or social networks | 0,582 | ||||
| cac23 | …performance with support in data analysis methods | 0,59 | ||||
| cac10 | … transaction data to identify the best customers for the company | 0,759 | ||||
| cac11 | … retention level from data analysis | 0,748 | ||||
| cac13 | … psychological variables of consumers to complement customer segmentation criteria | 0,461 | ||||
| cac22 | … acquisition strategies supported by data analysis methods | 0,461 | ||||
| cac24 | … at all touchpoints with the customer, with the help of data analysis methods | 0,612 | ||||
| cac25 | … of loyalty strategies, based on evidence derived from data analysis | 0,695 | ||||
| cac26 | …promotion of products/services based on customer geolocation data | 0,668 | ||||
| cac27 | … from the segmentation analysis of current or potential customers. | 0,72 | ||||
| cac28 | … cross-selling strategies (exploitation of complementary products) based on data on customer consumption patterns | 0,596 | ||||
| Explained variance | 17.9 % | 15.4 % | 10.5 % | 10.2 % | 9 % | |
| Cumulative explained variance | 17.9 % | 33.3 % | 43.8 % | 54 % | 63 % |
Source: Authors’ own elaboration.
The five-factor model comprises 20 items in total and accounts for 63% of the total variance of the data.
4.3. Confirm
The results of the initial confirmatory factor analysis are presented in Table 11. Two structures were examined: one factor (M1) and five factors (M2).
Table 11 Initial confirmatory factor analysis
| Initial models | Items | n.obs | p-value | chi-sq | df | chisq/df | RMSEA | SRMR | CFI | TLI |
|---|---|---|---|---|---|---|---|---|---|---|
| M1 (one factor) | 26 | 101 | 0.00 | 713 | 299 | 2,386 | 0.118 | 0.074 | 0.751 | 0.73 |
| M2 (five factors) | twenty | 101 | 0.00 | 274,905 | 160 | 1,718 | 0.085 | 0.06 | 0.907 | 0.89 |
Source: Authors’ own elaboration.
With regard to Table 11, although neither of the two models meet the plausibility conditions in this initial test, a refinement is carried out considering items with confirmatory factor loadings below 0.7, as well as the analysis of modification indices. The plausibility conditions to be met are: RMSEA < 0.06, SRMR < 0.08, CFI and TLI > 0.95, Chisq/df < 2, AVE > 0.5, Fiab.Comp >= 0.7.
Following this refinement, Model M1 (one factor) remains with 14 items that satisfy the goodness-of-fit indicators, convergent validity, and composite reliability, while Model M2 (five factors) remains with 15 items but the criterion for discriminant validity between two of the factors is not met, despite satisfactory goodness-of-fit indices. Given this, starting from model M2, a third model (M2A) is generated, which includes the fusion of the two factors that did not pass the discriminant validity test. After a new refinement process like the one described, the model ends up with 10 items and achieves discriminant validity and fit.
Table 12 shows the comparative summary of the fit metrics, discriminant validity, and composite reliability of the three resulting models.
Table 12 Summary of refined models
| Models | M1 (one factor) | M2 (five factors) | M2A (three factors) | |
|---|---|---|---|---|
| Indicators | Items | 14 | 15 | 10 |
| chi-sq | 130,602 | 125,118 | 51,486 | |
| df | 77 | 80 | 32 | |
| chi-sq/df | 1,696 | 1,564 | 1,609 | |
| Fit indicators | RMSEA | 0.083 | 0.075 | 0.078 |
| SRMR | 0.054 | 0.05 | 0.053 | |
| CFI | 0.932 | 0.949 | 0.964 | |
| TLI | 0.92 | 0.933 | 0.949 | |
| Conv./discr. validity and composite reliab. | Val. convergent | 0.516 | F1:0.577, F2:0.655, F3: 0.82, F4: 0.584, F5:0.729 | F1: 0.655, F2: 0.578, F3: 0.734 |
| Val. discriminating | NA | No: between F1 and F4, Yes: F2, F3, F5 | Yes: F1, F2 and F3 | |
| Composite Reliab. | 0.937 | F1: 0.872, F2: 0.849, F3: 0.901, F4: 0.808, F5: 0.841 | F1: 0.849, F2: 0.872, F3: 0.844 |
Source: Authors’ own elaboration on the results from the refinement process.
According to Table 12, models M1 and M2A satisfy the minimum criteria for model fit, validity, and reliability. Figures 2-3 show the two plausible models (M1 and M2A) to represent CAC. It should be noted that the factors labeled in M1 and M2A, despite being named in the same way (F1, F2, F3), represent different constructs after undergoing the aforementioned refinement process. The complete items of both scales (M1 and M2A) can be seen in Appendix 1 and 2.
Figure 2 displays model M1, unidimensionally, composed of 14 items. It is observed that all items exhibit high loadings close to or greater than 0.7. This CAC scale has an average variance extracted (AVE = 0.516) greater than 0.5 and a composite reliability greater than 0.7 (0.937).
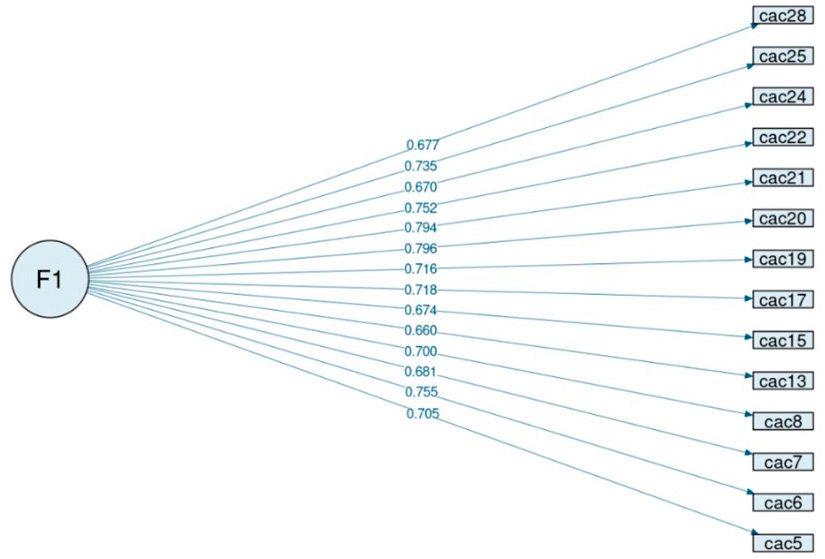
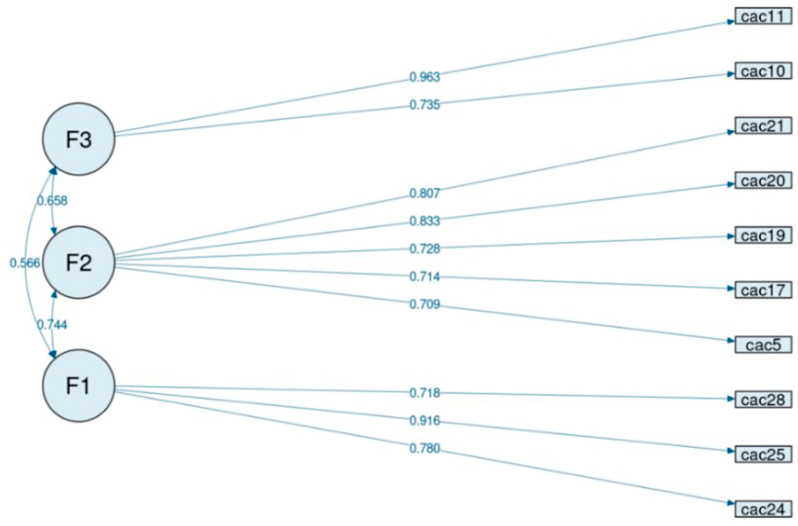
Figure 3 presents the M2A model, made up of three factors and 10 items. It is observed that all items exhibit high loadings (greater than 0.7). This CAC scale presents an average variance extracted (AVE = F1: 0.655; F2: 0.578; F3: 0.734) greater than 0.5 and a composite reliability (0.855) greater than 0.7. Furthermore, the overall Cronbach’s alpha for the final factors (F1, F2, and F3) was 0.866, 0.835, and 0.829, respectively.
The M1 model is useful for measuring CAC globally and parsimoniously, which is valuable when one wants to measure the most representative latent trait behind the existence of these capabilities in organizations, without delving into specific subtopics that compose them. The M2A Model is useful when the organization wants to explore in more depth the dimensions that constitute them and into the specific ways to materialize them. The interpretation of the tridimensional model is further elaborated below.
The M2A model suggests that CACs in organizations have three underlying dimensions (factors):
Factor 1 (F1): Customer maintenance analytics capability. This is manifested through the practices of evaluating the customer experience across all touchpoints through data analysis, assessing the performance of loyalty strategies derived from data analysis, and designing cross-selling strategies based on customer consumption patterns. These manifestations can be interpreted as a set of routines that occur after the sale, when the customer has already established a commercial relationship with the organization and it aims to evaluate their purchasing experience, retain them for future returns, and attempt to sell complementary products or services to those already acquired. This front aims to generate outcomes that the customer will eventually perceive directly.
Factor 2 (F2): Customer acquisition analytics capability. This is manifested through practices of evaluating different marketing mixes considering customer data, monitoring the impact of marketing campaigns based on data, evaluating the performance of new products or services in the market, reconfiguring the value offer based on customer data analysis results and defining commercial strategies derived from customer-related data analysis. These manifestations can be interpreted as a set of routines that the organization develops prior to the sale, when it is attempting to capture customers with new value offers, new commercial strategies, campaigns with appropriate mixes of pricing, promotions, placements, and products.
Factor 3 (F3): Customer economic evaluation analytics capability. This is manifested through the identification of the organization’s best customers based on commercial transactions and through the evaluation of customer retention levels through data analysis. These manifestations can be interpreted as the organizational routines conducted to measure the economic contribution of customers and their value to the organization. Unlike the first front, this one does not seek to generate results that can be perceived directly by customers, but rather by the organization, in order to adjust its strategy in pursuit of profitability.
Next, confirmatory factor analysis is conducted on the models, incorporating control variables to verify the equity of the scale. In this case, three control factors are considered: the position of the person answering the survey; the area to which the person answering the survey belongs (marketing or analytics); and infrastructure for analytics. The variable “position” has three response levels: marketing/analytics analyst; marketing/analytics head or coordinator; and marketing/analytics director or manager. The variable “area” has two levels of response: marketing; and analytics. The variable “infrastructure for analytics” is a binary variable that summarizes the rating given by the respondents on the level of maturity that the organization has for carrying out analytics activities at the level of human effort (manual, semi-automatic, and automatic), tools used (spreadsheet, licensed software and free software), processing capacity (individual computer, computer network and cloud), and analysis methods used (statistical description, association between pairs of variables, association between more than two variables or multivariate).
Tables 13 and 14 present the confidence intervals based on bootstrapping (resampling technique) with 2000 replications with the aforementioned control variables, to verify the equity of the scales.
The absence of significance among the control variables for any of the factors, in both scales, as depicted in Tables 13 and 14, implies that organizational factors are not prioritized by the scales. In other words, the proposed measurement models for CAC enable robust scores of CAC to be generated regardless of (a) factors such as the area or position of the individuals responding to the instrument, and (b) the maturity levels of the analytical infrastructure available to the organization of the respondent.
Table 13 Equity results of the three-dimensional scale incorporating organizational factors based on resampling with 2000 replications
| left side | relationship | right side | estim | err.est | lowlim | uplimit | stand | result |
|---|---|---|---|---|---|---|---|---|
| area | → | F1 | 0,069 | 0,279 | -0,457 | 0,662 | 0,03 | No.Signif |
| position | → | F1 | -0,13 | 0,141 | -0,411 | 0,162 | -0,095 | No.Signif |
| Inf.analit. | → | F1 | 0,346 | 0,244 | -0,116 | 0,853 | 0,17 | No.Signif |
| area | → | F2 | 0,173 | 0,291 | -0,349 | 0,771 | 0,077 | No.Signif |
| position | → | F2 | 0,034 | 0,149 | -0,241 | 0,34 | 0,025 | No.Signif |
| Inf.analit. | → | F2 | 0,161 | 0,243 | -0,318 | 0,625 | 0,08 | No.Signif |
| area | → | F3 | -0,176 | 0,242 | -0,633 | 0,301 | -0,078 | No.Signif |
| position | → | F3 | 0,08 | 0,147 | -0,201 | 0,37 | 0,059 | No.Signif |
| Inf.analit. | → | F3 | 0,179 | 0,242 | -0,259 | 0,673 | 0,089 | No.Signif |
Source: Authors’ own elaboration.
Table 14 Equity results of the unidimensional scale incorporating organizational factors based on resampling with 2000 replications
| left side | relationship | right side | estim | err.est | lowlim | uplim | stand | result |
|---|---|---|---|---|---|---|---|---|
| area | → | F1 | 0,084 | 0,268 | -0,409 | 0,66 | 0,038 | No.Signif |
| cat_cargo2 | → | F1 | 0,036 | 0,133 | -0,226 | 0,296 | 0,027 | No.Signif |
| Inf.analit.bin | → | F1 | 0,236 | 0,235 | -0,205 | 0,712 | 0,117 | No.Signif |
Source: Authors’ own elaboration.
5. Discussion
This work has allowed the identification and proposal of two measurement models of CAC. One is unidimensional, and the other is tridimensional. The aspects covered in the three-dimensional scale (M2A) have been individually acknowledged by other authors as matters of strategic significance. For example, for Carbone and Haeckel (1994) and Pine and Gilmore (1998), customer experience (central issue of item cac24, F1) is a strategic issue that achieves differentiation and sustained competitive advantage. Hanaysha et al. (2021) refer to the design of marketing tactics based on customer understanding (core issue of cac21, F2) as a key element to deliver customer value better than competitors. Madhavan et al. (1994) refer to customer retention (the focus of item 11, F3) as a way to exert indirect control over potential competitors by keeping them out of a particular market. This demonstrates that CAC, as proposed in the developed scale, has a scope that allows them to impact organizational strategy by reconfiguring marketing operational routines and related domains.
Other authors have proposed alternative measurement models of CAC. Hossain et al. (2020b) contribute four dimensions: customer analytics management capability (ability to plan customer analytics); customer analytics technological capability (ability to connect various customer-related data sources); customer analytics staff expertise capability (ability to use the necessary technical elements to process customer data); and the capability to model the 4Ps of marketing (ability to incorporate data into marketing mix allocation). The administrative factors of CAC considered in this scale do not find common ground with the factors contained in the scale developed in this study. However, similarities are observed between the factor related to the capability to model the 4Ps of marketing and the factor in the scale presented in this study related to the capability of analytics for customer acquisition.
In the context of retail, the same authors (Hossain et al., 2020a propose three formative dimensions of CAC, namely the ability to create, deliver, and manage value. Some of the manifestations of these dimensions that are most related to the scale presented in this study include: the capability to offer value; personalization capability; distribution capability (delivering value through different channels); and communication capability through different channels. These manifestations are related to the items contained in the factor related to the analytical capability for customer acquisition and tangentially with the factor related to the analytical capability for customer maintenance. The conception of CAC as a formative and non-reflective construct is an important difference with the present study.
Louro et al. (2019) propose that CAC consists of three dimensions: customer information quality; team expertise; and customer knowledge absorption. The latter relates to the ability to capture data in order to understand the market and is the one that is most closely related to the factor related to analyzing pre-sale or sale-concluding data related to the customer.
It can be seen that the developed scale shares a common issue with other scales - the analysis of data on pre-sale events (customer acquisition analytics capability); but it is broader in scope by encompassing manifestations related to data analysis after the sale (customer maintenance analytics capability) and the overall value contribution from customers (customer economic evaluation analytics capability). At the same time, it excludes issues that other authors include, such as customer data management, personnel structure, and technological infrastructure, which may not necessarily be compatible with the vision of CAC as an organizational routine. The study of these factors could be a part of future research, as well as the incorporation of other constructs that allow for understanding the mechanism of generating competitive advantages from CAC.
The existence of a factor with only two items (customer economic evaluation analytics capability) in the scale proposed in the M2A model is justified by three aspects:
a) Although, from a methodological point of view, at least three items per factor are desirable, scientific literature has also proposed scales with reasonable quality that consist of at least one factor with 2 items. Such is the case of in Nicholas et al. (2015), Hinkin (1995) and Hays et al. (2017), which highlight the parsimony in the composition of their models.
b) The two items of the factor “customer economic evaluation analytics capability” represent two fundamental facets of it. One is the identification of the best customers for the company through data analysis, while the other is the evaluation of customer retention through data analysis. In relation to the first, works such as Hallikainen et al. (2020) point it out as a key empirical manifestation of the factor in question. The second one is described by Hallikainen (2020) and Cao and Tian (2020) as a routine that contributes to the essence of the factor found. Likewise, a basic definition of economic evaluation (“economic evaluation is responsible for comparing the costs and consequences of two or more interventions”, Fox-Rushby and Cairns, 2005) interpreted in the context of customers makes it feasible to consider the two items in question as being relevant empirical manifestations of the construct of interest. In summary, the fact that the factor has two items is not only consistent with other valid and reliable works in the scientific literature, but also provides relevant elements on the theoretical content of the construct.
c) In addition to previous works with factors consisting of only 2 items with theoretical rationale, the reliability metric (Cronbach’s alpha) in the current study (0.829) meets the minimum permissible threshold (>0.7). Similarly, convergent validity, as indicated by the AVE (0.655), also surpassed the minimum threshold for acceptance (>0.5). Despite these strengths of the factor under consideration, the present study acknowledges that future research could enrich the factor with other possible empirical manifestations. Therefore, this declaration is explicitly stated in the limitations section.
The unidimensional model M1 addresses more manifestations (items) than the M2A model, but includes all those of M2A, except the two that make up the “customer economic evaluation analytics capability” factor. This indicates that the underlying attribute in the unidimensional model captures the essence of the factors “customer acquisition analytics capability” and “customer maintenance analytics capability” of the M2A model, which is logical considering that these can summarize most of the organization’s interactions with the customer.
6. Conclusions and future studies
Regarding the research question that guided this study, it was possible to identify a main model that allows for the empirical measurement of CAC in the organizational context, meeting criteria for fit, validity, reliability, and fairness. The developed model consists of three factors: customer acquisition analytics capability; customer maintenance analytics capability; and customer economic evaluation analytics capability. This factorial composition represents the essence of the issues that organizations must address to operationalize CAC and, through them, reconfigure marketing operational routines and other related business domains, aiming to achieve competitive advantages.
The customer acquisition analytics capability is empirically manifested through five practices in organizations: examining different marketing mixes (pricing, promotion, placement, product) considering customer data analysis; monitoring the impact of marketing campaigns on company performance based on data analysis; evaluating the market performance of new products/services before, during, and after their launch on the market; making decisions about how to reconfigure the value offer based on results derived from customer data analysis; and defining commercial strategies to implement based on customer-related data analysis.
The customer maintenance analytics capability has three manifestations: evaluating customer experience at all touchpoints with the help of data analysis methods; assessing the performance of loyalty strategies based on evidence derived from data analysis; and designing cross-selling strategies (exploitation of complementary products) based on customer consumption pattern data.
The customer economic evaluation analytics capability is manifested through the practices of analyzing transactional data to identify the best customers for the company; and examining the level of customer retention based on data analysis.
In addition to the three-dimensional model, a unidimensional model is also provided, which meets the criteria of fit, validity, reliability, and equity. This model is useful when entrepreneurs or scholars aim to capture the essential trait of CAC without delving into the dimensions that compose it. This trait combines capabilities to capture and retain customers within the organization.
The developed scales allow researchers to capture reliable and valid data on CAC in a more efficient way. Furthermore, by being able to measure the construct, researchers will be able to relate CAC to other constructs, such as organizational performance, in future studies. Likewise, it enables business owners to make organizational diagnoses on CAC and provides a basis for configuring or reconfiguring analytics departments by proposing an agenda of content to be addressed by them.
7. Limitations
The fieldwork conducted for the development of the measurement model was limited to Colombian organizations. Future studies are suggested to contrast the results with empirical evidence from other geographical contexts. Additionally, the sample size of respondents was small and not strictly random, as it was selected from a group of professionals with LinkedIn profiles who responded to invitations. Furthermore, while the existence of a factor with two items in the proposed scale was argued, this fact constitutes an opportunity for future research to incorporate new empirical manifestations into this factor.

