


 English (pdf)
 Article in xml format
 Article references
 Send this article by e-mail
 Cited by SciELO
  Cited by Google
  Similars in
SciELO
Similars in
SciELO  Similars in Google
 Permalink
1. Introduction
Many large Mexican companies originated from small family businesses, which gradually evolved and expanded under a corporate governance framework led by members of the founding family and often extended to include in-laws, close relatives or friends. Financing decisions, strategic planning, and overall company development have typically been overseen by an annual meeting of shareholders and a board of directors primarily composed of family members. Over the years, the corporate governance model has evolved from its original form, where family members hold either all or a significant majority of company shares, to the present scenario, where family members maintain only a majority stake in the company. Despite transitioning to public companies, families have retained control, making it challenging for individual and common shareholders to exert influence and participate in decision-making processes. This study aims to assess the ongoing validity of this corporate governance model and identify the variables influencing companies’ decisions about issuing shares as a means of financing. For this purpose, a total of 145 companies were analyzed by preparing a single database with data available from 2012 to 2022. The methodology included an exhaustive analysis of the percentages of new shares issued during that period, as well as the application of Pearson’s correlation techniques, simple linear ordinary least squares analysis, binomial logit, and probit models, and the ANOVA model. Statistical tests were applied to determine if there was any relationship between the dependent variable of the number of times shares were issued and the variables of age, sales, or the economic sector of the companies. The results revealed a very incipient possible inverse relationship between a company’s decision to issue new shares according to its age, sales level, or sector.
2. Literature Review
Several studies have analyzed the relationship between issuing shares and several external and internal factors at companies listed on stock exchanges. Our research focuses on three internal variables that can explain the shareholding model: sales (as a variable to classify companies by size), age, and the economic sector to which a company belongs. In the following sections, several elements of these variables are explained.
2.1. Company Size
The size of a company is a significant variable influencing its capital structure. Some authors have argued that larger companies have fewer restrictions on access to financing (Titman and Wessels, 1988; Rajan and Zingales, 1995; Schiffer and Weder, 2001; Rao et al., 2018). Several empirical studies have shown a positive relationship between company size and external financing (Rajan and Zingales, 1995; Psillaki and Daskalakis, 2009; Forte et al., 2013; Rao et al., 2018).
Rajan and Zingales (1995) noted that large companies can raise more social capital to finance their operations due to a lower information asymmetry problem, so they acquire less debt. This means that company size is negatively related to the level of indebtedness (Schiffer and Weder, 2001). Nevertheless, companies with higher growth opportunities are more likely to exhaust their internal resources and need additional financing; thus, company growth is expected to have a positive relationship with indebtedness (Rao et al., 2018). In the same vein, Forte et al. (2013) found evidence that size is positively related to the level of indebtedness. Michaelas et al. (1999) noted that small companies avoid external financing and rely more on retained earnings and bank financing because issuing shares could lead to losing control of the founding owners.
2.2. Age of the Company
Yazdanfar and Öhman (2016) indicated that the results concerning the relationship between the age of the company and indebtedness are ambiguous. On the one hand, information asymmetry particularly affects younger companies because they have limited or no credit history. On the other hand, they reported a negative relationship between the company’s age and indebtedness. This is because older companies are more likely to use internal financing sources than younger companies. Similarly, Hall et al. (2004) indicated that age is negatively related to external financing because the older a company is, the more profits it can accumulate; thus, an older firm will require less financing than a younger company. Similarly, La Rocca et al. (2011) reported that small companies have higher levels of indebtedness in their initial years; however, this proportion of debt is reduced in the later stages of their life cycle as companies accumulate profits that they use as a source of financing. In contrast, Rao et al. (2018) showed that it is easier for older companies to obtain funding because they have better creditworthiness and higher credibility in the loan market.
2.3. Company Size and Age
Winker (1996) demonstrated the impact of company size and age on the probability of being rationed in the loan sector. Petersen and Rajan (1994) indicated that the availability of financing from institutions increases with the length of time that the relationship between the company and the financial institution has been in place. However, indebtedness decreases with age but increases with size because young companies tend to receive external financing. Kumar and Rao (2016) contradicted this finding by stating that debt decreases as company size increases and, on the other hand, rises as companies age. According to Michaelas et al. (1999), the positive relationship between size and total debt level indicates that the larger a company is, the greater its indebtedness. Similarly, Guercio et al. (2020) identified a significant positive relationship between company size and diversification of financing sources. Furthermore, according to Briozzo and Vigier (2014), the financial life cycle theory indicates that the size and age of a company influence its likelihood of diversifying its equity structure.
2.4. Economic Sector
Michaelas et al. (1999) noted that the economic sector has a greater effect on the level of indebtedness and debt maturity in smaller companies. Similarly, Mac An Bhaird and Lucey (2014) reported that a company’s financing decisions are influenced by the economic sector. Guercio et al. (2017) noted that service sector companies present greater restrictions on accessing external financing. Conversely, Andrieu et al. (2018) highlighted that manufacturing companies are better positioned to access funds than those operating in the service and commerce sectors. Briozzo and Vigier (2014) observed that the above is because companies in the manufacturing sector have more assets that can serve as loan collateral. In this respect, Cressy and Olofsson (1997) indicated that it is more difficult for the intangible assets of service sector companies to be evaluated by lenders than the tangible assets of manufacturing companies. In contrast, Beck et al. (2005) noted that manufacturing companies face more obstacles in accessing external financing. In contrast, Nizaeva and Coskun (2019) showed that companies in the trade sector are less financially constrained than those in the service and manufacturing sectors.
2.5. Empirical Studies Linked to the Research Hypotheses
In their research, Watkins and Flores (2016) considered a sample of 89 nonfinancial companies that were listed on the Mexican Stock Exchange from 2001 to 2012. They found that nonfinancial companies have a high concentration of ownership in a small group (50% on average). This result did not change significantly when comparing one year’s ownership percentage against the next. An exception was found during the financial crisis of 2008, when the concentration of ownership was greater than that in previous years. They concluded that the ownership concentration variable was somewhat stable during the period analyzed; hence, it can be inferred that most shareholders were reluctant to lose control of their companies. On the other hand, they concluded that the concentration of ownership in companies has a positive relationship with business performance and a negative relationship with the percentage of independent members on the board of directors, the size of the company, and the debt level.
Using a sample of 4,000 companies from Germany, France, Italy, and the United Kingdom, Franks et al. (2012) reported that in countries with strong investor protection and developed financial markets, family businesses increase their number of major shareholders as they age. Furthermore, family control is more concentrated in industries where low investment opportunities, low merger and acquisition activity, and new stock issuances are major challenges to avoid dilution of family ownership. In contrast, family control is very stable over time in countries with weak investor protection and underdeveloped financial markets. Additionally, family control in an industry is not related to investment opportunities, mergers, or acquisitions. Furthermore, company age is positively related with the concentration of ownership because the older the company is, the more difficult it is for the founding partners to reduce their participation in the company. Founding partners believe that a high concentration of ownership allows for the establishment of lasting relationships and is part of the identity and life of the majority shareholders.
Rogers et al. (2008) studied a sample of 176 nonfinancial companies that were listed on the São Paulo Stock Exchange in Brazil and reported that the determining factors of the ownership structure are company size, market instability, and market regulation, with the last factor being the most significant. They inferred that the larger the company is, the more the concentration of ownership tends to decrease. This is because as a company grows, greater investment is needed, which leads to the inclusion of new partners.
Donelli et al. (2013) conducted a study on the determinants of the ownership structure of Chilean nonfinancial companies over 20 years. Among the empirical findings, they discovered that large shareholders control most companies. They also found that blocks of shares held by controlling shareholders are high and constant over time since share issuance is conducted through block operations. Thus, in a year, the block holdings of the controlling shareholders decrease or increase by 6%, or approximately 7%.
In a similar study, Lazarides et al. (2009) analyzed the ownership structure of companies in Greece. They concluded that older companies show lower levels of ownership concentration because, as time passes, companies need to grow and require more investment; thus, companies tend to issue shares, thereby reducing their internal ownership level.
3. Research Method
3.1. Sample
The sample consisted of 145 companies registered on the Mexican Stock Exchange (MSE) that had current and available information from 2012 to 2022. A total of 70.34% of the companies had information for all eleven years, and 20.69% had information for more than half of the period because they entered the stock exchange after 2012, exited the stock exchange before 2022, or had several years of suspension. Finally, 4.14% had no information. The number of listed companies at the end of this study was 118.
3.2. Data Collection Technique and Instrument
The data collection was performed via an EXCEL template, integrating a database with information from the annual audited financial reports for the period of 2012-2022 obtained from the MSE website and some companies’ websites. This includes information related to the term of listing on the MSE, the amount and number of times shares were issued, and the purpose of each issue. The manually obtained data included 1938 qualitative and quantitative observations. There was no public database with access to this type of information, which was one of this study’s first contributions.
3.3. Conceptual and Operational Definitions of the Variables
Table 1 details the conceptual and operational definitions of the variables used in this study.
Table 1 Conceptual and Operational Definitions of the Variables
| Variables | Conceptual Definition | Operational Definition |
|---|---|---|
| Dependent | ||
| Times issued | Number of times the company has issued shares from 2012 to 2022. | Quantitative variable, measured in the number of times the company has issued shares. |
| Independent | ||
| Sector | Main activity of the companies, whether manufacturing, commerce, or services. | Categorical variable, where 1 indicates the manufacturing sector, 2 corresponds to the commerce sector, and 3 to the service sector. |
| Age | Number of years between the commencement of company operations and the year in which this research was conducted. | Quantitative variable calculated by subtracting the year of commencement of company operations from the year in which this research was conducted. |
| Sales | Total annual net sales of the company are in thousands of pesos for 2022. | Quantitative variable measured by annual sales in the thousands of pesos. |
Source: Authors’ own elaboration.
3.4. Procedure and Data Analysis
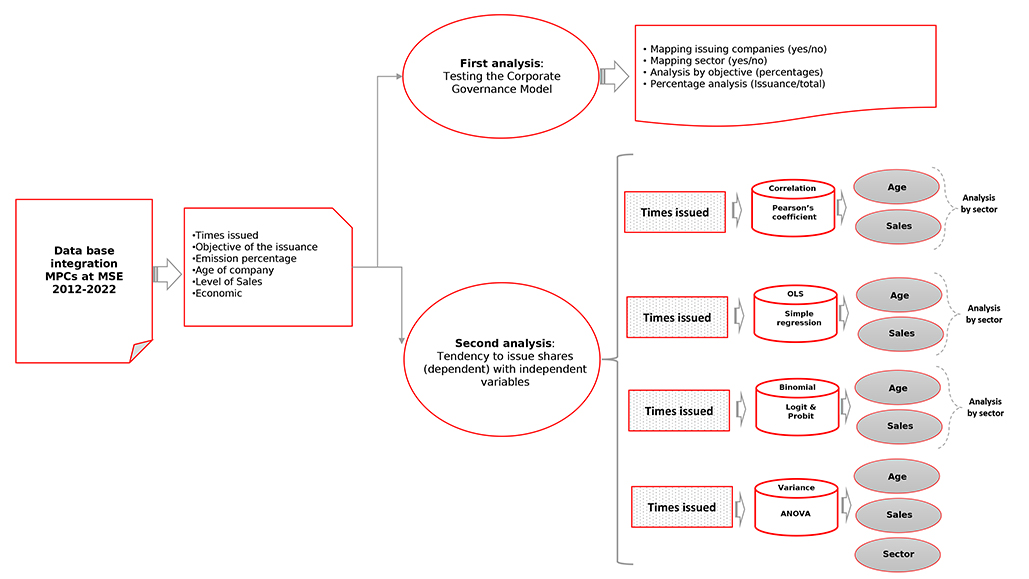
Data analysis was performed via the Statistical Package for Social Science (SPSS), GRETL, and EXCEL. Figure 1 shows the analysis procedure followed in this study. First, the population of Mexican public companies (MPCs) and their share issuance were analyzed descriptively through segregation by sector, purpose of issuance, and percentage issued. The aim was to assess the validity of the corporate governance model of Mexican companies. A correlation analysis was subsequently performed via Pearson’s coefficient for the dependent variable of times issued and the variables of age and sales, disaggregating the same information by sector. Then, an ordinary least squares (OLS) analysis was performed to determine the possible linear regression of the variables described. Next, binomial (either issued or did not issue shares) logit and probit models were run on the same variables that fit the parametric techniques. Finally, inferential statistical analysis was performed via one-factor ANOVA to determine whether the mean number of times shares were issued differed significantly between the groups of companies analyzed by economic sector, age, and sales (Walpole et al., 2012).
3.5. Research Objective and Hypothesis
The objective of this study was to determine whether the Mexican business model of corporate governance based on share ownership by family or affinity groups continues to influence companies not to issue new shares as a form of financing. We also sought to identify whether there were differences in the decision to issue new shares by groups of companies analyzed by economic sector, age, and sales.
In this context, the hypotheses of this study are as follows:
Corporate Governance:
H1: Mexican public companies issue shares as a significant form of financing.
Age:
H1: There is a statistically significant relationship between age and share issuance in MPCs.
Level of Sales:
H1: There is a statistically significant relationship between the level of sales and the issuance of shares in MPCs.
Economic Sector:
H1: There is a statistically significant relationship between MPCs in the economic sector and their issuance of shares.
3.6. Research Design
Because of its characteristics, this research adopts a quantitative approach with a correlational scope to determine the degree of the relationship between the independent variables and the dependent variable. The research design is nonexperimental and transient (Hernández-Sampieri and Mendoza, 2018).
4. Results
4.1. Descriptive Statistics
Table 2 presents the basic statistical analyses of the study variables. Notably, the average number of times companies issued shares was 0.74, while the maximum was 5, and the variation among companies was significant, with a standard deviation of 1.3 times the number of issuances. The average age of the companies is 38.09 years, but the variability of the ages is considerable, ranging from 2 to 122 years, with a standard deviation of 23.89 years.
Table 2 Summary of Basic Descriptive Statistics of the Variables
| Variable | N | Minimum | Maximum | Mean | Standard Deviation |
|---|---|---|---|---|---|
| Times issued | 136 | 0 | 5 | 0.74 | 1.300 |
| Sector | 145 | 1 | 3 | 1.97 | 0.953 |
| Age | 145 | 2 | 122 | 38.09 | 23.895 |
| Sales* | 127 | 316,405 | 1,118,823,639 | 83,098,307 | 173,888,550 |
Note: *Total annual net sales in thousands of pesos.
Source: Author´s own elaboration
4.2. Testing the corporate governance model on the number of times shares were issued
Table 3 shows that nine companies did not have information because they were suspended or lacked the relevant information, resulting in a total census of 136 companies. In the population studied, we found that 66.2% (90 units) of MPCs listed on the BMV did not issue shares even once. However, the remaining 33.82% (46 units) of the companies issued shares between one and five times.
Table 3 Frequency Distribution of the Number of Times Companies Issued Shares
| Times Issued | Frequency | Percentage | Valid Percentage | Accumulated Percentage | |
|---|---|---|---|---|---|
| Valid | 0 | 90 | 62.1 | 66.2 | 66.2 |
| 1 | 19 | 13.1 | 14.0 | 80.1 | |
| 2 | 12 | 8.3 | 8.8 | 89.0 | |
| 3 | 7 | 4.8 | 5.1 | 94.1 | |
| 4 | 3 | 2.1 | 2.2 | 96.3 | |
| 5 | 5 | 3.4 | 3.7 | 100.0 | |
| Total | 136 | 93.8 | 100.0 | ||
| Missing | Not available | 9 | 6.2 | ||
| Total | 145 | 100.0 | |||
Source: Author´s own elaboration.
Table 4 shows the breakdown of companies that issued shares and those that did not by sector. We see little variation in the percentage of MPCs that issued new shares in the manufacturing (34.43%) and service (37.10%) sectors, unlike in the commerce sector, where a clear tendency is identified for the number of them to be lower in terms of those issuing new shares (15.38%).
Table 4 Percentage of MPCs that Issued New Shares and Those that did not (2012-2022)
| Sector | Total Companies | Issuance Frequency | Issuance Percentage | No Issuance Frequency | No Issuance Percentage |
|---|---|---|---|---|---|
| Manufacturing | 61 | 21 | 34.43 | 40 | 65.57 |
| Commerce | 13 | 2 | 15.38 | 11 | 84.62 |
| Services | 62 | 23 | 37.10 | 39 | 62.90 |
| Total | 136 | 46 | 33.82 | 90 | 66.18 |
Source: Author´s own elaboration.
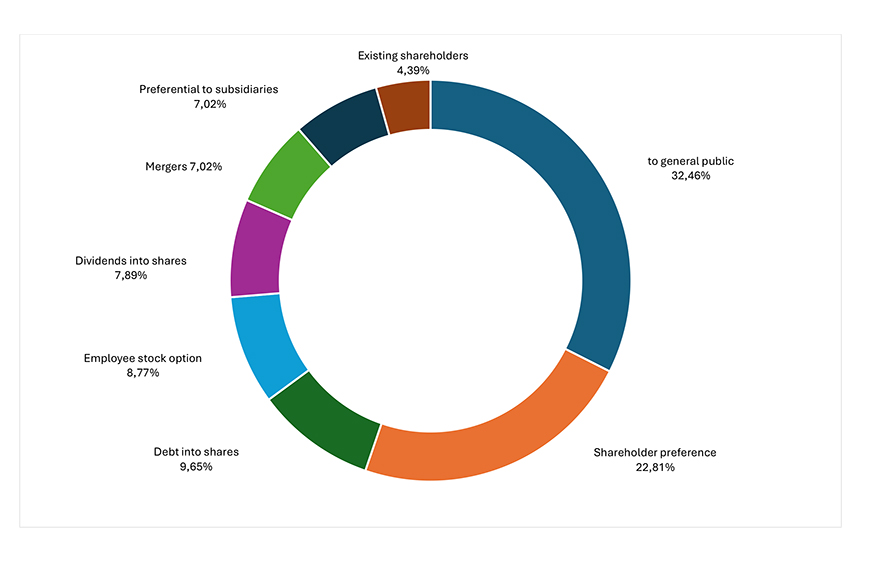
Figure 2 shows that 32.46% of total issuances were destined for release to the general public. The preferred issuance of shares to existing major shareholders was 22.81%, and the other objectives included smaller percentages of shares issued for various purposes, such as conversion of debentures (debt), employee incentives, distribution of dividends, mergers with other companies, preferential purchase rights, or new contributions from existing shareholders. Thus, Mexican companies’ corporate governance models are similar, as Donelli et al. (2013) stated that Chilean companies’ shares are blocks directed to major shareholders.
Source: Authors’ own elaboration.
Figure 2 Objective of Issuance of Shares by Mexican Public Companies 2012-2022
While these objectives provide a good impetus for a company’s sustainability, its main objective is not to increase the number of shareholders in a free and competitive manner. Furthermore, although 32.46% of the total share issuances were destined for the general public, the aforementioned percentage is exclusively 33.82% of the total MPCs listed on the BMV. Thus, we can infer that the growth in openness to the issuance of shares by MPCs that are effectively released among the public and that indicate a change in the family corporate model is still incipient. This coincides with Watkins and Flores’s (2016) findings from their study of Mexican companies, since the level of major shareholding remains a common feature.
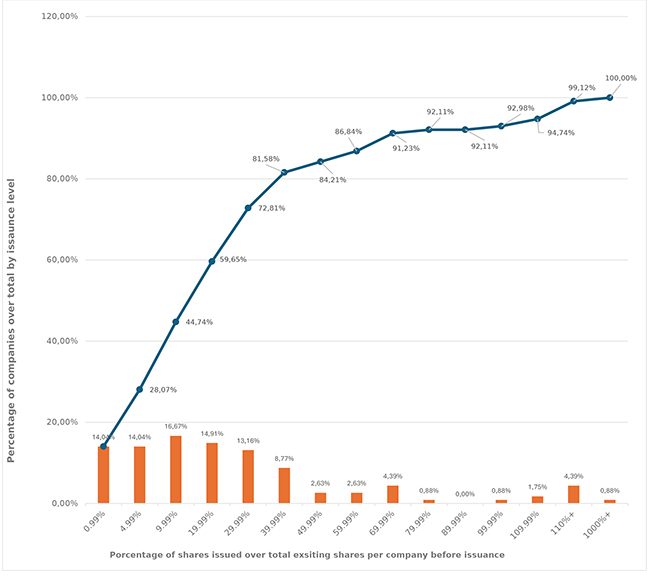
The bars in Figure 3 show the percentage of shares issued concerning each company’s total number of shares, and the line shows the integral percentage of total issuances. It was observed that 14.04% of the total issuances were made for an amount representing only 0.99% of the total equity invested in shares. A total of 28.08% of total issuances were made for amounts up to only 4.99% of existing shares.
Source: Authors’ own elaboration.
Figure 3 Percentages of Shares Issued Concerning the Total Shares Existing in Each MPC
However, 59.65% of the total issuances were made to increase the capital invested in shares to a maximum of 20% of the existing capital. The following issuance levels decrease dramatically from a proportion greater than 50% of the invested capital. That is, very few companies manage to issue shares that generate a significant change in the corporate governance of MPCs by having more shares in circulation for the public.
When we analyze the objectives of issuing new shares, it is inferred that the tendency of companies to share their corporate governance is lower. Given the total number of issuances, 67.54% are not actually due to the issuance of shares to the general public; therefore, the trend found is the preference for issuance with control of allocations. In other words, there is no significant increase in the participation of new shareholders that could form part of the company’s top-level decision-making body. In isolated cases, we can conclude that some companies already have an incipient openness to issuing new shares as a financing mechanism, particularly when analyzing the percentages of share issuance relative to the total number of shares outstanding at the time of the new issuance.
4.3. Trend in the Issuance of New Shares
Given the above findings, the next objective was to identify the possible relationships, correlations, variabilities, or linear regressions that might exist between the tendency to issue new shares, the quantitative variables of age and sales, and the categorical variable of the sector.
4.3.1. Correlational Analysis of the Number of Times Shares Were Issued.
To analyze the possible relationship between share issuance and the quantitative variables of sales and age, Table 5 shows the results of Pearson’s correlation coefficient. On the basis of the coefficients obtained, which are close to zero and negative, it is inferred that there is no statistically significant relationship between the variables of age and sales and the issuance of shares as a method of financing. The above finding is consistent with the findings of Franks et al. (2012) since, on the contrary, for European countries with a developed financial market and strong investor protection, the variable of age has a positive relationship with the concentration of shares among large shareholders. This also applies to Rogers et al. (2008) findings on Brazilian companies that the larger the companies, the lower the concentration of shares among major shareholders. Rogers et al. (2008) conclusion is also the same as that of Lazarides et al. (2009) finding regarding the same conduct by Greek companies.
Table 5 Correlation between times issued and age and sales
| Times Issued | Pearson’s r | p value |
|---|---|---|
| Age | -0.072 | 0.411 |
| Sales | -0.013 | 0.885 |
Source: Author´s own elaboration.
Finally, when analyzing the information by economic sector in Table 6, the negative results close to zero of the Pearson coefficients in the manufacturing and commerce sectors, with p values greater than 0.05, reject Ha. Therefore, there is no statistically significant correlation. Positive correlation factors were found in the service sector; however, because they were close to zero, we cannot be sure that there was any significant correlation between the variables. The results in general and by sector show correlation coefficients ranging from -0.163 to 0.096, with most being close to zero. Therefore, we conclude that we cannot be certain, or even infer, that as MPCs decline in age or sales, they tend to issue new common stock.
4.3.2. Simple Regression of the Number of Times Shares Were Issued.
The results in Table 7 show that in the simple linear regression, the beta 1 (β1) coefficients are negative and close to zero, indi-cating a low predictability of share issuance on the basis of the age or sales level of MPCs. In particular, the typical (standard) deviation in all the cases is smaller and close to zero. However, the p values of all the variables are much greater than 0.05, thus eliminating the possibility that there is no relationship. Hence, we cannot conclusively establish a significant relationship, suggesting that greater age or higher sales levels decrease the likelihood of MPCs issuing new shares. This conclusion is drawn from the lack of statistical significance in the results and the extremely low R-squared values across all the cases. There-fore, the model’s predictive capacity, which explains the variation in share issuance attributed to age or sales variables, is less than one percent. These findings contrast with the results presented by Franks et al. (2012) in European countries for the age variable, Rogers et al. (2008) in Brazilian companies for the size variable, and Lazarides et al. (2009) in Greek companies for the age variable.
Table 7 A Simple regression of times issued and age and sales
| Times Issued | Coefficient β1 | Typical Deviation | p value | R-squared |
|---|---|---|---|---|
| Age | -0.004 | 0.005 | 0.405 | 0.005 |
| Sales | -9.893E-11 | -6.802E-10 | 0.884 | 0.001 |
Source: Author´s own elaboration.
When the analysis was conducted by economic sector, in Table 8, we find a similar situation to that de-scribed in the previous analysis. We confirm that the beta 1 (β1) coefficients also have negative values and are remarkably close to zero. The standard deviations in all the cases are equally small and close to zero. The p value of all the variables is also well above 0.05, and the R-squared in most cases is extremely low (except for the variable of sales in the commerce sector). These indicators affirm and are consistent with the correlational analysis and simple linear regression.
Table 8 A simple regression of issue times with age and sales by sector
| Times Issued | Coefficient β1 | Typical Deviation | p value | R-squared |
|---|---|---|---|---|
| Manufacturing | ||||
| Age | -0.008 | 0.007 | 0.265 | 0.021 |
| Sales | -3.484E-10 | 9.008E-10 | 0.701 | 0.003 |
| Commerce | ||||
| Age | -0.004 | 0.008 | 0.659 | 0.018 |
| Sales | -4.250E-10 | 8.155E-10 | 0.614 | 0.614 |
| Services | ||||
| Age | 0.002 | 0.008 | 0.853 | 0.001 |
| Sales | 9.730E-10 | 1.344E-9 | 0.472 | 0.009 |
Source: Author´s own elaboration.
4.3.3. Binomial Analysis of the Number of Times Shares Issued.
In Table 9, the variables were sub-jected to generalized linear regression analysis via a binomial distribution. The logit and probit models have proven useful when a limited-variable parametric model is needed. The binomial variable was de-fined as “issues” and “does not issue” shares for each MPC. The results confirmed what was stated in the previous sections by also finding small and negative β1 coefficients, or close to zero. Likewise, the stand-ard deviations also showed reduced and negative values, and the p values were much greater than 0.05 for both methods. Even when the McFadden R-square is revised, in all cases, the model predicts percent-age levels below one percent. Hence, we reiterate that no significant relationship can be inferred, indicat-ing that younger age or lower sales levels correspond to a greater likelihood of MPCs issuing new shares.
Table 9 A Simple binomial regression based on the logit and probit models of the variable “Issues/does not issue” with age and sales
| Times issued | Coefficient β1 | Typical Deviation | p value | R-squared McFadden |
|---|---|---|---|---|
| Logit | ||||
| Age | -0.009 | 0.008 | 0.2579 | 0.008 |
| Sales | -4.037E-10 | 1.398E-9 | 0.773 | 0.001 |
| Probit | ||||
| Age | -0.005 | 0.005 | 0.2579 | 0.008 |
| Sales | -2.257E-10 | 6.575E-10 | 0.731 | 0.001 |
Source: Author´s own elaboration.
The results of the application of both binomial models by sector are broken down in Table 10, where the same behavior is found in the results, indicating that there is insufficient evidence to ensure that the vari-ables of age and sales have a significant influence on the behavior of MPCs issuing shares.
Table 10 A simple binomial regression based on the logit and probit models of the variable “issues/does not issue” with age and sales by sector
| Times issued | Coefficient β1 | Typical Deviation | p value | R-squared McFadden |
|---|---|---|---|---|
| Manufacturing | ||||
| Logit | ||||
| Age | 0.001 | 0.012 | 0.922 | 0.001 |
| Sales | -9.009E-10 | 1.843E-9 | 0.623 | 0.003 |
| Probit | ||||
| Age | 0.001 | 0.007 | 0.920 | 0.001 |
| Sales | -5.518E-10 | 1.086E-9 | 0.611 | 0.004 |
| Commerce | ||||
| Logit | ||||
| Age | 0.025 | 0.030 | 0.404 | 0.043 |
| Sales | -2.079E-9 | 3.558E-9 | 0.559 | 0.026 |
| Probit | ||||
| Age | 0.016 | 0.019 | 0.394 | 0.044 |
| Sales | -1.347E-9 | 2.190E-9 | 0.539 | 0.028 |
| Services | ||||
| Logit | ||||
| Age | -0.019 | 0.015 | 0.223 | 0.023 |
| Sales | 1.590-9 | 1.860E-9 | 0.393 | 0.010 |
| Probit | ||||
| Age | -0.012 | 0.009 | 0.198 | 0.025 |
| Sales | 9.730E-10 | 1.111E-9 | 0.381 | 0.010 |
Source: Author´s own elaboration.
4.3.4.1. Characteristics of the MPCs Analyzed.
In Table 11, the companies were grouped into four categories (quartile distributions) according to age. The “Early Years” category includes companies from 1 to 21 years of age; the “Young” category comprises companies from 22 to 31 years of age; the “Adult” cat-egory comprises companies from 32 to 45 years of age; and the “Older” category includes companies 46 years of age and older.
Table 11 Frequency distribution of the age variable
| Age Categories | Frequency | Percentage | Valid Percentage | Accumulated Percentage | |
|---|---|---|---|---|---|
| Valid | Early years | 32 | 22.1 | 22.1 | 22.1 |
| Young | 40 | 27.6 | 27.6 | 49.7 | |
| Adult | 37 | 25.5 | 25.5 | 75.2 | |
| Older | 36 | 24.8 | 24.8 | 100.0 | |
| Total | 145 | 100.0 | 100.0 | ||
Source: Author´s own elaboration.
To classify the companies by the variable of level of sales, they were grouped into four categories (distri-bution by quartiles) in Table 12. The “Regular” category comprises companies with annual sales in thou-sands of pesos from $316,405 to $4,963,999; the “Moderate” category comprises companies from $4,964,000 to $18,762,667; the “High” category comprises those from $18,762,668 to $64,807,341; and the “Very High” category comprises those from $64,807,342 and above. For this variable, only 127 MPCs had the required information regarding their sales.
Table 12 Frequency Distribution of the Sales Variable
| Sales Categories | Frequency | Percentage | Valid Percentage | Accumulated Percentage | |
|---|---|---|---|---|---|
| Valid | Regular | 31 | 21.4 | 24.4 | 24.4 |
| Moderate | 32 | 22.1 | 25.2 | 49.6 | |
| High | 32 | 22.1 | 25.2 | 74.8 | |
| Very high | 32 | 22.1 | 25.2 | 100.0 | |
| Total | 127 | 87.6 | 100.0 | ||
| Missing | Not available | 18 | 12.4 | ||
| Total | 145 | 100.0 | |||
Source: Author´s own elaboration.
Table 13 shows the description of the independent variables concerning the dependent variable, indicating whether the company issued shares or not.
Some significant differences can be observed, among which the following stand out:
Table 13 Variables in each company’s sector (Issues / Does not issue)
| Sample | Issues Shares | |||||
|---|---|---|---|---|---|---|
| Variable | Total | % | No | % | yes | % |
| Sector | ||||||
| Manufacturing | 61 | 44.9 | 40 | 65.6 | 21 | 34.4 |
| Commerce | 13 | 9.6 | 11 | 84.6 | 2 | 15.4 |
| Services | 62 | 45.6 | 39 | 62.9 | 23 | 37.1 |
| 136 | 100.0 | 90 | 66.2 | 46 | 33.8 | |
| Age | ||||||
| Early years | 30 | 22.1 | 16 | 53.3 | 14 | 46.7 |
| Young | 39 | 28.7 | 23 | 59.0 | 16 | 41.0 |
| Adult | 35 | 25.7 | 28 | 80.0 | 7 | 20.0 |
| Older | 32 | 23.5 | 23 | 71.9 | 9 | 28.1 |
| 136 | 100.0 | 90 | 66.2 | 46 | 33.8 | |
| Sales | ||||||
| Regular | 31 | 24.4 | 13 | 41.9 | 18 | 58.1 |
| Moderate | 32 | 25.2 | 24 | 75.0 | 8 | 25.0 |
| High | 32 | 25.2 | 23 | 71.9 | 9 | 28.1 |
| Very high | 32 | 25.2 | 26 | 81.3 | 6 | 18.8 |
| 127 | 100.0 | 86 | 67.7 | 41 | 32.3 | |
Source: Author´s own elaboration.
Economic sector companies in the service sector constitute the largest proportion of shares, at 37.1%, whereas only 15.4% of companies in the commerce sector issue shares.
Age: Companies in the “Early Years” category issue shares in the highest proportion at 46.7%, while only 28.1% of the “Older” firms issue shares.
Level of sales: Companies with “Regular” sales issue the highest proportion of shares at 58.1%, whereas among those with “Very High” sales, only 18.8% issue shares.
4.3.4.2. One-factor ANOVA by Economic Sector.
Table 14 shows the descriptive statistics of the number of times that companies issue shares by economic sector, showing there is not a large difference between the manufacturing (0.75) and service sectors (0.84); however, there is a large difference in the average of the commerce sector (0.23).
Table 14 Descriptive statistics by economic sector
| Sector | N | Mean | Standard Deviation | Minimum | Maximum |
|---|---|---|---|---|---|
| Manufacturing | 61 | 0.75 | 1.234 | 0 | 5 |
| Commerce | 13 | 0.23 | 0.599 | 0 | 2 |
| Services | 62 | 0.84 | 1.451 | 0 | 5 |
| Total | 136 | 0.74 | 1.300 | 0 | 5 |
Source: Author´s own elaboration
Table 15 shows the results of the one-factor ANOVA, which indicates a significance value of 0.309 > 0.05; thus, the null hypothesis is accepted, and the research hypothesis is rejected. This indicates that there are no statistically significant differences between the means of the number of times companies issue shares by sector.
4.3.4.3. One-factor ANOVA by Company Age.
Table 16 analyzes the descriptive statistics of the num-ber of times that companies issued shares by age category, showing no great difference between the means of the “Early Years” group (1.07) and the “Young” group (0.95); however, the means of the “Adults” (0.34) and “Older” (0.63) groups are significantly different.
Table 16 Descriptive statistics by age categories
| Age | N | Mean | Standard Deviation | Minimum | Maximum |
|---|---|---|---|---|---|
| Early years | 30 | 1.07 | 1.413 | 0 | 5 |
| Young | 39 | 0.95 | 1.538 | 0 | 5 |
| Adult | 35 | 0.34 | 0.765 | 0 | 3 |
| Older | 32 | 0.63 | 1.264 | 0 | 5 |
| Total | 136 | 0.74 | 1.300 | 0 | 5 |
Source: Author´s own elaboration.
Table 17 shows the results of the one-factor ANOVA, indicating that a significance value of 0.091 > 0.05; thus, the null hypothesis is accepted, and the research hypothesis is rejected. This means there are no statistically significant differences between the means of the number of times companies issue shares on the basis of age. This technique confirms the previously mentioned contrary results obtained by Franks et al. (2012) in European countries and Lazarides et al. (2009) in Greek companies.
4.3.4.4. One-Factor ANOVA by Company Sales
Table 18 presents the descriptive statistics of the number of times companies issued shares by sales category, showing that there are no major differences between the means of the “Moderate” (0.57), “High” (0.50), and “Very High” (0.38) sales groups; however, there is a significant difference in the mean of the “moderate” group (1.55).
Table 18 Descriptive statistics by sales categories
| Sales | N | Mean | Standard Deviation | Minimum | Maximum |
|---|---|---|---|---|---|
| Regular | 31 | 1.55 | 1.690 | 0 | 5 |
| Moderate | 32 | 0.56 | 1.162 | 0 | 5 |
| High | 32 | 0.50 | 1.047 | 0 | 4 |
| Very high | 32 | 0.38 | 1.008 | 0 | 5 |
| Total | 127 | 0.74 | 1.323 | 0 | 5 |
Source: Author´s own elaboration.
Table 19 shows the results of the one-factor ANOVA, indicating significance at the 0.001 level > 0.05; thus, the null hypothesis is accepted, and the research hypothesis is rejected. This implies that there are no sta-tistically significant variances in the frequency of share issuance among companies on the basis of their sales. This technique confirms the previously mentioned contrary results obtained by Rogers et al. (2008) for Brazilian companies.
Table 19 Single-factor ANOVA by sales categories
| Sales | Sum of Squares | df | Square Mean | F value | Sig. |
|---|---|---|---|---|---|
| Between groups | 27.373 | 3 | 9.124 | 5.813 | 0.001 |
| Within groups | 193.052 | 123 | 1.570 | ||
| Total | 220.425 | 126 |
Source: Author´s own elaboration.
According to the HSD Tukey post hoc test, significant differences were found between the groups “Regular” and “Moderate”, “Regular” and “High”, and “Regular” and “Very High”, with significance at the 0.05 level. Table 20 shows the values where significance is less than 0.05.
Table 20 Tukey’s HSD test by sales categories
| (I) Sales | (J) Sales | Mean Difference (I-J) | Standard Error | Sig. |
|---|---|---|---|---|
| Regular | Moderate | 0.986* | .316 | 0.012 |
| High | 1.048* | .316 | 0.006 | |
| Very high | 1.173* | .316 | 0.002 | |
| Moderate | Regular | -0.986* | .316 | 0.012 |
| High | 0.063 | .313 | 0.997 | |
| Very high | 0.188 | .313 | 0.932 | |
| rowspan="3"High | Regular | -1.048* | .316 | 0.006 |
| Moderate | -0.063 | .313 | 0.997 | |
| Very high | 0.125 | .313 | 0.978 | |
| Very high | Regular | -1.173* | .316 | 0.002 |
| Moderate | -0.188 | .313 | 0.932 | |
| High | -0.125 | .313 | 0.978 |
Note: * Mean difference is significant at the 0.05 level.
Source: Author´s own elaboration.
5. Conclusions
According to the results of the statistical tests conducted, most MPCs continue to adhere to a corporate governance model centered on control by the founding family and their close associates. Major shareholders consistently acquire the few shares issued in blocks (Donelli et al. 2013). Additionally, these companies do not rely primarily on issuing shares as a key avenue for financing. Moreover, in the MPCs that did issue new shares, a smaller percentage issued such shares to the general public; the vast majority issued new shares only for internal purposes such as granting new shares to existing partners, shares for employees, converting debt to equity, and other similar mechanisms. Therefore, the corporate governance model change is still very incipient, and the intention to promote such a change is still limited. This finding was also proven by Watkins and Flores (2016) in their research on Mexican companies.
When analyzing the relationship between the decision of companies to issue shares and their age, the level of sales, or the economic sector to which they belong, the results revealed no significant relationship between the issuance of shares and these independent variables. Although Pearson correlation, simple regression, logit and probit tests revealed insignificant evidence of an inverse relationship, i.e., the higher the age or level of sales, the less tendency of MPCs to issue shares; the level of significance is too low to infer with certainty or probability such a tendency. This was corroborated by applying the ANOVA model, which also rejected the hypothesis of a significant relationship and that the independent variables of sales and the economic sector influence the issuance of shares. Watkins and Flores (2016) coincided with this finding, declaring a negative correlation between the level of concentration of shares and the size of Mexican companies. Nevertheless, Franks et al. (2012) and Lazarides et al. (2009) found a contrary situation related to the age variable in European countries. However, the analysis concerning the sales variable yielded a slight indication that it influenced share issuance. Specifically, it suggests that lower sales volumes are associated with a greater inclination to issue shares. This suggestion tends to agree with Rogers et al. (2008) findings on Brazilian companies, where firm size has a positive correlation with the lower concentration of shares among major shareholders. Therefore, it is recommended that future studies continue to compare this behavior.

