


 English (pdf)
 Article in xml format
 Article references
 Send this article by e-mail
 Cited by SciELO
  Cited by Google
  Similars in
SciELO
Similars in
SciELO  Similars in Google
 Permalink
INTRODUCTION
Kikuyu grass (Cenchrus clandestinus Hochst. Ex Chiov. Morrone) is native from Africa, and was introduced to Colombia in 1928 (Ochoa, 1941). It grows between 1500 and 4000 m. a. s. l. in the Colombian Andes (Giraldo-Cañas, 2013). This forage occupies approximately 80 % of the area of pastures dedicated to dairy production in the high-altitude tropics of Colombia (Mila and Corredor, 2004). Nonetheless the kikuyu importance and its wide range of distribution in Colombia, the differences in its growth according to the altitude have not been evaluated. It is known that the ambient temperature varies with the altitude and influences the growth rate of pastures (Jones, 1983). At higher altitude (lower temperature) the appearance ofleaves could be slower. Assessing this aspect is necessary to give management recommendations based on the physiology of the forage, which will allow to improve productivity and pasture sustainability.
Morphogenesis in plants involves a series of organized structural changes that are genetically programmed and whose expression is influenced by endogenous aspects and by stimulation of environmental factors (Montaldi, 1992). In forages, morphogenesis is made up of three components: leaf appearance rate, leaf elongation rate and half-life of the leaf (Lemaire et al., 2009). leaf appearance rate and the foliar elongation rate determine the accumulation of tissue, while leaf half-life determines senescence (Lemaire et al., 2009). Foliar elongation can be restricted by the availability of water and nutrients, mainly by nitrogen (Lemaire et al., 2009), while the leaf appearance rate is mainly influenced by temperature and only in extreme cases it is affected by low nutrient availability (mainly nitrogen), due to water stress and high concentration of salts in the soil (Wilhelm and McMaster, 1995).
Leaf appearance rate is defined as the interval between the appearance of two successive leaves on the same stem or tiller during the time, and although this interval can be expressed in days, due to its close relationship with temperature (Tripathi et al., 2016), it has been calculated as thermal sum, called phyllochron (Colabelli et al., 1998). In the case of forages, the phyllochron can be determined for different periods or regions, through thermal time, understood as the accumulation of heat units and growing degree days, which are calculated from the mean daily temperature and the base growth temperature of the species (Moot et al., 2007).
The critical temperature or base temperature (Bt) is the temperature below which the plants stop their metabolic processes, the phenological development ceases (Parra-Coronado et al., 2015), and there is no plant growth (Moot et al., 2007). For the kikuyu grass, previous studies carried out by Ivory and Whiteman (1978) under controlled conditions, report as critical mean temperature 8 °C for the growth of the kikuyu. Studies carried out by Colman and O'Neill (1978) in Australia, affirm that with mean temperatures between 10 and 11 °C kikuyu cease growth. Those values have been assumed as a reference for Bt for kikuyu in previous studies (Fonseca et al., 2016; Herrero et al., 2000a; Herrero et al., 2000b). However, in Colombia, kikuyu has been observed above 2900 m. a. s. l., in places with minimum daily temperatures below 8 °C (Instituto de Hidrología, Meteorología y Estudios Ambientales [IDEAM], s.f.). Likewise, there are no reports of thermal time for the appearance of leaves in this species under tropical conditions and at different leaf stages (number of leaves per tiller).
The prediction of pasture dry matter accumulation using regression models from ambient temperature have been used successfully in forages due to a high association between ambient temperature and photosynthetically active radiation (Andrade et al., 2015; Kiniry et al., 2018). In addition, temperature is closely associated with enzymatic activity, photosynthesis, and transport through the membranes of the plant (Sharma et al., 2020). Knowing the Bt, the phyllochron, and determining if there are differences due to the altitude or among leaf stages in this parameter, will allow us to understand the growth of kikuyu at different altitudes and to facilitate the definition of strategies for the management of the pasture depending on the altitude. Knowing the required growing degree days for each leaf stage, it will be possible through the mean temperature of a site to estimate the number of calendar days needed to reach the desired leaf stage for grazing, according to dry matter accumulation and nutritional quality.
On the other hand, global warming will affect the scenario of sites suitable for grass production and the knowledge of the base temperature is of great importance to choose suitable sites for its use. Particularly, it has been predicted that the tropical Andes will have a temperature increase greater than that of the lowland zones of tropical regions (Pérez et al., 2010; Marengo et al., 2011). Therefore, plants that grow in the high altitudes of the Andes such as the kikuyu will change their growth behavior (growth rates, leaf appearance, productivity) due to increments in enzymatic activity and photosynthesis. Further, changing environmental factors are more evident under farm conditions where plants must respond favorably to minimal and inevitable stress (Perez Martinez and Melgarejo, 2015). The knowledge of Bt and the phyllochron of kikuyu will allow to anticipate the impacts of temperature changes in its growth behavior and better understanding its current at different altitudes above the sea level.
The objective of this study was to estimate the base growth temperature for the kikuyu grass (Cenchrus clandestinus Hochst. Ex Chiov. Morrone) through the appearance of leaves and calculate the phyllochron in three farms located at different altitude in the Provincia of Ubaté.
MATERIALS AND METHODS
Establishment of plots and measurements
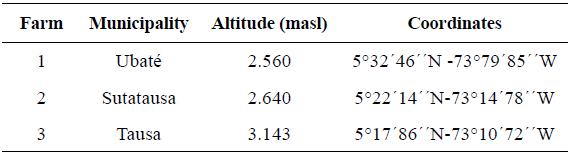
Three farms located at different altitude (2560, 2640, 3143 m. a. s. l.) were selected in the Provincia of Ubaté in the department of Cundinamarca, Colombia (table 1) with the presence of kikuyu pastures.
Three plots of 1 m2 were established in each farm. The vegetation cover (mainly kikuyu grass) and the soil were removed to a depth of 40 cm in each plot and replaced by new soil. New soil was collected in a farm of Fuquene (part of the Ubate province) and used to replace the original soil in all plots of the experimental farms, resulting in similar soil characteristics among experimental plots. The removed kikuyu plants were replanted. Once the kikuyu was reestablished, the measurements began and carried out four cycles in a total period of eight months. Each cycle included liming, a homogenization cut, fertilization, and monitoring of the appearance of leaves. The measurement cycle concluded when most tillers had at least one senescent leaf. The dates of the cycles were: March 16th to May 5th, 2017; May 18th to June 16th, 2017; July 28th to October 6th, 2017 and October 14th to November 21th, 2017.
Dolomite lime was applied according to the result of the analysis of the soil used (900 kg ha-1 year-1). Fertilization was done to reach an annual rate of nitrogen (100 kg ha-1 year-1), phosphorus (69 kg ha-1 year-1), potassium (46 kg ha-1 year-1) and magnesium (6.4 kg ha-1 year-1) according to the recommendations of Bernal and Espinosa (2003) for the kikuyu grass. The homogenization cut was made at a height of 10 cm and five tillers per plot were marked with a different color clip, for total of fifteen tiller per farm. The appearance of leaves was recorded approximately every six days. A new leaf was considered as "appeared" when its tip was visible (Wilhelm and McMaster, 1995).
In each farm a WatchDog 1000 series micro weather station was installed for continuous recording of temperature, relative humidity, precipitation and photosynthetically active radiation (PAR).
Determination of the base temperature
Bt was estimated for the appearance of each of the four leaves (first, second, third, and fourth leaf) by three statistical methods: least variance, least standard deviation, and least coefficient of variation. Most trustworthy values for Bt were obtained with the least coefficient of variation. This statistical method has been widely used in other studies (Yang et al., 1995; Ruml et al., 2010; Salazar- Gutiérrez et al., 2013; Moreno et al., 2014; Parra-Coronado et al., 2015). Data from the three farms and three cycles were used for the estimation of Bt.
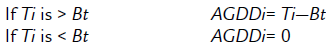
Coefficient of variation in Accumulated Growing Degree Days (AGDD) is defined as (Yang et al., 1995):

Where CVgdd is the coefficient of variation in Growing Degree Days (GDD), SDgdd is the standard deviation of GDD accumulations in n plants, and f(x) is the mean of GDD accumulations of n plants (tillers).
Equation obtained by the derivative of CVgdd (Yang et al., 1995):
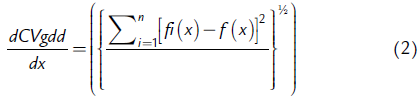
When the equation 2 is zero the base temperature (x) can be expressed as (Yang et al., 1995):
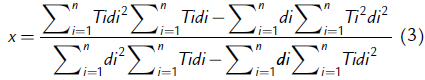
Where Ti is the overall mean of temperature of the ith plant (tiller), di is the number of days of the ith plant (tiller), and n is the number of all plants (tillers).
The sum of the mean temperatures was calculated for the appearance of each of the leaves on the tillers marked in each farm. For the first leaf the mean temperature was taken from the beginning of the cycle until the first leaf appeared, for the second leaf stage the mean temperature was taken from the appearance of the first leaf until the second leaf appeared and so on with the third and fourth leaf stages. Then the coefficient of variation in AGDD (Equation 1) was minimized from a temperature range between 0 and 12 oC. The temperature at which the least coefficient of variation was obtained using a second order regression model was considered as Bt for each farm. Parameters for the quadratic equation were obtained using the Excel Solver tool, that executes an iterative nonlinear procedure that makes the first estimate with the initial values assigned to the parameters of the equation and then increases or decreases the value of the parameters until which finds the minimum value of the sum of the squares of the deviations.
Estimation of thermal time (phyllochron)
The thermal time in AGDD was determined for the appearance of each leaf in each farm following the methodology presented by Parra-Coronado et al. (2015) through equation 4, using the sum of the mean temperature and Bt for each leaf, determined by the procedure explained previously.

Where, TT is the thermal time (°C) accumulated during the number of days (n) until a leaf appears, Ti is the mean daily temperature (°C) for day i, and Bt is the base temperature (°C). The AGDDi for the accumulation of TT are calculated using the following considerations:
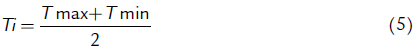
Where Tmax is the maximum temperature (°C) for day i and Tmin is the minimum temperature (°C) for day i.
In order to determine possible differences in TT among leaves number between farms or some interaction, a completely randomized design was used with a4*3 factorial arrangement where the first factor corresponded to the four leaf stages and the second factor to the three farms. The means were compared using the Tukey test, using the statistical program InfoStat version 2016I (FCA-UNC) for the analysis of the data.
The model used was (Martínez et al., 2011):
Yijk: μ +αi + βj+(αβ)ij+ ξijk, where:
i=1,2,3
j= 1,2,3,4
μ= 1,2,3
j= Mean
αi= Effect of farm
βj= Effect of leaf number
(αβ)ij= Efect of the interaction
ξijk= Experimental error
The information corresponding to the last three measurement cycles (n=36) was used for the development of the model of TT and the first cycle information (n=12) was used for the validation of the same, through the cross-validation method, which consists in a regression analysis between the predicted values and the observed values (Parra-Coronado et al., 2015). This validation was done for the TT (AGDD) using the Bt values determined for each leaf. A validation was also made for calendar days. The evaluation criteria of the model were the coefficient of determination (r2) and the concordance correlation coefficient (CCC). The CCC (Lin, 1989), also known as reproducibility index, is a statistic that allows to evaluate the accuracy and precision of a model simultaneously (Tedeschi, 2004). Excel was used to analyze the information.
RESULTS
During the study, the mean daily temperature varied between 11 and 16.2 oC and was higher for the first cycle and lower for the higher altitude. Daily precipitation varied between 1.1 and 5.8 mm d-1. The rainfall was highest in the second cycle of measurements for the three locations. PAR radiation varied between 12 374 and 17 606 (mmol m2 s-1). The lowest radiation was presented in the first cycle and the highest for the third cycle coinciding with the highest and lowest rainfall, respectively (table 2).
Table 2 Environmental conditions registered in the four experimental cycles
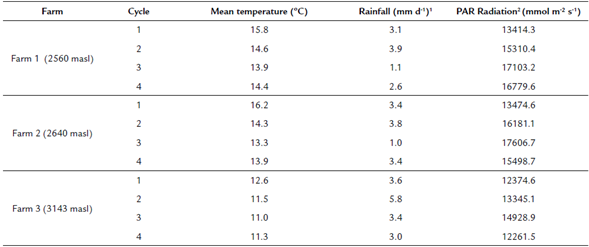
1 Daily average rainfall of the cycle.2Daily average Photosynthetically Active Radiation (PAR) of the cycle.
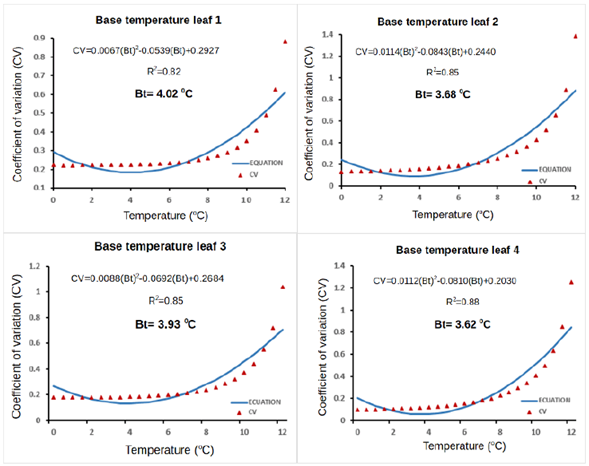
Base temperature
The Bt associated with the leaf appearance did not vary significantly among leaves per tiller, finding Bt values of 4.02; 3.68; 3.93 and 3.62 °C, for the first, second, third, and fourth leaf respectively (Fig. 1). These temperatures correspond to those in which the least coefficient of variation of the sum of heat accumulated for the corresponding leaf was found, the regression equations are presented in figure 1.
Phyllochron
The phyllochron for the appearance of leaves 1, 2, 3, and 4 in each tiller was determined using the respective Bt values presented above (Fig. 1). Fulfillment of the assumptions of the model was verified: homogeneity of the experimental material and normal distribution of the experimental error, with zero mean and common variance.
There was no interaction between the order of emergence of the leaf and the altitude and there was no effect of altitude (p > 0.05). However, there were differences in the phyllochron associated with the order of appearance of the leaves (p = 0.0093). It was found that kikuyu grass requires a greater amount of AGDD (97.5 ± 21.9) for the emergence of the first leaf than for the appearance of the second (74.2 ± 11.3), third (73. 8 ± 13.5) and fourth leaf (76.0 ± 8.7) (table 3).
Table 3 Phyllochron and calendar days for the appearance of leaves in kikuyu grass at different altitude
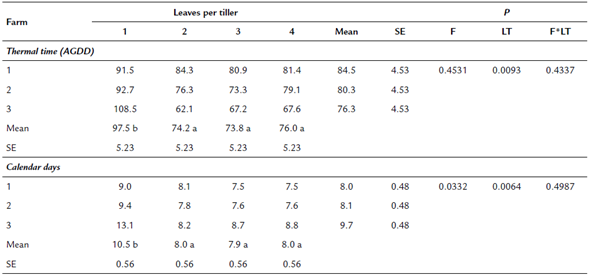
Different letters within a row indicate statistically significant differences among leaves per tiller p<0.05 SE: Standard error of the mean; F: Farm; LF: Leaves per tiller; F*LT: Farm*Leaves per tiller
With respect to calendar days, it was found that the kikuyu grass requires a greater (2.5 d) number of days (p = 0.0064) for the appearance of the first leaf after defoliation, than for the subsequent leaves (table 3). In the farm located at higher altitude, a greaternumber of days (1.7 d) were required for the appearance of a leaf (p = 0.0332).
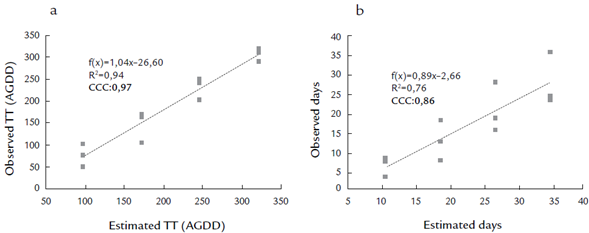
Cross-validation showed that the estimation of TT using Bt determined for each leaf presents a good fit as indicated by the coefficient of determination (r2 = 0.94). Also, it was found that there is substantial agreement (CCC = 0.97) between the observed values and the predicted values for TT (Fig. 2a). For the calendar days, a lower coefficient of determination (r2 = 0.76) and lower concordance (CCC = 0.86) between the observed values and the predicted values were found (Fig. 2b). These results confirm that it is more accurate to consider TT (or physiological time) as a growth parameter, than the simple use of days.
DISCUSSION
In last years, studies have been carried out on the determination of phyllochron in different forage species and their use as a criterion for grazing management (Acharán et al., 2009; da Silva et al., 2012; Romano et al., 2014; Chaves et al., 2017; Kiniry et al., 2018). This criterion allows determining the optimum time of harvest taking into account the foliar turnover of the plant and the beginning of senescence, to harvest forage of good nutritional quality, reducing losses due to accumulation of dead material, and improving the efficiency of use of the pasture (Fulkerson and Donaghy, 2001). For the correct determination of the phyllochron, knowledge of the specific base temperature of the forage species is important, as it is one of the parameters required for the equation for determining the growing degree days. The determination of Bt is traditionally carried out employing growth chambers with controlled conditions. However, recent studies have determined the base temperature of growth in several species from data obtained in field conditions and using different mathematical methods (Ruml et al., 2010; Salazar-Gutiérrez et al., 2013; Moreno et al., 2014; Romano et al., 2014; Parra-Coronado et al., 2015), as the coefficient of variation in AGDD used in this study. These methods have the advantage that allow determine Bt for different developmental phase of the plant (Yang et al., 1995), as in this study where the Bt was estimated for the appearance of different number of leaves per tiller.
In this experiment, the Bt values of growth for kikuyu grass determined through the appearance of new leaves after defoliation were lower than those reported in the literature. Bt close to 4.0 °C was found for the appearance of the first four leaves, which differs from the Bt of growth of 8.0 °C reported for several authors (Herrero et al., 2000a; Herrero et al., 2000b; Marais, 2001; Muscolo et al., 2013; Fonseca et al., 2016) from the results of the study carried out by Ivory and Whiteman (1978) in kikuyu. In a study conducted in Australia was also higher the range for Bt of 10 - 11 0C proposed for this species by Colman and O'Neill (1978). The 8 oC temperature reported by Ivory and Whiteman (1978) and which has been used as the Bt for the determination of TT (Herrero et al., 2000a; Herrero et al., 2000b; Fonseca et al., 2016) corresponds to a critical daily mean temperature according to the authors. They clarify that with daytime temperatures of 20 °C, the critical night temperature for the growth of kikuyu was 4 °C, similarly, to what was found in this experiment. Ivory and Whiteman (1978) did not find differences in the relative growth rate, the net assimilation rate, and the total weight of the leaves among the kikuyu plants that were maintained at 4 °C and 8 °C. Plants that grew at 4 °C had shorter leaves and therefore a smaller leaf area, compensating the weight with an increase in leaf thickness. This indicates that with temperatures below 8 °C the growth of the kikuyu did not stop as assumed, but rather there was a change in the growth habit of the plant. This agrees with the observations of the authors made in the province of Ubaté, where at the higher altitude, which have lower night temperatures, the kikuyu plant elongates less, and pastures are shorter and denser. Considering the above, the results of Bt of growth of the kikuyu grass obtained in this study allow us to make more precise predictions about the phyllochron and will contribute to generating growth models with values closer to reality, given the importance of this parameter in the simulation of plant growth.
Regarding the phyllochron, the results showed that the kikuyu requires greater TT for the appearance of the first leaf than for the appearance of the remaining leaves. This difference is explained by the condition presented by a forage plant after being defoliated. Defoliation is understood as the removal of photosynthetically active material by direct consumption of the animal, by cutting or trampling (Heady and Child, 1994) represents for the plant an interruption in its growth and the adaptive response of forage plants to this situation is its regrowth (Lemaire, 2001). When the defoliation is more intense, there is less residual leaf area available for photosynthesis, compromising the carbon economy in the plant. The carbon supply for the plant becomes less than the demand for sustainability and growth, entering a negative balance until the plant recovers the leaf area necessary to restore photosynthetic capacity. The main physiological adaptation to this imbalance is the mobilization of carbon (reserve carbohydrates) from the base of the stems, to maximize the expansion of the new leaf area (Fulkerson et al., 1999; Fulkerson and Donaghy, 2001; Lemaire, 2001). This physiological effort made by the plant explains the difference in the TT required for the appearance of the first leaf; however, this difference has not been studied by other authors in other forage species.
In the case of the calendar days necessary for the appearance of a leaf, a significant difference was found among farms (p = 0.032), with a tendency to more days on the farm three, although this difference was not detected by the Tukey test. This result was expected because in all the cycles this farm had a lower mean temperature (table 2). The variation found in this study confirms the importance of defining the grazing interval according to the phyllochron (AGDD) and not in days, since the phenological development of the pasture can vary significantly, even among very close areas as observed in this case. It would be advisable to make an approximation to the days that the plant can take to reach the optimum leaf stage for grazing from the phyllochron and the behavior of the mean temperature of the particular site. In this way, a practical recommendation is generated for the farmer and specific for a farm, since a generalized recommendation can affect the yield and quality of the harvested pasture.
The cross-validation showed that the Bt values obtained for the appearance ofleaves by the method ofleast coefficient of variation allow determining the phyllochron reliably for the kikuyu grass, finding a substantial agreement between the observed and predicted values. The variation mentioned above in the calendar days generated for this variable a lower concordance between the observed and predicted days; however, there was a good fit in the model. Although the hypothesis of slope equal to one was rejected for the two variables, authors as Tedeschi (2004) have considered that for this type of relationship between predicted and observed values, where the equation generated from the line is not used with the purpose of prediction, the information given by criteria such as the concordance correlation coefficient (CCC) (Lin, 1989) allows evaluating the accuracy and precision of the model, and as mentioned above, this index was satisfactory for the two variables.
CONCLUSIONS
The Bt for growth of kikuyu grass estimated in this study through the appearance of leaves was 4.02, 3.68, 3.93, and 3.62 °C, for the first, second, third, and fourth leaves respectively, values that were lower than the ones reported in the literature, which will allow to calculate the phyllochron and generate growth models for this species closer to reality. The estimation of the phyllochron with the Bt values determined showed that for the appearance of the first leaf after defoliation, the kikuyu plant requires a greater TT (97.5 °C) than for the appearance of the other leaves (74.7 °C), suggesting that this behavior could be related to the physiological adaptation in response to grazing that perennial pastures have, which consists of mobilizing reserve carbohydrates for regrowth. The variation in the calendar days necessary for the appearance of a leaf among farms and altitudes confirmed the importance of adjusting the grazing interval according to the phyllochron (AGDD), a method that is closely related to the phenological development of the pasture and the consequent changes in biomass. Finally, the cross-validation analysis showed that it is possible to determine the base growth temperature of the forage species, from field data and using mathematical methods such as the least coefficient of variation, used in this study.

