


 Inglés (pdf)
 Articulo en XML
 Referencias del artículo
 Enviar articulo por email
 Citado por SciELO
  Citado por Google
  Similares en
SciELO
Similares en
SciELO  Similares en Google
 Permalink
INTRODUCTION
Grazing and detritus food chains are the source of energy and nutrients for primary consumers in ecosystems. Detritus food chains are the main source of energy flow in many ecosystems because grazing herbivores use only a small portion of net primary production. Some studies have recognized the great importance of detritus food chains in ecosystems, but the theories of food webs and trophic dynamics have neglected this importance of detritus-based chains, and therefore, have focused almost exclusively on the grazing food chains (Moore et al., 2004). Much of the detritus is consumed by bacteria, and this microbial production is linked with higher trophic levels through direct feeding from main consumers such as protozoa (e.g. heterotrophic nanoflagellates), that constitutes an intermediate link between bacteria and macrozooplankton (Sherr and Sherr, 2002). Consumers can affect the trophic structure so far, they diversify their diet, and the food quality of their prey is different. Some cladocerans such as Bosmina, for example, are selective consumers and in their diet, they prefer mainly Cryptomonas and secondly, small protozoa (DeMott, 1982), which belong to the chains of grazing and detritus, respectively.
According to the biomass reports from Riogrande II reservoir, made byVillabona-González et al. (2015), the small cladocerans reached a density of 1232 mg m-3 and the cyclopoid approximately 48 mg m-3. Additionally, these authors observed that Bosmina freyi was a small dominant cladoceran of the zooplankton community. Almost simultaneously, López-Muñoz et al. (2016) concluded that the portion of the phytoplankton biomass that can be consumed by the dominant zooplankton in this system is less than 1 %. Parra-García et al. (2020) performed a biomass spectrum analyzes, showing that the most planktonic production of Riogrande II reservoir is low used directly for primary consumers and it seems that detritic mass flows are an indirect way of channeling primary production into primary consumers, like Bosmina.
The characteristic behavior of the principal source of feeding (here Small cladocerans) affects the consumer population (here Cyclopoids). These interactions (and others like the refuge effect of the prey) can be modeled by a set of first-order differential equations. The dynamic relationship prey-predator is one of the dominant topics in both ecology and mathematical ecology, due to its universal existence and importance (Berryman, 1992). Given that the probability of local extinction of a population in a system can be caused by difficulties in fitness, inbreeding, food access, and the evasion of predators or defense (Allee, 1931), the predator-prey models can be used to assess the hypothesis of whether the biomass of the top predator depends on the predation evasion ability of its prey (favored by the concentration of particulate material). If we take into account that the flow to the detritus pathway is the result of the death of all living organisms and unassimilated prey, and in ecosystems such as the photic zone of the Riogrande II reservoir the autochthonous production is the main source of detritus, then we hypothesized that i) the prominent flows of the detrital food chain mainly determine the coupling of the planktonic community in the photic zone of the Riogrande II reservoir, and ii) that the predator biomass top is the result of the subsidized flows of the detrital food chain and the probability of encounter of its prey, simultaneously.
Reservoirs receive and process the forcing forces of external variables from the drainage basin, generating a tendency towards compartmentalization and redistribution of matter and energy flows in the system (Margalef, 1983). In this way, these systems exhibit a hierarchical organization of organisms, whose structure and functionality respond to different spatial and temporal scales (Munkittrick and McCarty, 1995). In correspondence, the understanding of the relationships between the planktonic communities in a reservoir with spatial differences in the trophic state, provides insights about the possible alterations that could occur in the different compartments of the system, related to changes in the distribution of energy in the structure of the community (Odum and Barrett, 2006). In this paper, we propose a dynamic model for the Riogrande II reservoir that integrates the planktonic trophic chains of detritus and grazing to simulate the causal relationships between the main planktonic populations. We include data from previous studies to set-up and validate the model.
MATERIALS AND METHODS
Study area
Riogrande II reservoir is located in Colombia, in the Rio Grande basin (latitude 6° 30' 50'' N and longitude 75° 29' 10'' W), at an altitude of 2270 m. a. s. l. It was built between 1986-1988. This reservoir presents greater eutrophication near the rivers inlet and lowers in the areas close to the dam (Fig. 1). Riogrande II reservoir stores as much as 240 million m3 and covers an average area of 12.14 km2. Its maximum and average depths (during the sampling period) were 42.00 and 37.90 m, respectively. Its maximum length was 10.00 km, and its retention time was 72.80 days on average. The reservoir is mainly formed by the damming of water from the Grande and Chico rivers and Las Ánimas Creek (Fig. 1), and its uses include hydroelectric generation and drinking water supply (Restano et al., 2011). The mean depth of the photic zone is 5 m. The corresponding volume, considered for the calculation of biomasses, is 70 million m3. A detailed physicochemical report of the reservoir conditions can be found in Chapter 1 of Palacio-Betancourt (2014).
Figure 1 Geographical location of the Riogrande II reservoir and sampling stations (modified from Palacio-Betancourt, 2014). The inset box shows the rank of Carlson's weighted trophic state index (IET) modified by Toledo et al. (1983). A total of 24 field sampling campaigns were carried out from March 2010 to November 2013 at eight stations. *From Palacio-Betancourt (2014). + From Villabona-González et al. (2015).
Diet composition
Taxonomic categories, as well as dead organic matter (detritus), were assigned to planktonic functional types (PFTs), which are the basic nodes in the food web. In addition to detritus, these PFTs include taxa of planktonic organisms that have some similarities according to their morphological, physiological, and ecological characteristics, dietary habits, and/or similar life history (Polovina, 1983; Christensen and Pauly, 1992). Diet composition (DC) was based on information collected from literature (DeMott, 1982; Matz et al., 2002; Marten and Reid, 2007; Chang et al., 2010; Giraldo, 2010), and scaled to the relative abundance of the prey in the photic zone of the Riogrande II reservoir (Fig. 2).

Figure 2 Conceptual model of the planktonic trophic network for the photic zone of the Riogrande II reservoir. The boxes represent the biomass of the modeled PFTs. The arrows indicate the direction of the flows. The inset frame shows the diet composition (relative frequency) of PFT consumers in the photic zone of Riogrande II reservoir. Cyclopoids (Cycl), Asplanchna (Aspl), Small cladocerans (S clad), Heterotrophic nanoflagellates (H), Heterotrophic bacteria (B). aMarten and Reid (2007). bGiraldo (2010) and Chang et al., (2010). cDeMott (1982). dMatz et al. (2002).
The food preferences of each PFT have been reported for classified taxonomic groups by several authors (Fig. 2), we assume the following criteria to assign the feeding relationships between the PTFs modeled:
Cyclopoid. Cyclopoid species tend to be plankton feeders, aggressive predators of consuming protozoa, rotifers, and small aquatic animals (Hutchinson, 1967). We assume for this model that the feeding of cyclopoids is constituted by the relative biomass proportion of their prey with respect to the rest of zooplankton. The relative biomass of Small cladocerans, Asplanchna and Cyclopoids is 61 %, 21 % and 1 %, respectively (Villabona-González et al., 2015). In addition, cyclopoids that fed algae usually do not reproduce normally (Marten and Reid, 2007).
Asplanchna. Some studies carried out at the Riogrande II reservoir have determined the rotifers of the genus Asplanchna as an omnivore, whose dietary preferences mainly depend on the relative abundance of the prey (Estrada, 1999; Giraldo, 2010).
Small cladocerans. Feeding-selective small-sized is almost entirely represented by genus Bosmina. This was the dominant zooplankton taxon according to Villabona-González et al. (2015) and its dietary preference mainly depends on adequate size food for Bosmina (DeMott, 1982; López-Muñoz et al., 2016).
Heterotrophic nanoflagellates (H). Protozoa are recognized as major consumers of bacteria adhered to particles of organic matter in freshwaters (Bloem et al., 1989; Berninger et al., 1991).
Heterotrophic Bacteria (B). Data of B and H biomass were estimated from the total bacterial content of carbon and numerical abundance of H in agreement with Hakspiel-Segura et al. (2015) for the Neusa reservoir.
Detritus. Detritus are produced as a consequence of physiological processes and the death of algae. They are used by heterotrophic bacteria for their growth (Wetzel, 2001).
Phytoplankton. For this model, the information on cyanobacteria biomass was included. The eukaryotic phytoplankton biomass was also included in this compartment.
Our conceptual model for the planktonic trophic web of the photic zone in the Riogrande II reservoir is presented in Figure 2. This model tries to describe most of the interactions in this area of the reservoir. The reactive soluble phosphorus available is a limiting nutrient for phytoplankton growth due to its low proportion with respect to total phosphorus (TP), and it is easily precipitable in neutral or slightly basic water. For this reason, we assume that TP is the determinant nutrient in the dynamics of growth for the PFTs densities in this system.
The model
We assume that dead phytoplankton cells are small and barely denser than water. Therefore, the debris moves towards the sediments with a slow sinking rate, in such a way that a large part of dead phytoplankton is colonized by bacteria before reaching the bottom (Jørgensen and Bendoricchio, 2001). In the Riogrande II reservoir, the estimated fraction of phytoplankton that is not filtered by the dominant zooplankton due to its small size is greater than 98 % (López-Muñoz et al., 2016). Therefore, the dead phytoplankton enters to detritic trajectory, becoming the fundamental route of the energy flow in this reservoir (Parra-García et al., 2020). The model describes the coupling of both food chains, as well as the causal relationships between the groups (Fig. 2).
Our model is based on the mass balance of seven groups, where the biomass flow of each group is calculated as the difference between incoming and outcoming flows. The incoming flows are constituted by primary production, prey assimilation by predators, and detritus flow (in B and H). On the other hand, the outflows are accounted for predator's consumption, flow to detritus, and eliminations by sinking and respiration.
The governing equations below describe the changes in relative density of producers and consumers, respectively.
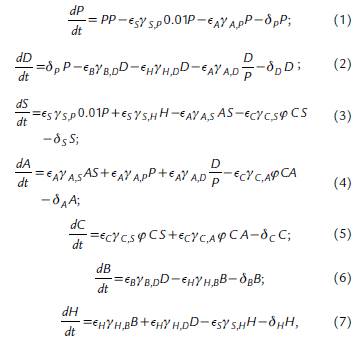
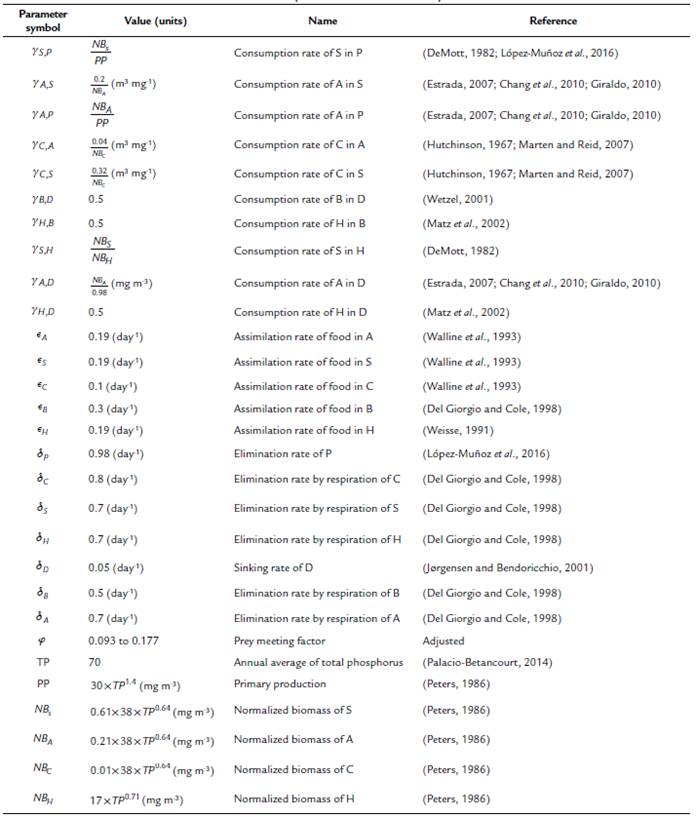
where, P is Phytoplankton, D is Detritus, S is Small cladocerans, A is Asplanchna, C is Cyclopoid, B is Heterotrophic Bacteria, and H is Heterotrophic nanoflagellates. The values of the parameters used in the equations are described in Table 1.
Table 1 Parameter values used in the equations. The values of the parameters and state variables that were not collected directly from the field observations were obtained from what is reported in the literature. The parameters without units are dimensionless.
In this model, the limitations of consumers and resources simultaneously play an important role that is represented by a parameter that we call prey meeting factor (pmf). This parameter measures the probability of an encounter between the cyclopoid predator and its prey. The pmf parameter can produce a functional response depending on the detrital organic matter concentration, stabilizing or destabilizing the system. Therefore, taking into account the dynamical analysis made over the model, the pmf has been adjusted around the non-zero fixed point from 0.093 to 0.177.
The biomass input for each compartment was calculated according to the equations of Peters (1986) and adjusted to the relative biomass of the zooplankton PFTs.
The normal zooplankton biomass (NZB) in a given lake it is calculated as (Peters, 1986):

However, this value must be scaled according to the relative biomass of Small cladocerans, Asplanchna, and Cyclopoids as 61 %, 21 %, and 1 %, respectively (Villabona-González et al., 2015). Equation (8) is modified as follows:

Here, we assume that nutrients released by microbial mineralization are not available to phytoplankton. Similarly, we assume that the amount of detritus caused by consumers through excretion or mortality without depredation is very low compared to the generated by phytoplankton, therefore, this amount is not taken into account in this model. In addition to the losses related to consumption, other losses (i.e., elimination) of biotic PTFs are included, which are primarily related to respiration. We specify a rate of loss of detritus from the system by sedimentation (sinking = 0.05 day-1) (Jørgensen and Bendoricchio, 2001).
Numerical analysis
Our model describes the biomass flows through the trophic levels, defined mainly by the food strategy. The populations are regulated by the available resources and the spatial variation of the consumers relative biomass. The system equations are solved based on the annual variation of the phosphorus concentration for each station sampled (Fig. 1), and such results are compared with the values reported by Villabona-González et al. (2015).
The metabolic characteristics of the organisms and their biomasses can be determined in laboratory conditions by assuming the stable state of the system without consumers, without considering the common interactions in an ecosystem which affect production rates, metabolism, and consumption under natural conditions. The magnitude of the predation effect on the other components of the food web (i.e., the interaction force) was calculated from a cluster of pmf and different TP values (Fig. 1). The intensity of the effect is reflected in the equilibrium biomass of a given component in the presence of the predator.
The model initially accounts for the zooplankton and phytoplankton PFTs. Once the model reaches the stable equilibrium of the system, the additional components were introduced one by one. The order of incorporation was detritus, heterotrophic bacteria, and heterotrophic nanoflagellates. The system was allowed to settle into 30 days before the next component was introduced. The final system was simulated until a stable equilibrium was reached, or until no component reached zero biomass. This technique of assembling for the food web avoids the initial conditions problem, in which one or more components collapsed at very low densities with long recovery times. The pmf was adjusted by trial and error until the calculated biomasses of the stocks tended to stabilize from the first 30 days until the end of the simulation. Also, data of B and H biomasses were compared from other studies conducted in Colombian high-altitude Andean systems (Hakspiel-Segura et al., 2015).
RESULTS
We use the differential equations that describe the model and an average value of TP (70 mg m-3) as the input of nutrients, which corresponds to the average concentration reported for the reservoir during the sampling period. Based on this concentration, we adjusted the value of the pmf at the threshold where the biomasses calculated were within the range of biomass observed (Fig. 3).
Figure 3 Biomasses simulated by model for 30 days of the planktonic trophic network in the Riogrande II reservoir. We used for this general model a concentration of TP = 70 mg m-3 and a pmf of 0.132. a) All consumers; b) Biomass calculated of Small cladoceran, in gray ranges of quartiles of biomes observed and reported by Villabona-Gonzalez et al. (2015); c) Biomass calculated of Asplanchna, in gray ranges of quartiles of biomes observed and reported by Villabona-Gonzalez et al. (2014); d) Biomass calculated of Cyclopoid, in gray ranges of quartiles of biomes observed and reported by Villabona-Gonzalez et al. (2015); e) and f) Biomass calculated of heterotrophic bacteria and nanoflagellate, respectively.
At a concentration of TP = 70 mg m-3 and a pmf = 0.132, the biomasses calculated from the modeled groups reach to values that are within the ranges of biomass observed for each one of them (Table 2 and Fig. 3). Based on the model results, we evaluate how the phytoplankton biomass that is not consumed and enters the detrital path, is sufficient for the detritivorous to transfer this biomass and sustain the food demand of higher trophic levels. The biomasses calculated from the phytoplankton in the modeled stations, are a result of simulating the effect of the limiting nutrient (in this case TP) in the primary production for the reservoir. According to the input variables of the model, it was expected that in the station with the highest concentration of total phosphorus (station 1 in Fig. 1), the calculated biomass densities of phytoplankton would be higher than in the rest of the stations.
We simulate the dynamics of the biomasses of each PFT for each station (with its respective average TP concentration) and obtain the equilibrium points of the simulation. Each point is stable when at the end of the simulation the stock is greater than zero, and unstable when the opposite occurs.
For example, when in the simulation we only considered 1 % of the phytoplankton biomass, the calculated biomass of the cladocerans and the copepods reached to zero. On the contrary, if we eliminate all the connections of the grazing chain, the flows of the detritus chain are high enough to reach values close to the calculated biomass. Therefore, we adjust the pmf (value between 0.093 to 0.177) to obtain the expected results for the calculated biomass (Table 2). In summary, the equilibrium points of the simulation were adjusted based on the observed biomass of the PFTs that represent the highest trophic levels of the web, allowing a more integrative response to the mass transfer of the planktonic trophic web.
Table 2 Comparison of observed (López-Muñoz, 2016; Palacio-Betancourt, 2014; Villabona-González et al., 2015) and calculated biomasses (simulation model of biomass for 30 days) for each of the planktonic functional types (PFT) of the planktonic trophic network for the sampling stations evaluated and the average value of Total Phosphorus (TP) concentration (TP in mg.m-3 see Table 1)
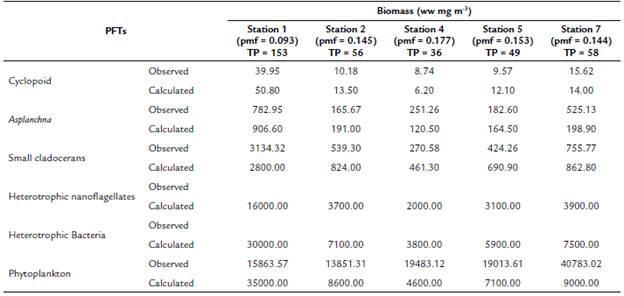
pmf: prey meeting factor. Wet weight (ww).
DISCUSSION
In this model, primary and secondary productions are determined by the concentration (availability) of the limiting nutrient (TP) and the transfer efficiencies (quality of prey). In addition, the model is sensitive within the range of the mean values of the total phosphorus concentrations (36 to 153 mg m-3) evaluated in the photic zone of the reservoir. Here, the percentage of net primary production that is not consumed by the grazing chain enters to the detritic chain (Fig. 2).
In our model, the equilibrium points of the simulations were stable only in the runs where the detrital chain was included alone or in combination with the grazing chain. If we eliminate all the connections of the chain of detritus, the flows of the grazing chain were very low, therefore, the populations can no longer maintain themselves at the levels observed. Without the flows from the detritus, we would observe an abrupt decrease in the biomass and eventually some populations would reach the extinction limit. Therefore, the above arguments would support the idea in which the biomass of the phytoplankton that is not consumed and enters in the detritic path is sufficient for the detritivore to transfer this biomass and sustain the demand for food at higher trophic levels. These results agree with Sherr and Sherr (2002) which argue that much ofthe detritus is consumed by bacteria, and this microbial production is linked with higher trophic levels.
The values of the pmf in each simulation can be interpreted as the percentage of resources that the predator can access in certain concentrations of total phosphorus, ranging from 9.3 % to 17.7 %. Our results (Table 2) show that an increase in TP concentrations causes an increase in the biomass of the planktonic community, while the pmf values diminish. These results allow inferring that high densities of planktonic organisms, as well as detritus, could be affecting the pmf for predatory copepods. Cyclopoid species feed on plankton, are aggressive predators of protozoa, rotifers, and small aquatic animals (Hutchinson, 1967). Probably, this type of selective feeding can be affected by high concentrations of dissolved particles in water. Ramírez Restrepo et al. (2015) have indicated that in this tripton system (dead organisms, detritus, and colloidal substances of organic or inorganic origin) and non-phytoplankton is the component that contributes most to the attenuation of downward irradiation, which suggests a high concentration of detrital particles. In contrast to other predator-prey models, where the top predator regulates the population densities of its prey or the availability of resources regulates the densities of consumers, in these simulations, resources and consumers can control organisms at each trophic level of food webs, simultaneously.
In general, simple models predict that primary consumers would increase in the absence of higher predators. Danielsdottir et al. (2007) argued that the zooplankton biomass is determined by the interaction between the food quality and zooplanktivorous activity. In our model, we include the coupling between grazing and detrital chains to better predict the structure of the planktonic community. We found that only primary consumers (Small cladocerans) increase with enrichment, even in the presence of the top predator (Cyclopoid). This increase depends on other factors such as the probability of an encounter with the prey. It can be interpreted as the efficiency of the biomass transfer to the top predator is different for each station in the reservoir.
Filtration feed of small cladocerans and their strategies to avoid predation, in combination with the refuge effect that the environment can offer, can keep the abundance of predators at the biomass ranges observed (Villabona-González et al., 2015). For instance, the feeding strategy of Bosmina dependent on the size ofprey, allows this cladoceran to access resources such as autotrophic and heterotrophic nanoflagellates. Experimental results obtained by DeMott (1982) confirm the efficiency of this feeding strategy of Bosmina compared to other cladocerans of larger size.
Despite that biomass of H and B were not evaluated for the sampling period (2010 and 2013), the magnitude of calculated biomass for these PFTs seems to be mostly in the order of104, being the H less abundant than B (Fig. 3, Table 2) . Here, we represent a causal relationship between B and H via the dependence of H on its prey. Likewise, prokaryotes respond to the supply of organic material, derived from the death of phytoplankton and the unconsumed particulate material of zooplanktivorous (Sherr and Sherr, 2002).
The average simulated biomass for B and H was less than 16 000 and 30 000 mg m-3, respectively (Table 2). We consider that these biomass values were relatively low since for the model we only considered the particulate organic carbon and not the dissolved carbon, product of algae and zooplankton excretion. Birge and Juday (1934) argue that in aquatic ecosystems the concentration of dissolved organic carbon can be 10 times greater than organic particulate carbon. We assume that detritus mineralization does not affect TP concentrations, which is not entirely true. These assumptions are often criticized in the literature because they ignore important aspects such as nutrient recycling. However, we include other aspects that are dynamically important in real trophic webs (and commonly ignored in other models) such as omnivory, detrital food chains, and energy flow from detrital channels to the highest trophic levels of the trophic network (Porter, 1996). The model presented here incorporates many of these characteristics that are difficult to take into account and, therefore, allows us the validation of previous predictions.
We assume 30 units of time (day) to reach the stability points of the system. During this period, the simulation of the biomass begins with the increase of the first levels of the trophic web (phytoplankton and detritus), followed by the main consumers of the detrital chain (B and H) (Fig. 3) . On the other hand, the zooplankton biomass exhibits a decrease in the initial concentration at the early evolution, and gradually increases as the links with detrital chain are accounted for (Fig. 3). This behavior of the simulation is inherent to the feedback that occurs in the dynamic system and to the input values of the initial biomasses.
The traditional approaches to the study of food webs emphasize the transfer of productivity in the form of living organic plant matter through trophic levels. However, dead organic matter is often overlooked as a food resource that modifies habitat conditions for some organisms. We develop an integrating framework to understand the impact of detritus on the structure and dynamics of food webs through its influences on the stability and persistence of the system.
The confidence of our results is supported by the range of data observed for TP concentrations at each station, and also, for the biomass of each group included in the model for the photic zone of the Riogrande II reservoir. However, some flows of potential dynamic importance for the diet of many primary consumers (such as allochthonous flows of organic particulate matter) were not taken into account, and neither environmental factors (such as turbulence or hydraulic retention time), which are determinant in phytoplankton production.
CONCLUSIONS
The proposed model for the Riogrande II reservoir is validated in a range of total phosphorus concentrations that represents the spatial variability of the photic zone, including observations from several previous studies. The results of the simulations allow us to conclude that the magnitude of the biomass obtained in the studies carried out between 2010 and 2013 (Palacio-Baena et al., 2013; Villabona-González, 2015; López-Muñoz, 2016) can be explained to a large extent by the causal relationships assumed in this model. We find that the main flows of the detrital food chain are determined by the interrelationship of the planktonic community of the photic zone in the reservoir. This effect is intensified by recognizing that this type of ecosystem generally receives additional amounts of organic matter from the basin, suggesting that dammed aquatic ecosystems are not only susceptible to enrichment by nutrients but also of organic matter. On the other hand, we include the hypothesis that biomass of top predators (Cyclopoids) is the result of the subsidized flows of the detrital food chain and the probability of an encounter of its prey, simultaneously. In correspondence, this model allows us to demonstrate that the dominance of Bosmina in the Riogrande II reservoir is due to its feeding strategy.

