


 English (pdf)
 Article in xml format
 Article references
 Send this article by e-mail
 Cited by SciELO
  Cited by Google
  Similars in
SciELO
Similars in
SciELO  Similars in Google
 Permalink
INTRODUCTION
Thalamic reticular nucleus neurons (TRNn) respond to inputs in two different activity modes called burst and tonic firing 1, 2, 3, 4. Burst mode is caused by dendritic activation of low threshold calcium currents (IT) during inhibitory inputs, and this is mediated by T-type calcium channels with the properties: low unitary conductance, fast inactivation, slow activation kinetics, negative steady-state inactivation at resting potential andresistant to dihydropyridme (DHP) 5, 6. The tonic mode is generated in response to excitatory inputs. Current IT is mediated by a specific low thres- hold calcium conductance (T-type conductance) and is expressed in various cells, tissues and organs of species with different ranges of internal temperature (ΔT) and maximum values of T-type conductance (GT). These include nervous tissue, smooth muscle, endocrine glands, sperm, kidneys, and heart 7, 8, 9. In the lateral geniculate nucleus of the cat, for example, GT= (8,4 +/- 0,9) nS/cm2 and ΔT = (36,9 - 38,0)°C10; in the thalamic ventrobasal nucleus of the rat, GT = (37600 - 38600) nS/cm2 and ΔT = (34,0-36,0)°C 11; in the dorsal root ganglion of the chick, GT = (0.020-0.025) nS/cm2 and ΔT = (40,8-41,6)°C12; in the dorsal root ganglion of the mouse, GT = 0,0072 nS/cm2 and 0,0057 nS/cm2, and ΔT = (36,5 - 38,0)°C13; and in human embryonic kidney 293 cells (HEK 293), GT = 0.009 nS and ΔT = (36,0 - 37,5)°C14.
Employing computational simulations, it was previously shown that bursts and tonic firings observed in a thalamic reticular nucleus (TRN) soma could be explained as a product of random synaptic inputs on distal dendrites 15. Tonic firings are generated by random excitatory stimuli, while two different types of stimuli generate burst firings: inhibitory random stimuli and a combination of inhibitory (from TRNn) and excitatory (from corticothalamic and thalamocortical neurons) random stimuli. Other studies have highlighted the importance of burst discharge parameters such as number and patterning of spikes, firing frequency, and rhythm of firing in transport and neuronal information processing 16, 17, 18, 19,20, 21, 22. The burst activity mode has an important effect on information processing in thalamocortical circuits during different physiological states, such as synchronized sleep and anesthesia 23, 24.
Commonly, intracellular recordings of electrical activity are conducted at room temperature and not at physiological temperature 25, 26, 27, 28, 29. Increases in the opening and closing rates of ion channels when temperature (T) rises 10°Cabove room temperature are expressed by the factor Q10, which is proportional to the activation energy 30, 31, 32, 33. However, it has been found that the effects of temperature on T-type Ca+2 channels are nonlinear 34, 35. Computational simulation offers multiple alternatives, not only for modifying electrical neuronal conduction properties, but also environmental conditions such as temperature 36, 37, 38, 39, 40. Accordingly, employing computational simulations, this study shows a nonlinear relation between the maximum burst firing frequency (fmax) observed in TRNn and the temperature at which it is produced on the one hand, and GT, on the other. For a given GT, the range of temperatures at which TRNn responds in burst mode also increases nonlinearly (exponential growth), both with its fmax and its GT conductance.
MATERIALS AND METHODS
In order to develop a realistic simulation, the use of a morphology (neuronal geometry) obtained from a neuronal reconstruction with real dimensions was considered, the application of stimulus that takes into account the random- ness of the amplitudes and durations of both inhibitory and excitatory stimuli originating in other TRNn and in collaterals of thalamocortical and corticothalamic neurons, respectively; and the biophysics that are incorporated by the model allow for reproducing different types of neuronal responses and their properties.
Then, the activity of TRNn was simulated using a computational tool, developed in NEURON simulation environment 41, 42, that incorporated morphological and electrophysiological data, and the stimuli properties. The following parts of this section describe in detail each one of these aspects and the methodology for analyzing burst responses of TRNn.
MORPHOLOGICAL DATA
The geometrical data (Table 1) were obtained from a neuronal reconstruction of an intact TRN cell with 80 compartments (figure 1A), from the ventrobasal regionofa rat 43. The data files were downloaded from the web page of the SenseLab Project 44.
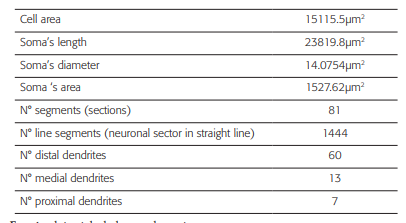
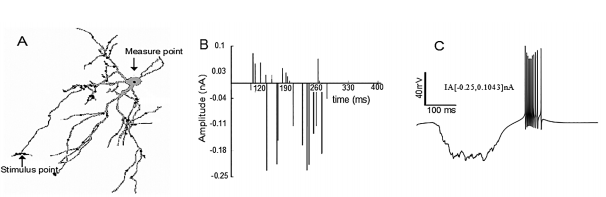
Figure 1 Burst simulation in the neuronal soma after trains of random stimuli were applied on the distal dendrites. Burst simulation in the neuronal soma after trains of random stimuli were applied on the distal dendrites. A) Note the measuring point (black arrow) on the soma and the stimuli points (gray dots) on the distal dendrites. B) The train of random current stimuli with negative and positive amplitudes. C) Burst neuronal response due to random stimuli in the amplitude range IA[- 0.25, 0.1043] nA applied to the distal dendrites. Note that the burst in C has the same characteristics of the typical burst (reference burst) shown in 43, 15.
ELECTROPHYSIOLOGICAL MODEL
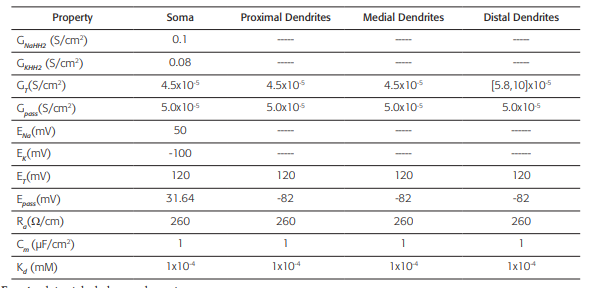
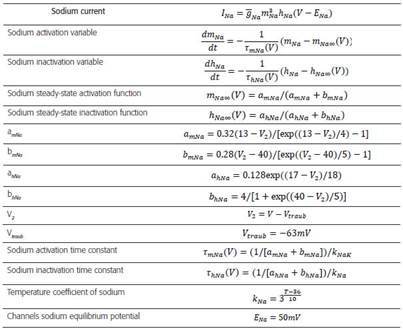
The biophysical model with high distal density of gT (Table 2) corresponds to a TRN cell from the ventrobasal region of a rat and it was obtained from 43. The data files were downloaded fromreference the web page of the SenseLab Project 44. Tables 3-6 include a summary of the main formulas used in reference 44 to develop the algorithms that model the biophysics of neurons TRNn.
Table 2 Active and passive electrical conduction properties of the neuronal model
Fuente: datos tabulados por los autores.
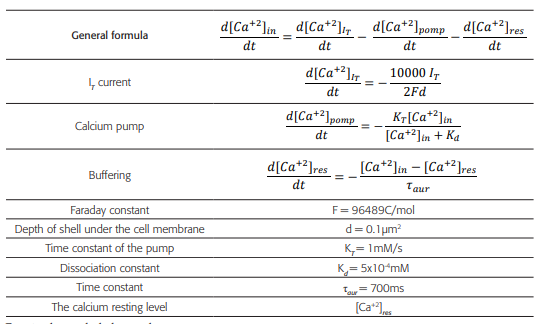
Table 3 Formulas and constants using to model the variations of the intracellular concentration of Ca+2
Fuente: datos tabulados por los autores.
Table 4 Formulas and constants used to model the activation processes of IT current
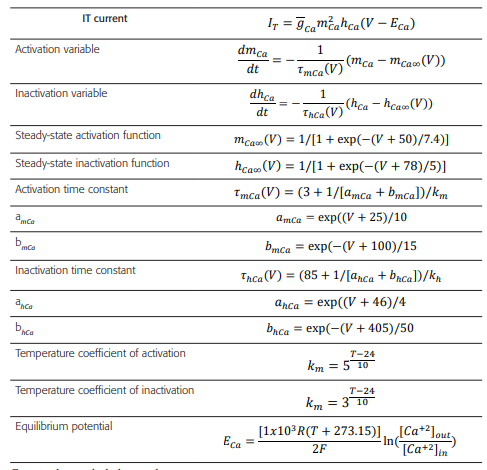
Fuente: datos tabulados por los autores.
STIMULI PROPERTIES
The typical bursts in the soma of the TRNn can be generated by joint trains of inhibitory and excitatory random stimuli in the distal dendrites 15. TRNns are continuously bombarded by excitatory stimuli from the collaterals of thalamocortical and corticothalamic neurons 45, 46, and by inhibitory stimuli of other TRNn 47. A dendrite can be stimulated by one or more inhibitory postsynaptic potentials (IPSP) and excitatory postsynaptic potentials (EPSP) resulting in a temporal and spatial summation into the same dendrite 48, 49. Thus, each dendrite can contribute with a depolarizing or hyperpolarizing potential directed toward the soma. The amplitude of this potential depends on the number of EPSPs and IPSPs that stimulate the dendrite, and in consequence, can be considered as a random event.
Then, the characteristics of all trains of stimuli were randomized following a uniform distribution and were estimated from the analysis of the results presented in references 47, 15. The amplitude of each stimulus (square pulses) was in the range [-0.25, 0.1043] nA, the duration of each stimulus was in the range [0, 1.0507] MS and the start time varied with in[80, 120] Ms. 25 pulses were applied with delays in the range from 0 to 12.4000 ms, obtaining a frequency of 0.1553 kHz.
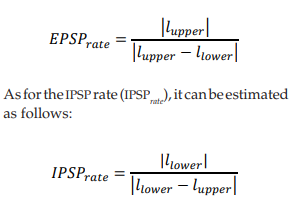
The simulation presented in this paper evaluates 60 distal dendrites, and a different train of random stimuli was applied to each one of them. The trains of stimuli have the same statistical properties, but each train has a different random seed. The amplitude and duration of the stimuli follow a uniform distribution between a lower limit (llower) and an upper limit (lupper). Then, if llower < 0 and lupper > 0, the EPSP rate (EPSP rate) can be estimated as:
METHODOLOGY FOR ANALYZING BURST RESPONSES OF TRNN
From the above parameters and using a NEURON simulation environment 41, 42, it follows that an applied alternative methodology could allow for an approximation of the way the TRNn, or any other type of neuron, respond to changes in body temperature. It could determine the relationship between the burst mode response frequency (f) of the TRN neuronal model (TRNnm) and physiological temperature (T) with specific GT values (figure 2A).
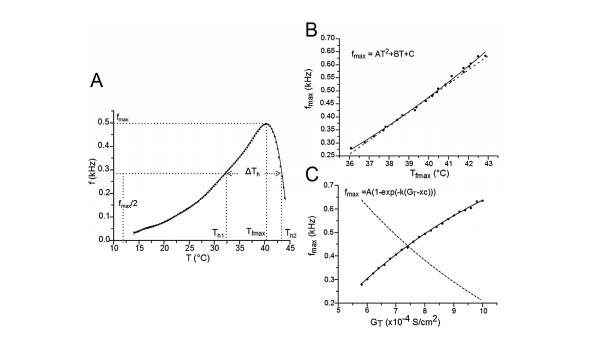
Figure 2 Frequency changes (f) during burst mode responses for different GT values. A) The variation of f for GT = 8x10⁻⁴ S/cm2 and for different temperatures was fitted to a polynomial equation. For other values of GT, the equation fitting was similar. Th1 and Th2 are the temperatures at which the TR- Nnm responds in burst mode with a frequency equal to half the maximum frequency (f = fmax/2). ∆Th= Th2 - Th1. Tfmax is the temperature at which the TRNnm fires in burst mode at maximum frequency. For any value of GT, this curve always shows a negative asymmetry. B) Relationships between fmax and Tfmax. The points (fmax,Tfmax) on the solid line were fitted to a growth quadratic equation (Eq. 1). C) Nonlinear relation between fmax and GT. The points (fmax,GT) on the solid line were fitted to a growth exponential equation. The dashed lines in B) and C) represent the first derivative of equations 1 and 2, respectively.
This geometrical model was obtained from reference 44. The cell area using the procedure described in 52
This biophysical model was obtained from reference 44. GNaHH2: Maximum specific Sodium conductance; GKHH2: Maxi- mum specific Potassium conductance; GT: Maximum specific lowthreshold calcium conductance (for the distal dendrites, this values varies in a range [5.8, 10] x10-4 S/cm2); Gpass: Specific leak conductance; ENa: Sodium equilibrium potential; EK: Potassium equilibrium potential; ET: Calcium equilibrium potential; Epass: Leak equilibrium potential; Ra: Axoplasmic resistance; Cm: Specific membrane capacitance; Kd: Dissociation constant (assuming a Michaelis-Menten approximation for a simple model of ATPase calcium pump). The dashed line indicates the absence of the property.
RESULTS
The results of this work are focused, first, on the analysis of the relationships between fmax in burst mode and the corresponding temperatures (see Figure 2B). Second, the results are focused on fmax and the GT at which it was obtained (see Figure 2C). Third, they are centered on the relationship between ΔTh and the corresponding fmax values (see Figure 3A), and the relationship between ΔTh and GT (see Figure 3B). ΔTh is a parameter proportional and representative of the temperature range at which TRNn can respond in burst mode (see Figure 3A).
Figure 2A shows the relationship between the burst mode response frequency(f) of the TRNnm and physiological temperature (T) for GT = 8 S/ cm2, and for a temperature range in which burst discharges were observed. Th1 and Th2 are the temperatures at which the TRNnm can respond in burst mode with a frequency equal to half the maximum frequency (i.e. f = fmax/2). ΔTh = Th2 - Th1 is full width at half maximum. Tfmax is the temperature at which the TRNnm fires in burst mode at maximum frequency. It was found that for any GT value in the range of 5,8,10 S/ cm2, the curve fitted to points (f,T) is always biased to the left (negative asymmetry) in a maximum temperaturerange 12,44 °C, and the fitted equations were degree 10 polynomials. All the parameters that generated the results of this work were based on the development of graphics similar to Figure 2A (f vs. T) and for different GT values in the aforementioned range.
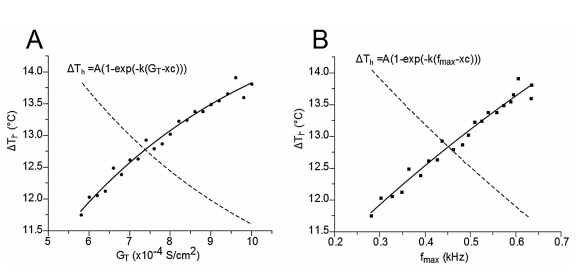
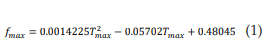
Figure 3 Relationship between the representative temperature range (∆Th) at which the TRNnm responds in burst mode, the maximum calcium conductance (GT), and the maximum burst frequency (fmax). In both cases, A) and B), the points of the curves are fitted to an exponential growth equation.
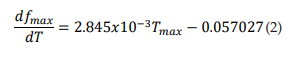
The solid line in Figure 2B shows the relation between fmax and Tfmax and its points fitted to a growth quadratic equation (Eq. 1, with R2= 0.99623).
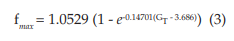
The dashed line in Figure 2B represents the first derivative of equation 1 (see eq. 2). It shows that as temperature rises, the maximun burst mode firing frequency per unit temperature of the TRNnm increases in linear and growing form. Thus, for example, at T = 37°C, f max increases by 1 kHz for each temperature increase of 1°C; and at T = 40°C, fmax increases by 1354 kHz for each temperature increase of 1°C. 2.485x10⁻³ Hz/°C/°C represents the slope of the line and shows the steady increase of dfmax/dT per unit temperature increase, i.e., dfmax/dT increases by 2.485 x10⁻³Hz/°C for each temperature increase of 1°C.
The points (fmax, GT) were also fitted to a growth curve, but in this case following an exponential relation (eq. 3, with R2 = 0.99901), as shown by Figure 2C. 1.0529 kHz represents the maximum value that fmax can reach no matter how high the GT is. In equation 3, it can be seen that this saturation value is obtained for very large values of GT (if GT approaches infinity). However, this TRNnm can only respond with typical burst activity for the range of conductance’s [5.8, 10] S/cm2.
The dashed line in Figure 2C corresponds to the first derivative of equation 3 (see eq. 4). It shows that as GT increases, the maximum frequency changes observed in the TRNnm decrease exponentially, i.e., dfmax/dGT decreases if GT increases, and tends to zero if GT tends to infinity. For example, for GT = 6x10⁻⁴ S/cm2 , dfmax/dGT decreases by 0.11 kHz/(1x10-4 S/ cm2 ) for each unit increase (1x10⁻⁴ S/cm2 ) in maximum Ca+2 conductance. For GT = 8x10⁻⁴ S/cm2 , fmax decreases by 0.08 kHz/(1x10-4 S/ cm2 ) for each GT increase of 1x10⁻⁴ S/cm2 .
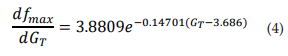
Figure 3A shows the relationship between ΔTh and GT. The points (ΔTh , GT) were fitted to a growth exponential equation (eq. 5, with R2 = 0.97859). with the maximum value ΔTh =15.321°C. This was expected since, despite being different equations, the same ΔTh maximum values should be observed.
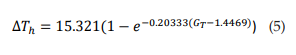
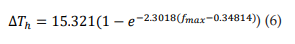
Figure 3B shows the relationship between ΔTh and fmax. The points (ΔTh , fmax) were fitted to a growth exponential equation (eq. 6, with R2 = 0.96501). 15.321°C represents the maximum value that ΔTh can reach independently of the f max value.
This saturation value occurs if fmax tends to infinity
From equations 5 and 6, it can be observed that fmax = 0.086 kHz and GT = 6.37 S/cm2 represent the values at which ΔTh reaches a value equal to 63% of its maximum possible value (15.321°C), i.e. ΔTh = 9.65°C.
DISCUSSION
The physiological temperature of mammals may vary depending on different normal or pathological causes 50. However, the electrical response of the different types of neurons to normal and pathological temperature variations is not fully understood 51. This study presents a novel methodological alternative based on computational simulations, which allows for predicting the way different types of neurons respond to changes in body temperature. The following parameters were defined for each frequency (f) versus temperature (T) graphic with specific GT values: full width at half maximum (ΔTh ) as a measure of the temperature range at which a neuron responds in burst mode, fmax, and the temperature at which this frequency occurs (Tfmax). Next, based on the development of this same graph for different GT values, graphics 2B, 2C, 3A and 3B were obtained.
The results of this study are a faithful approximation to reality due to four main reasons. First, the use of a morphology (neuronal geometry) obtained from a neuronal reconstruction (intact TRN cell with 80 compartments) that entails real dimensions. Second, the biophysics incorporated to the model allows reproducing different types of neuronal responses and their properties. Third, the applied stimulus takes into account the randomness of the amplitudes and durations of both inhibitory and excitatory stimuli originating in other TRNn and in collaterals of thalamocortical and corticothalamic neurons, respectively.
Fourth, consistent with previous experimental studies, this study found that the effects of temperature changes in T-type Ca+2 channels are nonlinear (see Figures 2, 3 and equations 1, 3, 5 and 6).
All results obtained in this work correspond to a specific TRNnm. Nonetheless, T- type Ca+2 channels cause the observed bursting activity. The following observations highlight some of the most relevant results of this study and their electrophysiological implications.
Figure 2B and Equation 1 show that for a constant conductance, increases in physiological temperature cause an increase in the maximum firing frequency and the effect is greater for higher temperature values. Although the quadratic growth model shown in figure 2B and equation 1 suggests that there is no fmax limit for any temperature increase, figure 2C and equation 3 show that for high GT values, maximum firing frequency of the TRNnm always tends to an fmax limit.
For the model used in this work, the limit tends to fmax = 1.0529 kHz The results in Figure 2 show that the development of computational neuronal models incorporating reality-adjusted biophysics and geometry, can contribute to predicting the behavior of a neuron for different T-type calcium conductances and physiological temperatures.
The curves fitted to Figures 2B and 2C (see equations 1 and 3, respectively) have determination coefficients very close to a unit (R2 =0.996), which shows the reliability of the model. Figure 3A and equation 5 show that if TRNn display bursting activity with high fmax values, then they can display such responses through a wide range of temperatures. In addition, Figure 3B and equation 6 show that if bursting activity caused by T-type calcium conductances for high GT values is observed in a neuron similar to TRNn, then it can exhibit this kind of response through a wide range of temperatures. Specifically, the proper functioning of T-type Ca+2 channels after broad physiological temperature variations (increase or decrease) depends on GT. From Equations 5 and 6, it can also be inferred that if GT = 6.37 S/cm2 and bursting activity is observed at a maximum frequency of 0.086 kHz, then this neuron can exhibit the same type of activity through a range of temperatures ΔTh > 9.65°C.
CONCLUSIONS
Based on a computational TRNnm that responds in burst mode due to the application of the same type of random stimulus (see Figure 1) at different points of the distal dendrites, it can be concluded that: First, for constant GT, the maximum firing frequency of TRNn varies proportionally and in quadratic relation to the temperature at which it occurs (see Equation 1). This equation shows that for the same specific T-type calcium conductance, increases in physiological temperature cause an increase in the maximum firing frequency and the effect is greater for increments in temperature values. Second, the maximum frequency at which TRNn respond in burst mode varies proportionally and in exponential growth relation to the maximum Ca+2 conductance (see Equation 3). This equation shows that for increments in the values of GT, the maximum firing frequency always tends to an fmax limit. Third, ΔTh is a representative value of the temperature range (ΔT) at which specific TRNn respond in burst mode, and its relation to the maximum firing frequency in burst mode (ΔTh vs. fmax) was fitted to an exponential growth (see Equation 6). This equation shows that if specific TRNn display bursting activity with fmax values, they can also display this type of behavior through a wide range of temperatures. Finally, and similar to the above relationship (ΔTh vs. fmax), ΔTh vs. GT was fitted to an exponential growth equation (see Equation 5). This equation shows that the proper functioning of T-type Ca+2 channels after broad physiological temperature variations depends on GT

