


 English (pdf)
 Article in xml format
 Article references
 Send this article by e-mail
 Cited by SciELO
  Cited by Google
  Similars in
SciELO
Similars in
SciELO  Similars in Google
 Permalink
INTRODUCTION
Middle-aged and older adults often mistakenly underestimate the risk to which they are exposed when they engage in risky sexual behaviors, such as having multiple sexual partners, sex without condoms, and not being screened for sexually transmitted infections (STIs) 1. Factors specific to these population groups increase their susceptibility to acquiring STIs, such as a weakened immune system 2, vaginal dryness and atrophy in women due to a decrease in estrogen 3, increasing the probability of presenting lesions during sexual intercourse; weak erections due to low testosterone levels in men, among others 4.
According to data from the Centers for Disease Control and Prevention (CDC), from 2014 to 2018, the number of new cases of chlamydia, gonorrhea, and syphilis increased in middle-aged and older adults; chlamydia from 60 175 to 91 756; gonorrhea from 33 469 to 72 646; and syphilis, from 5 797 to 9 454; respectively 5. Regarding human immunodeficiency virus (HIV), in 2018, 12 041 new diagnoses were reported 6.
Perceived risk is a factor that has received attention as an important predictor of risky sexual behavior; although perceived risk is not sufficient for behavior change, it is necessary. Theoretical frameworks such as the Health Belief Model and Protection Motivation Theory argue that risk perception is necessary to understand why people engage in behaviors that result in harm to their health. Research that focuses on STI prevention generally assesses the perceived risk of acquiring STIs 7.
Given the importance of risk perception in the prevention of risky sexual behavior, its measurement is both critical and complex. Available measures generally focus on a single element, and by expressing themselves in a single item, they reduce the content and meaning of the construct itself. No tools were identified that capture the perceived risk of STIs 7. Instruments that extend its scope and meaning by more comprehensively representing the term STI Risk Perception are indispensable.
Recognizing the need for a more comprehensive instrument, the Napper, Fisher, and Reynolds Perceived HIV Risk Scale was adapted 7, which assesses: (a) the person's analytic and deliberative judgment of how likely he or she is to acquire HIV (cognitive process); (b) the emotional response to feeling vulnerable to HIV, intuitively based on affect; and (c) the relevance or importance of the risk to HIV, including how often the risk is thought about. his scale was modified by replacing the word HIV with STI.
In addition, as mentioned, middle-aged and older adults have low or no perceived risk of acquiring an STI 1,8. Authors such as Fileborn et al. have found that middle-aged and older adults consider STIs to be exclusive of young people 9. Therefore, it was considered important to know the perceived risk of STIs among middle-aged and older adults in our geographic area, in order to identify the perceived risk of STIs as a possible factor to intervene or include in the development of STI prevention programs focused on middle-aged and older adults.
The purpose of the reported study was to validate the structure of the "Perceived Risk of STIs Scale" in middle-aged and older adults, identify their perceived risk to STIs, and identify their relationship with some sociodemographic characteristics.
METHODS
Study Design
An instrumental study was carried out to evaluate the psychometric properties of the STI Perceived Risk Scale. The purpose of instrumental designs is to support the development of evaluation tests, in their design or adaptation, through the study of psychometric properties, validity, reliability, factor analysis 10.
Sample and Sampling
The sample consisted of 295 middle-aged and elderly adults. For the sample size, it was thought to obtain the highest proportion of cases per variable to try to avoid confirming factors that were specific to a sample with little generalizability 11. Virtual online sampling was used using the social network Facebook® and the QuestionPro® platform for the development of the online questionnaire; virtual online sampling is ideal for recruiting participants and collecting data on sensitive topics such as sexual behavior and related aspects 12.
Inclusion Criteria
Men and women aged 50 years and older, heterosexual, with vaginal, anal, or oral sexual activity in the last 12 months, residents of the state of Nuevo León, Mexico, were included. Other types of sexual orientation, such as men who have sex with men, were not included because their perceived risk of STIs may be different from that of a heterosexual person; MSM are considered key groups because of their high risk of STIs from anal sex.
Measurements
For the measurement of perceived risk to STIs, the HIV perceived risk scale was adapted and subjected to the back translation method 13, with the prior authorization of the authors 7. The adaptation consisted of substituting the word HIV for the word STI, so that the scale would capture the perceived risk of acquiring an STI and not only HIV. Like the original scale, the adapted scale consists of 8 items divided into three dimensions. The affective dimension consists of items 1, 2, and 5; the cognitive dimension includes items 4, 6, and 7; and the relevance dimension includes items 3 and 8. Item responses are presented on a Likert-type scale, where, in some questions, several answer options give the participant the same score.
Total scale scores ranged from 10 to 40 points, the higher the score, the higher the perceived risk. he scale was developed to measure perceived HIV risk in Black, White, Hispanic/Latino, Asian/ Pacific Islander, and Native American adults, with acceptable validity fit indices (GFI = 0.94, RMSEA = 0.087, X2= 242.0) (7). Quartiles were used as a first approach to obtain the cut-off points of the scale. The first quartile (<19 points) indicated low perceived risk; the second and third quartiles (>20 - <28 points), medium perceived risk; and the fourth quartile (>29 points), high perceived risk.
Data Collection
The collection was carried out between August and November 2020. To recruit participants, a Face-book® page was created with the name of the project and the promotion of the page was contracted on that social network. Facebook® promoted the page among people of the age and location of interest. On the page, people found a detailed description of the project and the link to the survey, and they could request more information if they required it. People interested in participating accessed the survey link, where they previously found the informed consent, had to read it, and agree to participate in order to continue. Then, they found all the questions of the survey. Participants were included in a drawing for airtime recharges as a thank you for their participation. The QuestionPro® program randomly provided coupons with the prizes. The coupon told the participant how to redeem their prize.
Data Analysis
Descriptive statistics, frequencies, and percentages for qualitative variables and measures of central tendency for quantitative variables were used to determine the sociodemographic characteristics and perceived STI risk of the participants. he quartiles of the final score of the scale were calculated in order to have a first approach to the cut-off points of the STI perceived risk scale.
Confirmatory factor analysis (CFA) was performed using AMOS version 24 statistical software to analyze the factor structure of the STI perceived risk scale. The main goodness-of-fit indices were considered to evaluate the proposed models: chi-square (x2), degrees of freedom (gl), Comparative Fit Index (CFI), Goodness of Fit Index (GFI), Tucker Lewis Index (TU), root mean square error of approximation (RMSEA). The criteria for adequate fit were: X2 not significant, adequate values for CFI, GFI, and TLI should be equal to or greater than .90; and less than .05 for RMSEA to be considered adequate; between .05 and .08, acceptable; and above .10, for poor fit 14,15.
The evaluation of the reliability of the scale was carried out using Cronbach's Alpha coefficient (a), which determined the internal consistency of the scale and its factors. Finally, a chi-square test was performed to identify the association between the sociodemographic characteristics of the participants and the perceived risk of STIs.
Ethical Considerations
The research was ethically based on the regulations of the Ley General de Salud en Materia de Investigación para la Salud16. This law establishes that, at all times, health research must address ethical aspects that guarantee the dignity and well-being of the persons subjected to the research. In addition, a favorable opinion was obtained from the Research Committee and the Research Ethics Committee of the School of Nursing of the Universidad Autónoma de Coahuila. Informed consent was obtained from the participants through the QuestionPro® platform, in the survey link, the participant previously found the informed consent form, which they had to read and agree to participate in order to answer the survey.
RESULTS
Characteristics of the Participants
The mean age of the participants was 50.02 years (SD = 5.98), female sex predominated (65.1%, 192), with respect to marital status, 43.4% (128) were married, 19.3% 57 lived in a common-law relationship, and 13.2% (39) were single. In terms of schooling, the prevailing level of education was bachelor's degree or engineering with 24.4% 72, followed by high school with 23.7% 70. In regard of economic income, 28.5% 84) of the participants reported a monthly income of between 5,000 and 10,000 Mexican pesos.
Perceived Risk of STIs
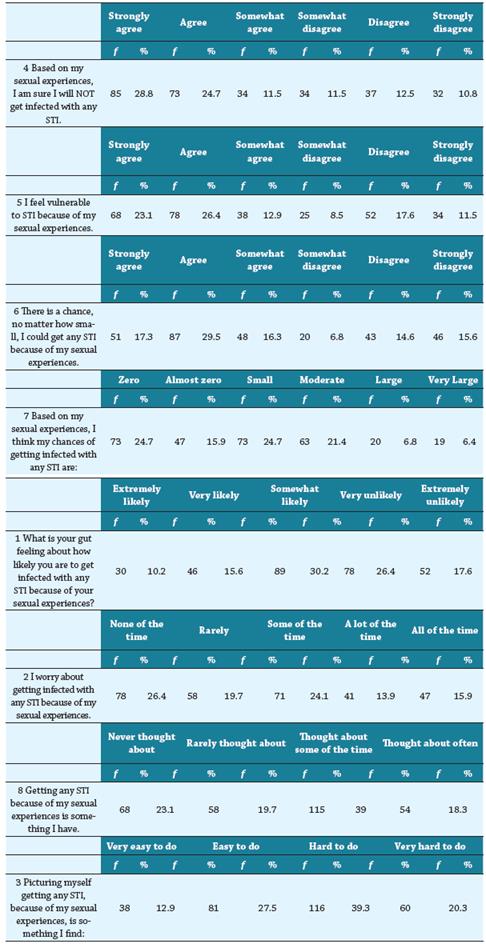
Table 1 shows the descriptive statistics for the scale of perceived risk to STIs, showing that 28.8% 85 strongly agreed and 10.8% 32 strongly disagreed that, based on their sexual experiences, they are sure they would not be infected with any STI. 23.1% 68 expressed strongly agree and 11.5% 34 strongly disagreed that, they feel vulnerable to STIs because of their sexual experiences. 17.3% 51 indicated strongly agree and 15.6% 46 strongly disagreed that, there is a chance, no matter how small, that they could get any STI because of their sexual experiences. 24.7% 73 expressed as zero and 6.4% 19 as very large, the chance of getting any STI.
When asked what their gut feeling is with regards on how likely they are to get infected with any STI because of their sexual experiences, 10.2% 30 felt it was extremely likely and 17.6% 52 considered it extremely unlikely. 15.9% 47 of participants worry all the time about getting infected with any STI, while 26.4% 78 have not worried about it at all. Getting any STI is something that 18.3% 54 have thought about often and 23.1% 68 have never thought about. 12.9% 38 considered it very easy to picture themselves getting any STI, while 20.3% 60 considered it very difficult to imagine (Table 1).
The mean of the perceived STI risk index was 46.79 (SD = 21.46). Quartiles were used as a first approach to obtain the cut-off points of the scale. The first quartile (<19 points) indicated low perceived risk; the second and third quartiles (>20 - <28 points), medium perceived risk; and the fourth quartile (>29 points), high perceived risk. 28.1% 83 of the participants presented low perceived risk; 46.8% 138, medium perceived risk; and 25.1% 74, high perceived risk.
Confirmatory Factor Analysis
The goodness-of-fit indices of the model, according to the structure proposed by Napper, Fisher, and Reynolds7 (Figure 1) met the required values (x2= 48.283, p <.0Q1; CFI = .962, RMSEA = .079, GFI = .963, TLI = .938). The only unacceptable value in that model was X2 being significant, which could be attributable to the fact that it is highly sensitive to sample size (Table 2).
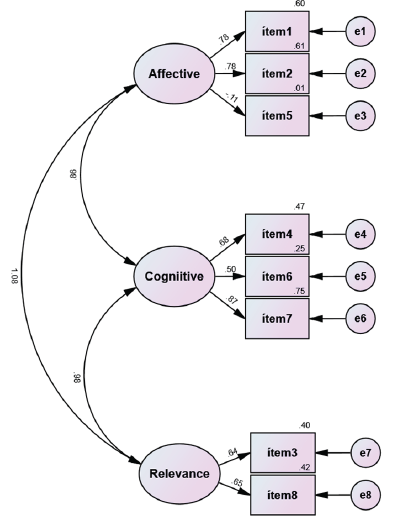
Table 2 Fit indices of the proposed model
| Models | X2 | df | p | CFI | GFI | TLI | RMSEA |
|---|---|---|---|---|---|---|---|
| Model 1 | 48.283 | 17 | <.001 | .962 | .963 | .938 | .079 |
Note: X 2 = chi square, df = degrees of freedom, p = significance value, CFI = Comparative Fit Index; GFI = Goodness of Fit Index; TLI = Tucker Lewis Index; RMSEA = root mean square error of approximation
The three factors of the scale and their component elements are shown below. It can be observed that items five and six presented the lowest loadings. his may be attributable to the fact that these were the items in which the participants reported the highest perceived risk of STIs, i.e., the frequencies of the response options agree and strongly agree, specifically, were higher in these two items compared to the rest of the items of the scale (Table 3).
Table 3 Factor loading and R2 of the proposed model
| Factor | Item | Model 1 | |
|---|---|---|---|
| Loading | R2 | ||
| Affective | 1. What is your gut feeling about how likely you are to get infected with any STI because of your sexual experiences? | 1.000 | .601 |
| 2. I worry about getting infected with any STI because of my sexual experiences. | 1.162 | .608 | |
| 5 I feel vulnerable to STI because of my sexual experiences. | .197 | .011 | |
| Cognitive | 4. 4 Based on my sexual experiences, I am sure I will NOT get infected with any STI. | 1.000 | .469 |
| 6. here is a chance, no matter how small, I could get any STI because of my sexual experiences. | .735 | .251 | |
| 7. Based on my sexual experiences, I think my chances of getting infected with any STI are: | 1.086 | .749 | |
| Relevance | 3. Picturing myself getting any STI, because of my sexual experiences, is something I find: | 1.000 | .405 |
| 8. Getting any STI because of my sexual experiences is something I have. | 1.127 | .422 | |
Note: R 2 = Squared multiple correlation
Reliability
The results of the internal consistency analysis of the total scale were acceptable. A Cronbach's alpha of .80 was obtained; however, for each of the factors, Cronbach's alphas were below the total alpha, with the lowest alphas being found in the two dimensions that were composed of one of the two items in which participants reported the highest perceived risk (items five and six).
Association Between Sociodemographic Characteristics and Perceived Risk of STIs
To determine the association between age group, sex, marital status, schooling, and economic income and perceived risk of STIs, contingency table analyses were performed using the chi-square test. The only association was found between marital status and perceived risk to STIs (X2 = 27.52, p <0.01).
No association was found between sex and perceived risk, however, the mean of the index of perceived risk to STIs was higher in women (48.05, SD = 22.44) than in men (44.43, SD = 19.38). 28.12% 54 of women and 19.41% 20 of men had high perceived risk, and 26.04% 50 and 32.03% 33, respectively, low perceived risk.
Among married participants, with levels of schooling ranging from high school to technical career, and in the different economic income ranges, medium levels of perceived risk predominated, followed by low levels, and, finally, high levels. In single, divorced, widowed, and separated participants, medium levels of perceived risk also predominated, followed by high levels of perceived risk.
DISCUSSION
The main objective of this study was to validate the structure of the "Perceived STI Risk Scale" in middle-aged and older adults. The results indicate that the scale is reliable and valid for measuring the perceived risk of STIs in middle-aged and older adults. By substituting HIV for STIs in the items of the instrument, a scale was developed to assess the person's perceived risk of acquiring an STI. The obtained Cronbach's alpha supports the reliability or internal consistency, that is, that all the items of the instrument consistently measure the concept 13. The model showed an adequate adjustment of the proposed structure, composed of the affective, cognitive, and relevance factors.
One contribution of this study is to demonstrate the accuracy of the scale in measuring the perceived risk of STIs. In contrast to previous literature with a stricter definition of perceived risk of STI 1,14, measured by a single item, this study assessed several elements that make up the perceived risk. The results of perceived risk prevalence are not consistent with the aforementioned studies, where low or no perceived risk has been found in the majority of participants; in this study, low perceived risk was identified in less than one third of the participants. This difference may be attributable to the measurement of perceived risk by a single item in previous studies.
There was also a difference in sex and perceived risk. More women were found to perceive themselves to be at medium or high risk as compared to men, which is not consistent with the sex and perceived risk differences reported by Syme et al,1 who found that the percentage of men who perceived themselves to be at risk was higher than women.
Although the model had an adequate fit, items five and six had low loadings, perhaps because they were the items in which participants reported the highest perceived risk of STIs. When asked if they felt vulnerable to getting an STI because of their sexual experiences (item 5), and if they believed that there was a chance, no matter how small, that they could get any STI (item 6), the frequencies of the response options agree and strongly agree were higher compared to the rest of the items of the scale.
The term vulnerable (item 5) seems to have a different meaning for the participants, since their response is very different when asked about how likely they think they are to get any STI. A similar situation was found by Napper and Fisher7 , when they asked participants to rate how vulnerable they felt to HIV infection and how likely they were to get HIV because of their sexual experiences. More than half of the participants agreed that they were vulnerable to HIV infection, but only one-third said they were likely to get HIV.
Item 6 takes into account the person's perceived chances of getting an STI, however small they may be. If the person perceives a minimal risk, however small it may be, he/she will respond that he/she agrees or strongly agrees. Therefore, it is believed that the highest frequency was found in these response options and, therefore, a lower loading of the item, because of the difference in the responses given by the participants in this item compared to the rest of the items of the scale.
CONCLUSION
In conclusion, the scale of perceived risk of STIs is a reliable and valid tool for measuring the perceived risk of STIs in middle-aged and older adults. Future research is considered important to clarify the meaning of feeling vulnerable and to test the scale to measure perceived risk to STIs indiverse populations. Adequate measurement is considered important to accurately examine the relationship between perceived risk and behavior.
Limitations should be kept in mind when interpreting and evaluating the results. This was a cross-sectional study using a convenience sample of the general population of middle-aged and older adults residing in two states of Mexico. Recruited through online virtual sampling from a social network, excluding those who did not have access to a mobile device, or the social network of choice.

