


Services on Demand
Journal
Article
 English (pdf)
 Article in xml format
 Article references
 Send this article by e-mail
Indicators
-
 Cited by SciELO
 -
 Access statistics
Related links
-
 Cited by Google
 -
 Similars in
SciELO
Similars in
SciELO -
 Similars in Google
Share

 Permalink
Ingeniería e Investigación
Print version ISSN 0120-5609
Ing. Investig. vol.28 no.1 Bogotá Jan./Apr. 2008
Saad Bakkali1 y Lahcen Bahi2
1 Geophysics Engineer, Institut Physique du Globe Strasbourg, Universidad Louis Pasteur, Strasburg. Profesor, Mohammadia School of Engineers. Rabat, Marruecos. Geosciences & Environment Group, Faculty of Sciences & Techniques, Tangier, Morocco. saad.bakkali@gmail.com, saad.bakkali@menara.ma.
2 Geology Engineer, Mohammadia School of Engineers, Ph.D. in Applied Geophysics, Institut Physique du Globe Strasbourg, Universidad Louis Pasteur, Strasburg. Profesor, Mohammadia. Mineral Engineering Department, School of Engineers. Rabat, Marruecos.
ABSTRACT
This paper focuses on presenting a method which is able to filter out noise and suppress outliers of sampled real functions under fairly general conditions. The automatic optimal spline-smoothing approach automatically determines how a cubic spline should be adjusted in a least-squares optimal sense from an a priori selection of the number of points defining an adjusting spline, but not their location on that curve. The method is fast and easily allowed for selecting several knots, thereby adding desirable flexibility to the procedure. As an illustration, we apply the AOSSA method to Moroccan resistivity data phosphate deposit disturbances map. The AOSSA smoothing method is an efficient tool in interpreting geophysical potential field data which is particularly suitable in denoising, filtering and analysing resistivity data singularities. The AOSSA smoothing and filtering approach was found to be consistently useful when applied to modeling surface phosphate disturbances..
Keywords: smoothing, automatic, spline, resistivity, Schlumberger, phosphate, Morocco.
RÉSUMÉ
Dans le présent travail, nous présentons une nouvelle méthode de débruitage et de filtrage utilisant des fonctions analytiques échantillonnées. A partir dun échantillon de points dajustement de la fonction spline utilisée, la méthode dite «Automatic Optimal Spline Smoothing Approach » ou AOSSA permet de déterminer automatiquement lajustement par fonction spline dordre 3 au sens des moindres carrés, sans pour autant connaître la localisation des points de léchantillon sur la courbe. Cette méthode rapide permet facilement de choisir différents points de lissage avec une certaine flexibilité de la procédure. En guise dillustration nous avons appliqué la méthode AOSSA à la carte des données danomalies de résistivités correspondantes aux « dérangements » des phosphates marocains. La méthode de lissage et de filtrage AOSSA sest avérée être un outil potentiellement efficace pour loptimisation des surfaces correspondantes aux zones des « dérangements » des phosphates marocains.
Mots clés: résistivité, spline, optimal, lissage, phosphate, « dérangement », Maroc.
Recibido: diciembre 04 de 2007
Aceptado: febrero 21 de 2008
Introduction
Experimental geosciences often require a set of measured data to be represented in the form of a smooth curve from which desirable parameters or attributes are to be extracted. Sharpening and edge-enhancement filters are thus often applied to geophysical data which has been collected with uneven sample spacing. The first step in any processing of such geophysical data is therefore the cleaning up of noise in a way that preserves the signals sharp variations. The literature contains several methods which try to filter and/or smooth data (Dierckx, 1993; Berghaus, 2001). The natural question lies in how we should choose the interpolating points from the data so as to construct the desired smoothing function. These points are normally extracted from the data in a regular fashion or are manually selected. The automatic optimal spline-smoothing approach (AOSSA) represents an alternative methodology to the usual gridding/digital filtering processing pathway (Koo, 1997; Lee, 1999, 2000, 2002) whose recent developments have fascinated the scientific, engineering and mathematics community with its versatile applicability. The AOSSA method optimally selecting points to define a cubic spline which best represents the data in the least-squares sense is proposed and applied to a Moroccan resistivity data phosphate deposit disturbances map. The AOSSA is constructed to optimise some property regarding the resistivity anomalous phosphate map such as smoothness. This paper proposes optimising the responses of the filtered Moroccan resistivity data phosphate deposit disturbances map. AOSSA has thus become a powerful signal and image processing tool used for filtering geophysical data.
The geophysical context
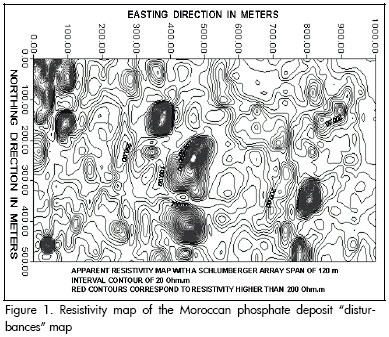
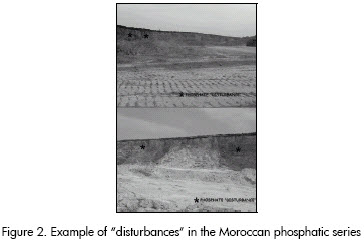
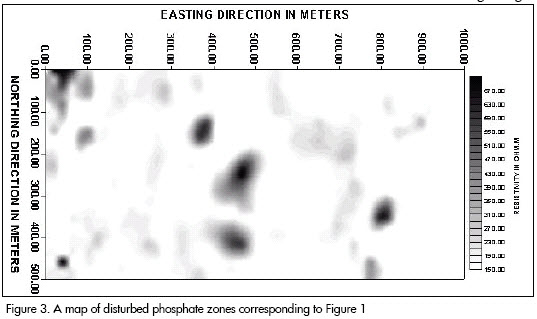
The resistivity map (Figure 1) obtained from a Moroccan survey was considered to be a map of discrete potentials on the free surface and any major singularity in apparent resistivity due to the presence of a perturbation would be due to crossing from a normal to a perturbed area or vice versa (Bakkali, 2005) (i.e. the apparent resistivity map has been considered to be a map of scalar potential differences assumed to be harmonic everywhere except on the disturbed areas). Interpreting resistivity anomalies consisted of extracting information regarding the position and composition of a target mineral body in the ground. The targets were the inclusions called perturbations or disturbances (Figure 2). An anomalys amplitude was assumed to be proportional to the volume of a target body and to resistivity contrasting with the mother lode. If a body has the same resistivity as the mother lode then no anomaly would be detected (Bakkali, 2006). Thus it was assumed that resistivity anomalies would be representative of local density contrast between any disturbance and the mother lode. Level disturbance of the anomalous zones is proportional to resistivity intensity (Bakkali, 2005, 2006) (Figure 3).
Resistivity data collected in a survey are often contaminated with white noise and artifacts coming from various sources. The presence of white noise in data resistivity distorts the characteristics of the geophysical signal, resulting in poor quality of any subsequent processing. The AOSSA method is a widely used technique which is applicable to smoothing geophysical map data. All that is needed is a criterion for separating the noise component from the total signal, leaving one with the true or smoothed data.
The automatic optimal spline-smoothing approach (AOSSA)
Formulation
Consider noisy data Ω = {(xi, yi)  R2 | j = 1,..., M} to be the number of interpolating points and Γ = {(Xi, Yi) R2 | Xj-1 ≤ Xj, j = 1,..., M} be the set of these points sought on the cubic spline. The 2N-variable must be solved to obtain the best set Γ in the least-squares sense.
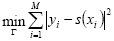
where is the cubic spline defined by Γ, XL ≥ mini xi and XN ≤ maxi. The Gencan optimisation method was applied to resolve this problem (Birgin and Martínez, 2002) which is an active-set method for smooth box-constrained minimisation. The method combines an unconstrained method, including a line search which aims to add many constraints to the working set at a single iteration by using a recently introduced technique (spectral projected gradient) for dropping constraints from the working set. As usual, the optimisation process needs an initial approximation. We chose an initial set composed of N regularly sampled pairs in the originally given set Ω; i.e. (Xi, yj) = (xi, yj), with 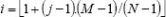 for j = 1,...,N where
  denotes the greatest integer less than or equal to p. No con-sideration has been made regarding how to choose the number of interpolating points. The method is designed to automatically find, in the least-squares sense, the best cubic spline for the specified number N (Rupert et al.., 2000). For a small number of points N the obtained spline will not be able to represent more than the curves general trend (Rupert et al.., 2002). For large values of N, the spline will tend to fit even the outliers. Since the method is fast, it is reasonable to estimate the cubic spline for several choices of N (Biloti et al.., 2003; Wand, 2003). Such flexibility can be very useful for the user or interpreter in the sense that a number of inexpensive trials can be implemented before a final decision is made regarding which level of smoothness is the best choice. This approachs main advantage is that any related statistical information (either a priori from the experimental data recording conditions or a posteriori from the datas noise content) is not used in the smoothing procedure. It is thus possible to oversmooth or undersmooth. Oversmoothing is almost certain to take place when the signal has a rather high frequency content while undersmoothing occurs in the presence of outliers, i.e. points which are far out from the general pattern of neighbouring data points (Ngo et al..., 2004).
Application
The method is designed to handle datasets composed of samples of rather complicated real functions. It should be stressed that (by construction) the obtained function is naturally smooth up to second-order derivative. The proposed method is applied to smooth resistivity data. Well data like resistivity data is generally very noisy, so it may be desirable to consider the parameters as being smooth functions. The AOSSA method efficiently handles and removes white noise. The AOSSA optimisation method represents resistivity data very well. The method is robust enough to provide good results even in the presence of discontinuities like the Moroccan phosphate deposit disturbances related to this study.
Methodology and procedure
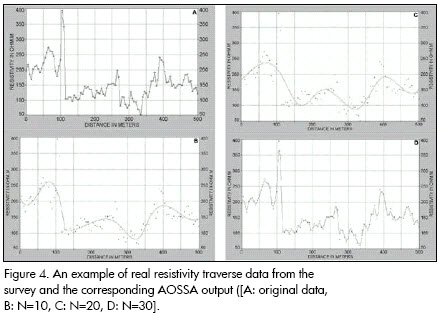
The resistivity database was compiled from 51 traverses having 20 m spacing. There were 101 stations at 5 m distance for every traverse, making 5,151 stations altogether in the resistivity survey. The AOSSA problem was reduced to finding the spline curve to smooth and denoise the resistivity data. AOSSA filtered signal output was automatically calculated (AutoSignal, 2002) for each resistivity traverse (Figure 4). A regular map representing the AOSSA model filtering and denoising map of the phosphate deposit disturbances was then constructed from all the results (Figure 3). The advantage of the AOSSA model filter is its ability to preserve higher moments in the resistivity data and thus reduce smoothing on peak heights. It is a powerful tool which is particularly suitable in denoising, filtering and analysing problems and potential singularities. Moreover this property is crucial for reconstructing the filtered geophysical signal corresponding to the resistivity data anomaly map of the Moroccan phosphate deposit disturbances.
Results y conclusions
Figure 5 represents an indicator of the smoothed level of variation regarding the contrast in density between the disturbances and normal phosphate-bearing rock. The AOSSA output maps corresponding to surface modeling of resistivity anomalies were obtainned by AutoSignal. This method enables surface phosphate disturbed zones to be defined more efficiently. Moreover, the level of disturbance is very clearly shown.
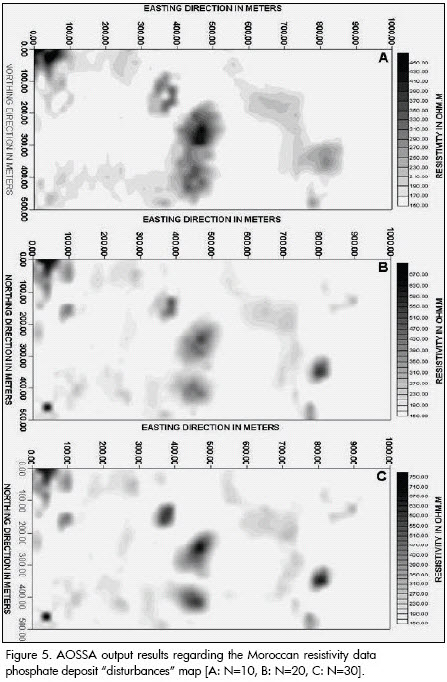
Using the AOSSA filtering method represents an effective filtering method, considerably attenuating the noise represented by minor dispersed and random disturbances. The overall effect is that of scanning and denoising anomalous bodies. Compared to classical approaches used in filtering and denoising geophysical data maps, the advantage of the AOSSA filtering method is that it does not introduce significant distortion into the shape of the original resistivity signal. The proposed AOSSA optimal smoothing and denoising method tends to give a real estimation of the surface of the phosphate deposit disturbances areas with significant noise suppression. The level disturbance resulting from such method is also more defined in all the disturbed areas compared to the other methods used (Bakkali et al.., 2006; Bakkali, 2007); it is an automatic method for smoothing and outlier suppression of data sets consisting of sampled real function points. After an a priori selection of the number of knots, the procedure automatically finds the location of the interpolating points so that the resulting smoothing function is optimal in the least-squares sense. As the method is fast, it allows the user to apply the procedure to different numbers of knots so as to choose the degree of smoothness best fitting the data. A particular feature of the method is its ability to adjust to abrupt discontinuities in data. The results revealed significant noise suppression and very good recovery of the resistivity anomalies signal. AOSSA is thus thought to be a good approach to geophysical anomaly filtering. This denoising resistivity data map technique was found to be consistently useful and the corresponding map may be used as an auxiliary tool for decision-making in field conditions.
Bibliography
Bakkali, S., Analysis of phosphate deposit disturbances using the horizontal-gradient responses of resistivity data (Oulad Abdoun, Morocco), Earth Sci. Res. J. Vol.9, No. 2, 2005, pp.123-131. [ Links ]
Bakkali, S, A resistivity survey of phosphate deposits containing hardpan pockets in Oulad Abdoun, Morocco, Geofisica Internacional, 45 (1), 2006, pp.73-82. [ Links ]
Bakkali, S., Bahi, L, Enhancement edges of Sidi Chennane phosphate deposit disturbances using non-parametric regression analysis of resistivity data., Annals of the Faculty of Engineering Hunedoara, Tome IV, Fascicole 3, 2006, pp.135-140. [ Links ]
Bakkali, S, Enhancement of edges of Sidi Chennane phosphate disturbances using sunshading responses of resistivity data., Russian Geology and Geophysics, RGG, 48 (9), 2007, pp.775-781. [ Links ]
Berghaus, D., Numerical methods for experimental mechanics, Ed Lavoisier, 1996, pp. 312. [ Links ]
Biloti, R., Santos, L. T., Martin, T., Automatic smoothing by optimal splines, Rev. Bras. Geof, Vol. 21 (2), 2003, pp. 173-177. [ Links ]
Birgin, E. G., Martinez, J. M., Large scale active set box constrained optimization method with spectral projected gradients., Computational Optimization and Applications, 23, 2002, pp.101-125. [ Links ]
Dierckx, P, Curve and Surface Fitting with Splines, New York, NY: Oxford Science Publications, 1993, pp.285. [ Links ]
Koo, J.-Y., Spline estimation of discontinuous regression functions, J. Comp. Graph. Statist. 6, 1996, pp.266-284. [ Links ]
Lee, T. C. M., Robust fitting of discontinuous regression functions., Proceedings of the Interface, 31, 1999, pp.476-481. [ Links ]
Lee, T. C. M., Regression spline smoothing using the minimum description length principle. Statist., Probab. Letters, 48, 2000, pp.71-82. [ Links ]
Lee, T. C. M., Automatic smoothing for discontinuous regression functions., Statistica Sinica, 12, pp.823-842. [ Links ]
Ngo, L., Wand, M., Smoothing with Mixed Model Software, Journal of Statistical Software, Vol. 9, 2004, pp.1-54. [ Links ]
Rupert, D., Selecting the Number of Knots for Penalized Splines., Journal of Computational and Graphical Statistics, 11, 2002, 735–757. [ Links ]
Ruppert, D., Carroll, R., Spatially-adaptive penalties for spline fitting., Australian and New Zealand Journal of Statistics, 42, 2000, pp.205-224. [ Links ]
Systat., About AutoSignal V1.6 software, Copyrignt 2002 AISN Software Inc, 2002. [ Links ]
Wand, M., Smoothing and mixed models., Computational Statistics, 18, 2003, pp.223-250. [ Links ]

