


Services on Demand
Journal
Article
 text in
  Spanish (pdf)
 Article in xml format
 Article references
 Send this article by e-mail
Indicators
-
 Cited by SciELO
 -
 Access statistics
Related links
-
 Cited by Google
 -
 Similars in
SciELO
Similars in
SciELO -
 Similars in Google
Share

 Permalink
Ingeniería e Investigación
Print version ISSN 0120-5609
Ing. Investig. vol.30 no.2 Bogotá May/Aug. 2010
Spatial variability of infiltration and its relationship to some physical properties
Alba Leonor da Silva Martins1, Emanoel Gomes de Moura2 and Jesús H. Camacho Tamayo3
1 Agronomist. M. Sc. Ph D(c)., In Agronomy (Soil Science), FCAV/ UNESP, Jaboticabal, SP. Vía de acesso Prof. Paulo Donato Castellane, s/n, CEP 14870-900. albaleonor@ibest.com 2Agronomist. M. Sc. Ph D. Assistant Professor, Universidad Estatal de Maranhão, São Luis – MA, Brasil. egmoura@elo.com.br 6 Agricultural Engineer. M.Sc. Professor, School of engineering, Universidad Nacional de Colombia, Bogotá, Colombia. jhcamachot@unal.edu.co
ABSTRACT
Water infiltration into soil is one of the basic factors for estimating irrigation intensity according to the plants' requirements; this is aimed at avoiding problems of surface run-off and degradation. The purpose of the present investigation was to determine the spatial variation of infiltration and its relationship to some physical properties of soil by means of geostatistical techniques in Typic Plinthaquult soils having average texture and flat relief. A 113 point mesh was designed, having a regular distance of 10 m between points, samples being taken from 0 to 0.20 meters depth. Sand, silt and clay content, bulk density, macroporosity, microporosity and total porosity were determined. Infiltration tests were carried out in the field by means of a 15 cm diameter ring. Descriptive statistics and geostatistics were used for analysing the data. Infiltration, silt and microporosity data did not fit a normal distribution curve. Infiltration had high variability, having an average 36.03 mm h-1. Total porosity was 56.73%, this being the only property that did not show spatial dependency. The smallest ranges were observed for bulk density, macroporosity and microporosity, having values of less than 40 m. The smallest degrees of spatial dependence were observed for infiltration, silt and clay, evidence also being shown of the influence of silt and clay on infiltration rate. Contour maps were constructed; fitting them to the semivariogram models, together with studying the correlations, led to establishing relationships between the properties.
Keywords: geoestatistics, semivarigram, kriging, porosity.
Received: may 04th 2009
Accepted: jun 10th 2010
Introduction
The Typic Plinthaquult soils of the central northern part of the State of Marañón (Brazil) have inherent limitations thereby hampering their management for agricultural production, such as the formation of highly condensed layers, surface crust formation and restricted water percolation. According to Embrapa (2006), this kind of soil which is influenced by the continual process of wetting and drying therefore favours the development of a plinthic horizon, meaning that the soil remains saturated and is subject to water table level fluctuations. Understanding the relationship between infiltration and water movement in this soil (with its physical properties) is thus important in ensuring adequate crop production management.
Ascertaining the infiltration rate and accumulated water quantity is of great importance due to their application in the agricultural and environmental sector, since this leads to estimating surface run-off, suspended particle transport, sediment availability, aquifers capacity to become refilled, defining irrigation systems and studying the effects of different soil management practices (Machiwal et al., 2006; Strudley et al., 2008).
The physical properties of soil have traditionally been analysed and managed without the characteristics of a particular soil being known or the conditions at the time of cultivation, as well as crop requirements; ensuring prior evaluation in line with the concept of sustainability is thus extremely important. Such lack of knowledge leads to degradation-favouring soil management practices being continued (Amézquita, 2004). On the other hand, random sampling is insufficient for determining relationships between soil properties, occasionally leading to mistakes in decision-making since wide-ranging variations can show up in the same property due to changes caused by agricultural activity (Strudley et al., 2008). Suitable soil management can depend on knowledge regarding soil properties' dependence and spatial interaction (Montenegro and Montenegro, 2006).
Tools such as geostatistics can more precisely describe a property's spatial behaviour which, together with knowledge, experience and management of the particular variables being studied, reduces variation attributed to possible random errors (Faraco et al., 2008). Geostatistics verify the same property's spatial dependence and variability amongst closely-related samples, as well as the correlation between different properties, by using a semivariogram (Viera, 2000).
The infiltration rate's spatial variability and its fit to theoretical semivariogram models has been studied by several authors (Lennartz et al., 2009, Rodríguez-Vásquez et al., 2008), verifying that clay content has a direct influence on water infiltration into soil and is strongly correlated with bulk density and porosity (Rodríguez-Vásquez et al., 2008).
The system of soil preparation and the presence of surface residues also influence water infiltration rate, as has been verified by Medina and Leite (1985) working in an ultisol-type soil who found that high surface residue density created favourable conditions for water movement and infiltration into soil, this being similar to what happens in native woods due to suitable surface protection.
A Typic Plinthaquult soil's infiltration rate generally shows high spatial variability for a soil considered homogenous; the present paper was thus aimed at determining the spatial variability of surface infiltration for a Typic Plinthaquult soil and its relationship to such soil's physical properties.
Materials and methods
Study site location and characteristics
The study was carried out in Miranda del Norte (Marañón state, Brazil) located at 3° 36' south latitude and 44° 34' west longitude (Figure 1) on a 1 hectare plot planted with corn (Zea mays L.), agro-forestry system, in an area where family agriculture predominates. The predominant soil is a Typic Plinthaquult, having medium texture and flat relief. According to Köppen climatic classification, the region is located in an Aw'- humid tropical climate, having an average 27°C temperature and 1,600 to 2,000 mm year-1 rainfall, concentrated in December and June, a dry climate predominating in the other months.
Sampling and laboratory analysis
A 113-point mesh was designed for sampling, having a regular 10 m distance between points in an area measuring about 1 ha. Disturbed and undisturbed soil samples were taken at each point, at 00.20 m depth. The disturbed samples were air-dried until they reached equilibrium point; once being clod, they were passed through a 2 mm mesh for granulometric analysis. Sand, silt and clay content were thus established by means of a 10 g sample subjected to slow agitation for 16 h, in 100 ml of solution with NaOH (0.1 mol L-1); clay content was obtained by means of an aliquot drawn out with a pipette (Gee and Bauder, 1986). The undisturbed samples were taken from 100 cm3 volumetric rings to determine bulk density, macroporosity, microporosity and total porosity by means of a tension table, following the methodology described by Kiehl (1979).
Infiltration rate was determined during a dry period, at each sampling point, by means of a 15 cm diameter ring, using a Guelph permeameter modified by the Agronomical Institute of Campinas (IAC), thus guaranteeing constant water load. Infiltration was calculated by means of Reynolds and Elrick's equation (1985), modified by Vieira (1988):
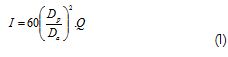
where I is water infiltration rate into saturated soil (mm h-1), Dp is the permeameter diameter (9 cm), Da is the ring diameter (15 cm) and Q is estimated water flow in saturated soil (mm min-1).
Statistical analysis
Descriptive statistics were initially used for analysing the data, using SPSS 16.0 software for calculating the mean, median, coefficient of variation (CV), minimum, maximum, skewness, kurtosis and the Kolmogorov-Smirnov test. Normality was thus verified, a pattern which is not indispensible when related to geostatistical techniques but does give better predictions when data are fit to a normal distribution (Diggle and Ribeiro, 2000). The classification proposed by Warrick and Nielsen (1980) was used for CV analysis; this indicates low CV variability for values below 12%, average CV variability between 12% and 60% and high CV variability when greater than 60%. Pearson linear correlation was also carried out to identify the correlation between infiltration and the soil's different physical properties.
The physical properties and infiltration's spatial dependence were analysed by using semivariograms. The theory of regionalised variables was taken into consideration for the fit of the theoretical experimental semivariogram models; this has different methods for analysing spatial variation, one of them being the semivariogram (Vieira, 2000) which is estimated by:
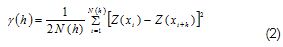
where (xi) and Z(xi+h) are a variable's observed values, separated by a distance h, and N(h) is the number of experimental pairs of observations, separated by distance h. The semivariogram is graphically represented by γ(h) versus h. The theoretical model's coefficients are estimated from the fit of the model: nugget effect (C0), plateau (C0+C1) and range (A).
The degree of spatial dependence (DSP) was also estimated, based on the ratio between the nugget effect and the plateau (C/Co+C), being considered strong for DSP when above 75%, moderate DSP between 25% and 75% and weak for DSP when less than 25% (Cambardella, 1994). GS+ software (Robertson, 1998) was used for calculating the semivariograms; this adopts the largest determination coefficient value (R2), the lowest value for the sum of the square of the residue (SQR) and a crossed validation coefficient (CVC) close to one as criteria for selecting the model. Once spatial dependence had been determined, each property in the non-sampled areas was predicted by kriging, represented on contour maps that were drawn up using Surfer software (1999).
Analysis of results and discussion
The values found for the average and median were similar for each of the studied properties, thereby indicating symmetrical distributions. This was verified by skewness and kurtosis values being close to zero for all properties; they approached normal distribution, except for infiltration, a property showing distinct values between the average and the mean (Table 1).. These properties' normality pattern has also been reported by Cruz et al., (2010) and Ramírez-López et al., (2008). The Kolmogorov-Smirnov test confirmed normal distribution for most properties, showing that infiltration did not fit a normal distribution, as well as silt and microporosity.
According to Warrick and Nielsen's criteria (1980), it was seen that infiltration had high variability (64.15% CV). Rodríguez-Vásquez et al., (2008) also found high variability for this property in a high silt content Andisol soil. Bulk density was the property showing the least CV (indicating low variability) together with microporosity and total porosity. Low variability for bulk density and total porosity have also been reported by Ramírez-López et al., (2008). The other properties showed average variability.Clay was the soil particle showing the greatest variability.
Total porosity was the only property which did not fit a theoretical semivariogram model indicating that its behaviour in the soil was random, thereby showing the pure nugget effect (Table 2). The spherical model was the predominant model among the other properties analysed; it fit infiltration, silt, clay and microporosity data. Sand, bulk density and macroporosity data fit the exponential models.
The fit to the models was adequate, given the determination factor values which were always above 0.75. Sand and clay were the properties having the best fit for the models. The coefficient of crossed validation values were close to 1 for most e properties, whereas bulk density had the lowest value (0.81). Infiltration showed the greatest range and was the only property having a range greater than 100 m.
Macroporosity and microporosity were the properties having the least range. Regarding the degree of spatial dependence (DSD), infiltration showed the lowest value, having moderate spatial dependence. Clay and silt also showed a moderate DSS. The other properties showed high DSD, having greater than 0.80 values.
Infiltration did not have a significant correlation with the physical properties (Table 3). It can be seen that infiltration was directly related to silt content and inversely to clay content. The same pattern has been reported by Rodríguez-Vásquez et al., (2008). This relationship between infiltration and silt and clay content is verified on the contour maps (Figure 2) where areas having a greater infiltration rate correspond to areas of greater silt content and lower clay content.
A significant and inverse correlation for sand was seen with clay and microporosity. Silt and clay content showed a strong inverse correlation, as can be seen in the contour maps (Figure 2) where areas of greater silt content corresponded to areas of lower clay content and vice versa.
Bulk density also had a positive and significant correlation with microporosity, leading to moderately similar contour maps (Figure 3). Total porosity (a property in which spatial dependence was not found) had an inverse correlation with sand and silt content and a direct correlation with clay content, as well as with bulk density, macroporosity and microporosity.
The contour maps confirmed the relationship between the variables analysed here (Figures 2 and 3) as well as the spatial variability existing in the soil, thereby indicating the convenience of carrying out localised soil management practices according to the conditions of the area and crop requirements, aimed at lowering production costs and the soil degradation which results from conventional management.
Conclusions
Infiltration and soil properties analysed by means of descriptive statistics and geostatistics revealed the soil's high variability in its infiltration and physical property patterns, this being an important tool for decision-making since it leads to establishing the soil quality parameters which are directly related to agricultural production.
The linear correlation estimated for the properties lead to identifying which ones were most closely related; such relationships were spatially confirmed by means of contour maps obtained by kriging when the properties fit the theoretical semivariogram models.
Acknowledgements
We would like to thank COLCIENCIAS (the Colombian Science, Technology and Innovation Department) for providing financial support for the third author.
Amézquita, E., La fertilidad física del suelo., In: Congreso Latinoamericano y de la Ciencia del Suelo, 16., Memorias. Cartagena, Colombia, Sociedad Colombiana de la Ciencia del Suelo, CD, 2004. [ Links ]
Cambardella, C. A., Moorman,T. B., Novak, J. M., Parkin, T. B., Karlen, D. L., Turco, R. F., Konopka, A. E., Field-scale variability of soil of soil properties in central lowa soils., Soil Science Society America Journal, Vol. 58, No. 5, Sep., 1994, pp. 1501-1511. [ Links ]
Cruz, J. S., Assis Júnior, R. N., Matias, S. S. R., Camacho-Tamayo, J. H., Tavares, R. C., Análise espacial de atributos físicos e carbono orgânico em argissolo vermelho-amarelo cultivado com cana-de-açúcar., Ciência e Agrotecnologia, Vol. 34, No. 2, Mar., 2010, pp. 271-278 . [ Links ]
Diggle, P. J., Ribeiro, J. R., Model Based Geostatistics., 1. ed. Sâo Paulo: Associaçâo Brasileira de Estatística, 2000, pp. 129. [ Links ]
EMBRAPA. Centro Nacional de Pesquisa de Solos., Sistema brasileiro de classificaçâo de Solos, 2ªed., Rio de Janeiro. (Embrapa – Solos), 2006, pp. 306. [ Links ]
Faraco, M. A., Uribe-Opazo, M. A., Silva, E. A. A., Johann, J. A., Borssoi, J. A., Seleçâo de modelos de variabilidade espacial para elaboraçâo de mapas temáticos de atributos físicos do solo e produtividade da soja., Revista Brasileira de Ciência do Solo, Vol. 32, No. 2, Mar., 2008, pp. 463-476. [ Links ]
Gee, G. W., Baudar, J. W., Particle-size analysis., In: KLUTE, A. Methods of soil analysis, 2a. Ed. Madison: American Society of Agronomy, part 1, 1986, pp. 383-411. [ Links ]
Kiehl, E. J., Manual de edafologia, relações solo – planta., Sâo Paulo, Ceres, 1979, 264p. [ Links ]
Lennartz, B., Horn, R., Duttmann, R., Gerke, H. H., Tippkötter, R., Eickhorst, T., Janssen, I., Janssen, M., Rüth, B., Sander, T., Shi, X., Sumfleth, K., Taubner, H., Zhang, B., Ecological safe management of terraced rice paddy landscapes., Soil and Tillage Research, Vol. 102, No. 2, Mar., 2009, pp.179-192. [ Links ]
Machiwal, D., Jha, M. K., Mal, B. C., Modelling Infiltration and quantifying Spatial Soil Variability in a Wasteland of Kharagpur, India., Biosystems Engineering, Vol.95, No. 4, Dec., 2006, pp. 569– 582. [ Links ]
Medina, B. F., Leite, J. A., Influência de três sistemas de manejo e duas coberturas vegetais na infiltraçâo de água em um Latossolo Amarelo em Manaus –AM., Pesquisa Agropecuária Brasileira, Vol. 20, No. 11, Nov., 1985, pp. 1323-1331. [ Links ]
Montenegro, A. A. A., Montenegro, S. M. G. L., Variabilidade espacial de classes de textura, salinidade e condutividade hidráulica de solos em planície aluvial., Revista Brasileira de Engenharia Agrícola e Ambiental, Vol. 10, No. 1, Jan., 2006, pp.30-37. [ Links ]
Ramírez-López, L., Reina-Sánchez, A., Camacho-Tamayo, J. H., Variabilidad espacial de atributos físicos de un Typic Haplustox de los llanos orientales de Colombia., Engenharia Agrícola, Vol.28, No. 1, Jan., 2008, pp. 55-63. [ Links ]
Reynolds, W. D., Elrick, D. E., In situ measurement of fied-satured hydraulic conductivity, sorptivity, and the α-parameter using the Guelph permeameter., Soil Science, Vol. 140, No. 4, Oct., 1985, pp. 292-302. [ Links ]
Robertson, G. P. GS+., Geostatistics for the environmental sciences (version 5.1 for windows)., Plainwell: Michigan, Gamma Design Software, 1998, pp. 152. [ Links ]
Rodríguez-Vásquez, A. F., Aristizábal-Castillo, A. M., Camacho Tamayo, J. H., Variabilidad espacial de los modelos de infiltración de Philip y Kostiakov en un suelo ándico., Engenharia Agrícola, Vol. 28, No. 1, Jan., 2008, pp. 64-75. [ Links ]
Surfer for windows., Realese 8.0. Contouring and 3D surface mapping for scientist's engineers. User's Guide., New York: Golden software, Inc, 2000. [ Links ]
Strudley, M.W., Green, T.R., Ascough II, J.C., Tillage effects on soil hydraulic properties in space and time: State of the science., Soil and Tillage Research, Vol., No. 1, April 2008, pp. 4-48. [ Links ]
Vieira, S. R., Permeâmetro: novo aliado na avaliaçâo de manejo do solo., O agronômico, Vol. 47, No.1, Jan., 1998, pp. 32-33. [ Links ]
Vieira, S. R., Geoestatística em estudo de variabilidade espacial do solo: tópicos em ciência do solo., Viçosa: Sociedade Brasileira de Ciência do solo, 2000. Vol. 1, pp. 55. [ Links ]
Warrick, A.W., Nielsen, D.R., Spatial variability of soil physical properties in the field., Applications of soil physics, New York: Academic Press, Hillel, D. (ed.), 1980, pp. 319-344. [ Links ]

