


Serviços Personalizados
Journal
Artigo
 texto em
  Espanhol (pdf)
 Artigo em XML
 Referências do artigo
 Enviar este artigo por email
Indicadores
-
 Citado por SciELO
 -
 Acessos
Links relacionados
-
 Citado por Google
 -
 Similares em
SciELO
Similares em
SciELO -
 Similares em Google
Compartilhar

 Permalink
Ingeniería e Investigación
versão impressa ISSN 0120-5609
Ing. Investig. v.30 n.2 Bogotá maio/ago. 2010
A new algorithm for detecting and correcting bad pixels in infrared images
Andrés David Restrepo Girón1 and Humberto Loaiza Correa2
1 Electronic Engineering. M.Sc., Automatic, Universidad del Valle, Cali, Colombia. Ph.D., Candidate in Engineering, emphasis in Electrical and Electronic Engineering, Universidad del Valle, Cali, Colombia. Professor, Universidad Santiago de Cali, Cali, Colombia. Director , Electronic Engineering Program, Universidad Santiago de Cali, Cali, Colombia. adareg378@gmail.com2 Electrical Engineer. M.Sc., Automatic, Universidad del Valle, Cali, Colombia. Ph.D., in Robotics and Machine Vision, L'Université d'Evry, Francia. Professor, Universidad del Valle, Cali, Colombia. Co-Director, Grupo de Investigación en Percepción y Sistemas Inteligentes (PSI). hloaiza@univalle.edu.co
Abstract
An image processing algorithm detects and replaces abnormal pixels individually, highlighting them amongst their neighbours in a sequence of thermal images without affecting overall texture, like classical filtering does. Bad pixels from manufacture or constant use of a CCD device in an IR camera are thus detected and replaced with a very good success rate, thereby reducing the risk of bad interpretation. Some thermal sequences from CFRP plates, taken by a Cincinnati Electronics InSb IR camera, were used for developing and testing this algorithm. The results were compared to a detailed list of bad pixels given by the manufacturer (about 70% coincidence). This work becomes relevant considering that the number of papers on this subject is low; most of them talk about astronomical image pre-processing. Moreover, thermographic non-destructive testing (TNDT) techniques are gaining popularity in Colombia at introductory levels in industrial sectors such as energy generation and transmission, sugar production and military aeronautics.
Keywords: pixel correction, infrared image, thermography, non-destructive testing (NDT).
Received: jun 04th 2009 Accepted: jul 221th 2010
Introduction
Abnormal or defective pixels can be defined as being those significantly deviating from the average behaviour of their neighbours, whether due to manufacturing defects (the most common case) (Dargaud, 2009) (Rodríguez, 2009), periodic incidence of radiation during sensor operation, as in astronomical imaging (Cresitello-Dittmar, 2001), or due to interference by some type of parasitic radiation in charge-coupled (CCD) device applications involving high-frequency energy (Li et al., 2006) depending on what it is intended to capture. Two basic types of anomalous pixels can be found in the literature (Dargaud, 2009) (Brändström, 2009), according to their greyscale: dead pixels (always having a very low average level or having a very little sensitivity) and hot pixels (retaining a very high level instead, being common in astrophysical images where they can be confused with astronomical bright bodies). Regarding colour devices, there is talk about a third type of defective pixel; these are atrophied (stuck) pixels in which several sub-pixels are always on or off, making the pixel red, green blue (RGB) scale usually take on a constant tone (Dargaud, 2009) (Rodríguez, 2009). All these pixels can occur individually, in columns or in groups (clusters) (Pixel Fixer, 2009) (Zamorano, 2009).
Defective pixels are inevitable during CCD manufacture, although the required quality standards demand that they are relatively few; manufacturers thus usually provide a detailed list of these pixels. However, the fact is that one does not always have such a list and, even having one, such devices tend, as their use spreads, to have an increased number of anomalous pixels (Harbarth et al., 2005) (Harvard University, 2009) which is also bound to continuing susceptibility to electronic noise. On the other hand, captured images in certain applications have spots of pixels having abnormal levels which are not due to manufacturing defects but to the external radiation to which a device is sensitive (Li et al., 2006). Detecting and replacing anomalous pixels is thus a problem which has been treated by statistical processing methods as opposed to classical filtering methods which are not effective in correcting abnormal pixels grouped together, and also disrupts an image's overall texture (Li et al., 2006). Comparative methods (totally dark or white) (Dargaud, 2009) and interpolation are also used (Zamorano , 2009) (Brändström, 2009). However, each method depends on the working images and the characteristics of image acquisition.
The list of defective pixels provided by the manufacturer is commonly used in active thermography applications so as to replace them with a neighbouring pixel's intensity (Benítez, 2008) or use a median filter; however, the consequences of the emergence of such anomalous pixels due to one or more of the aforementioned causes can be summarised by a decrease in overall infrared image contrast and hence the thermal contrast needed for an efficient end procedure. This is a main disadvantage, not only from the purely visual aspect of any inspection, but also in the sense of reducing the dynamic range for the intensity of such non-defective pixels and, with it, the likelihood of successfully using a classification algorithm and automatic characterisation of actual material defects. To demonstrate these ideas, the next section gives some experimental features of anomalous thermal imaging pixels and some practical effects which may occur when trying to correct them by conventional techniques.
Unprocessed video sequences were thus used, taken by an Indio-Antimony camera (InSb, Cincinnati Electronics) during inspection of carbon fibre reinforced plastic (CFRP) plates by active thermography (Benítez, 2008) (Benitez, 2007a) (Benitez, 2007b).
Experimental evidence
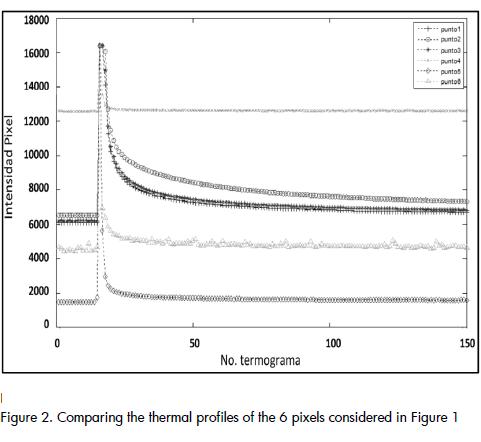
Figure 1a shows three damaged pixels according to the list given by the camera manufacturer; they are enclosed in white circles on a thermal image region taken from a CFRP plate after the heat pulse and without pre-processing. Figure 1b lists 6 pixels: three of them in good condition (1, 2 and 3) and three (4, 5 and 6) defective pixels. Thermal profiles were calculated for these six pixels as greyscale intensity curves, being sampled at every moment a picture or frame was obtained, such sequence commonly referred to as being a thermogram. These curves are shown in Figure 2, where each curve is associated with the number assigned to the corresponding pixel in Figure 1b. It can be seen that the 3 pixels known to be in poor condition (4, 5 and 6) only responded to the heat pulse at which saturation intensity in the image was obtained. From this moment, the three profiles indicated decayed much faster than the pixels in good condition (1, 2 and 3).
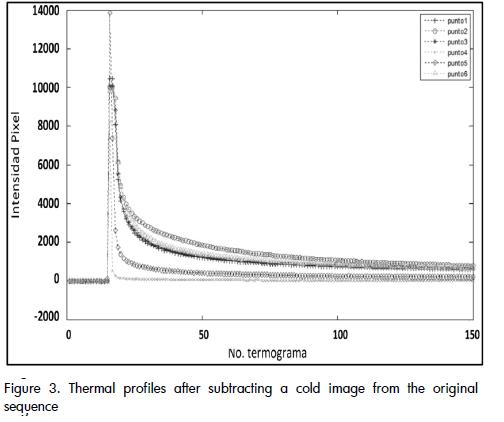
In principle, it could be thought that measuring the energy of the intensity function for each pixel in the image sequence could lead to deducing that pixels having minimal energy evolve differently than normal pixels do. However, this approach to the problem has two factors playing against it. The first has to do with the fact that, without pre-processing, the average intensity of the previous profiles differed significantly among themselves, as in the case of profile 4 belonging to a damaged pixel and its energy value would have been the greatest of all. This may be corrected to some extent by subtracting a cool image (image before the heat pulse) from the entire sequence, as shown in Figure 3.
However, the second possibility arises at this point. The energy value for the thermal profile of a pixel in good condition could be low enough to determine (incorrectly) that it was in poor condition. This situation could occur with the pixels corresponding to healthy areas of material, especially those falling into the periphery of images due to the vignetting effect (Benítez, 2008).
Vignetting should be compensated to reduce the probability of detection failure; work should be done with a sequence that includes images during or just after excitation of heat to achieve greater contrast between profiles. Nevertheless, such damaged pixels could affect vignetting compensation, without bearing in mind the underlying problem of uneven heating.
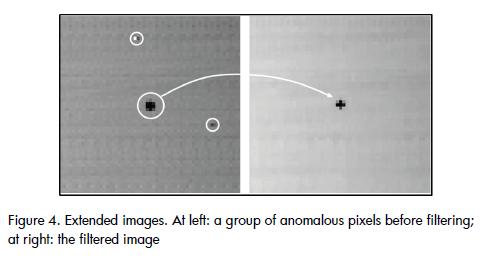
Another possible solution is the use of median filtering on each image in the sequence, considering that anomalous pixels are usually surrounded by pixels which are all in good condition, so they could be seen as salt and pepper noise in images having good contrast. Following such assumption, this operation automatically replaces these points by the median intensity of its neighbouring pixels, although a filtering operation would not actually detect individual pixels in poor condition. However, the procedure may not be acceptable because of two possible circumstances. The first has to do with the fact that applying the median filter will affect images' overall sharpness, which may not be justifiable when they have very few defective pixels. The second is the likely occurrence of a group of bad pixels neighbouring each other, where median filtering with a minimum size mask will still give indications of "stranger" pixels (see Figure 4). In the latter case, the same filter would have to be repeated again or more aggressive filtering (larger masks) applied from the beginning. Both actions leading to significant consequences of noticeable or even unacceptable smoothing in the resulting images.
Proposed solution
It may thus be concluded from the examined profiles and searching for features related to anomalous pixels compared to others in infrared images from thermographic sequences that defective pixels usually differ spatially and temporally (in their intensity) from their nearest neighbours in good condition. The screening procedure is intended to calculate a value indicating in some way the difference between a pixel and its 8-neighbors within each image in the sequence (feature space involved) and then adding these differences throughout the whole sequence (temporal property involved). Once detected, their intensities are replaced by the average intensity of their 8-neighbors in good condition. Implementing the proposed procedure for detecting and automatic replacement of abnormal pixels was carried out using MATLAB, mainly using its Digital Image Processing toolbox (Mathworks, 2007) and was organised in detail as shown in the following steps:
1)Initially, all thermal images captured immediately after the heat pulse were extracted from a complete sequence and then one of the cool pictures (not included in the sequence of work because it happened before the heat pulse) was subtracted from them to improve contrast. This subtraction also ensured that all anomalous pixels tended to be dark points on the monochrome image, even those that were visible as bright details (see Figures 2 and 3).
2)From a sequence of N images, M of them were chosen (M ≤ N) for analysis; the higher the number, the more reliable the results would be in terms of less chance of false detection (however, such procedure considerably increased run time).
3)A value indicating the degree of difference from its 8-neighbors was calculated for each pixel of each M thermogram used for analysis,. This difference value DV(pkj) was defined as being the median of absolute differences between pixel pkj and its 8-neighbours N8(pkj):

The median as calculation tool was better adapted to situations such as the presence of a damaged pixel in the 8-neighbourhood of a pixel in good condition, making the result of the sum or average as alternatives to the median seem to be more influenced by the effect of a single sharp difference between the eight intensity differences, which can lead to a greater number of false positives.
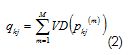
4)New image matrices were obtained by replacing each pixel by its difference value so that a new sequence was obtained after repeating this procedure throughout the M frames chosen for the search. Performing the sum of all images in this sequence, pixel by pixel, produced an Idsum image in which each pixel qkj was given by:
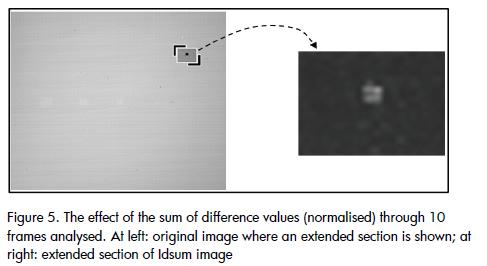
Bright spots conveniently appeared by normalising the intensity of qkj, corresponding to the pixels differing most from their neighbours, as shown in Figure 5 on a portion of the resulting image.
Histogram h was generated from the Idsum image, corresponding to the above summed image normalised to the range of grey values. The average value of grey mediah and standard deviation desvh (in the number of grey levels) thereof were calculated. Since most qkj' pixels tended to present low greyscale levels, curves for h would fall rapidly (see Figure 6). The idea was to find a greyscale value g on the falling edge of h for thresholding the image so that pixels with maximum intensity of grey pixels corresponded to those detected as being abnormal.
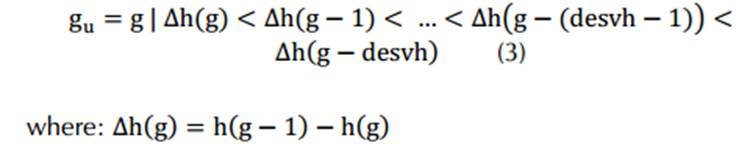
5) The greyscale level threshold gu (Figure 7) is determined by an iterative procedure similar to that used by Restrepo for ultrasonic signals (Restrepo, 2005), applied this time to histogram h(g) from the Idsum image. This procedure consisted of thinking about h as a discretised signal regarding greyscale level g and thereby to extract the discrete derivative (difference between samples) and later, the sign for this derivative. The idea was that if the histogram was shifted from right to left, then a sustained elevation would be presented on arriving at the rising edge of h(g), reflected in a minimum number of consecutive positive sign derivatives, such number being the previously calculated standard deviation. Equation 3 was thus:
 (3)
(3)
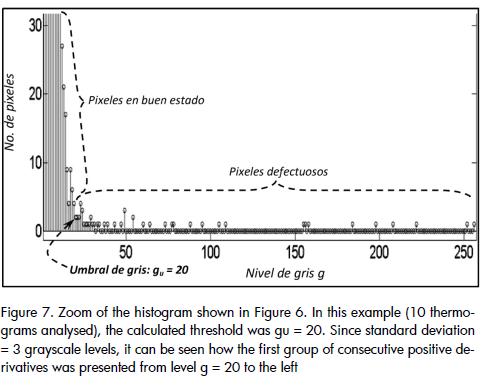
Figure 7. Zoom of the histogram shown in Figure 6. In this example (10 thermograms analysed), the calculated threshold was gu = 20. Since standard deviation = 3 grayscale levels, it can be seen how the first group of consecutive positive derivatives was presented from level g = 20 to the left
6) Having applied the threshold, the pixel coordinates having maximum greyscale values were recorded in an array D of defective pixels. Such an arrangement was ordered first regarding k and then j, so that ordering these pixels led to sweeping the thresholding Idsum image rows.
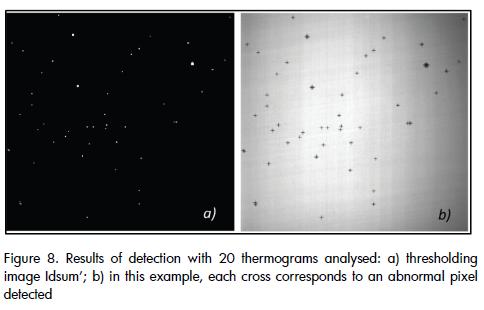
7)For all N frames of the original sequence, each pixel plm classified as being abnormal was located (Figure 8) and its greyscale value replaced by the average of the respective values of the pixels classified as being in good condition belonging to the 8-neighbourhood (dark pixels on Idsum thresholding):
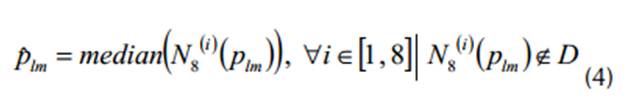
It should be noted that plm was corrected, replacing it in the original image being processed at that time by its new value ^plm, before proceeding to correct another pixel belonging to D. This ensured better spatial continuity in resulting greyscale intensity when there were several neighbouring defective pixels.
The appendix gives a flow chart summarising the above algorithm.
Results
Figure 9 shows the final result of replacing the abnormal pixels detected.
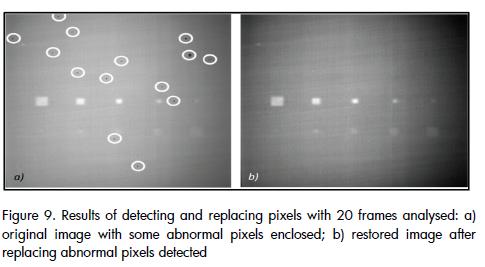
At first glance, it seems that the overall effect of replacing the pixels classified as being abnormal was to darken the image; however, if observed in more detail, it can be seen that the presence of dark spots in the image on the left in Figure 9 reduced the dynamic range of the rest of the image, basically depending on the vignetting effect and the difference between healthy and defective areas of the material inspected. The reduction in dynamic range can significantly influence the performance of a classifier used for automatically detecting and characterising defects in composite laminates. The disappearance of such items significantly improved the contrast of the entire image, the vignetting effect being primarily responsible for darkening its periphery.
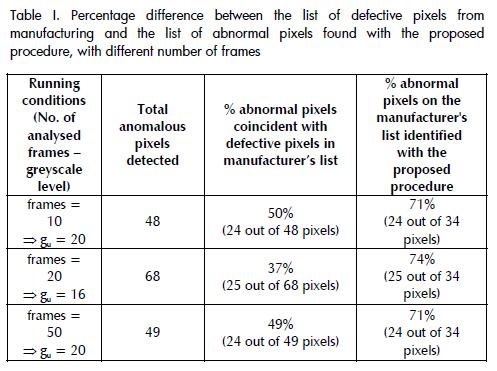
The following data for different procedure parameters values were obtained by comparing list D of anomalous pixels detected to the list provided by the manufacturer for defective FPA sensor pixels:
The detection and correction algorithm was run over a previously modified sequence in accordance with the manufacturer's list of defective pixels which were arbitrarily replaced by a neighbouring pixel in good condition as an additional test. Figure 10a shows that a small group of defective pixels was retained in the thermal images after manual replacement. The result shown in Figure 10b was obtained after applying the proposed automatic method in which, despite gaining a noticeable improvement in the image's dynamic range, there was a slightly contrasting region where defective pixels were concentrated.
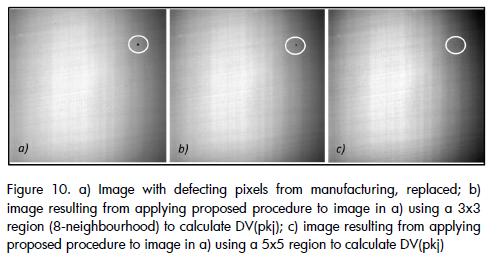
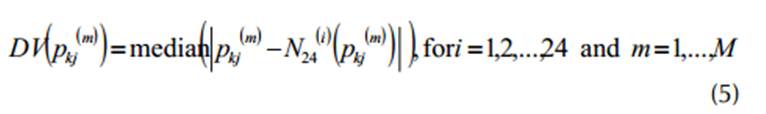
The reason for this behaviour in this specific example was that only the central pixel was on the list from the factory for this group of neighbouring pixels, known anomalous, so that its previous replacement by one of its neighbours in all image sequences reduced the difference value VD(pkj). Overall, it was found that results improved in correcting abnormal pixels on passing a neighborhood-8 to a region of 5x5 pixels for calculating VD(pkj) (the difference between the intensity of the central pixel and each of the 24 nearest pixels around it - Equation 5), being grouped in small spots on the image like in the following example:
Conclusions
The automatic detection and correction of abnormal pixels in thermal imaging is an important contribution to NDT thermography techniques because this type of problem is common in infrared cameras due to their construction and may increase with their use. Additionally, inspection procedures are based on contrasts between the levels of pixels and their neighbours so, if adequate detection and correction of these abnormal pixels is not made, it leads to possible misinterpretation of the state of materials inspected. Bearing this fact mind this, it was possible to develop an algorithm for automatic detection and correction of abnormal pixels in a sequence of infrared images in which the only information configurable by the user was the number M of images analysed from
the acquired thermal sequence. The results showed an improvement in pixel contrast, detecting a high percentage (> 70% according to testing) of the pixels reported by the manufacturer as being defective, without affecting the images' overall texture. It was also able to recognise a reasonable number of pixels having abnormal behaviour, many of which could be attributed to deterioration by the continued use of a particular device.
The algorithm's characteristics means that failure may appear in classifying an abnormal pixel (and hence their subsequent replacement) when it is in the middle of a group of more abnormal pixels adjacent to each other when their greyscale levels are similar, since the difference value for each pixel was calculated on their 8-neighborhood; however, this probability became reduced with the accumulation of this value through all the frames involved in the analysis (time course), or using wider neighbourhoods, compared to results delivered by a classic filtering technique to attempt to standardise such defective pixels with the behaviour of their neighbours.
On the other hand, although it seems that the algorithm showed a large number of anomalous greyscale pixels depending on the threshold calculated at the end of the procedure, it must be noted that list D of 68 pixels for example represented about 0.1% of 53,590 pixels (230x233) forming each image within the sequence which was processed. Additionally, correcting these pixels ensured that the final result corresponded to a selective smoothing filter, not global, because of the average of their neighbours in good condition (equation 4).
It is proposed that the behaviour of the pixels which were listed by the camera manufacturer and which were not detected by the algorithm should be analysed in future work, trying to find characteristics not taken into account in the present processing. It may also be possible to examine the impact of including a term in calculating each pixel's difference value, including variation regarding global features of the images in the sequence, for example, noise level.
Acknowledgements
The authors would like to thank the Universidad del Valle's PhD Engineering programme and COLCIENCIAS (national PhD programme) for financing the PhD study which led to this work.
Benítez, H., Contribución a la Caracterización de Defectos en Termografía Infrarroja mediante Máquinas de Aprendizaje., Tesis doctoral, Universidad del Valle, Programa de Posgrados en Ingeniería Eléctrica y Electrónica, 2008. [ Links ]
Benítez, H., Ibarra, C., Bendada, H., Maldague, X., Loaiza, H., Caicedo, E., Procesamiento de Imágenes Infrarrojas para la Detección de Defectos en Materiales., TECNURA, revista de la Facultad de Ingeniería de la Universidad Distrital Francisco José de Caldas, Vol 10, No. 20, 2007. [ Links ]
Benítez, H., Ibarra, C., Bendada, H., Maldague, X., Loaiza, H., Caicedo, E., Definition of a new Thermal Contrast and Pulse Correction for Defect Quantification in Pulsed Thermography., Infrared Physics and Technology, 2007. [ Links ]
Brändström, U., Removing the Instrument Signature., En: The Auroral Large Imaging System (ALIS): design, operation and scientific results. Swedish Institute of Space Physics, 2009.<http://www.irf.se/~urban/avh/html/node21.html> [citado en mayo de 2009] [ Links ]
Cresitello, M., Aldcroft, T., Morris, D., On the Fly Bad Pixel Detection for the Chandra X-ray Observatory's Aspect Camera., En: Astronomical Data Analysis Software and Systems X. Harvard Smithsonian Center for Astrophysics, ASP Conference Series, Vol. 238, 2001. [ Links ]
Dargaud, G., Dead Pixels Test., < http://www.gdargaud.net/Hack/DeadPixels.html> [citado en mayo de 2009] [ Links ]
Harbarth, D. M., Kirsch, M. G. F., Stuhlinger M., Smith, M., Baskill, D., Freyberg, M. J., Monitoring of the Epic Cameras at the XMM-Newton Science Operations Centre, 2009. < http://xmm.vilspa.esa.es/external/xmm_links/trainee/2005/reports/dh.pdf> [citado en mayo de 2009] [ Links ]
Li, H., Schillinger, B., Calzada E.O, Yinong, L., Muehlbauer, M., An adaptive algorithm for gamma spots removal in CCD-based neutron radiography and tomography., Nuclear Instruments and Methods in Physics Research, section A. Elsevier [Base de Datos en línea], 2006. [ Links ]
Mathworks., MATLAB Versión 2007a., Image Processing Toolbox Help, 2009. [ Links ]
Pixel Fixer., Hot pixel removal utility. <http://www.pixelfixer.org/> [citado en mayo de 2009] [ Links ]
Restrepo, A., Loaiza, H., Caicedo, E., Procedimiento de Discriminación de Ecos Relevantes en una Señal de Sonar., Revista de la Escuela Colombiana de Ingenieros (ECI), Año 15, No. 60, 2005, pp. 36-41. [ Links ]
Rodríguez, J., Guía de Revisión para tu nuevo Mac., 2009. <http://www.idg.es/macworld/content.asp?idart=191964> [citado en mayo de 2009] [ Links ]
Universidad De Harvard., ACIS Bad Pixel List [en línea], 2009. <http://asc.harvard.edu/mta_days/mta_bad_pixel/mta_bad_pixel_list.html> [citado en mayo de 2009] [ Links ]
Zamorano, J., Gallego, J., Detectores CCD., Presentación del Curso en Instrumentación Astronómica, Universidad Complutense de Madrid, 2009. <http://www.ucm.es/info/Astrof/users/jaz/IA/IA_09_CCD.pdf> [citado en mayo de 2009] [ Links ]

