


Servicios Personalizados
Revista
Articulo
 texto en
  Español (pdf)
 Articulo en XML
 Referencias del artículo
 Enviar articulo por email
Indicadores
-
 Citado por SciELO
 -
 Accesos
Links relacionados
-
 Citado por Google
 -
 Similares en
SciELO
Similares en
SciELO -
 Similares en Google
Compartir

 Permalink
Ingeniería e Investigación
versión impresa ISSN 0120-5609
Ing. Investig. v.30 n.3 Bogotá sep./dic. 2010
Paulo César Narváez Rincón1
1 Chemical Engineering. M.Sc., in Engineering. Ph.D., in engineering, Universidad Nacional de Colombia, Bogotá, Colombia. Research Group on Chemical and Biochemical Processes, Department of Chemical and Environmental Engineering, Universidad Nacional de Colombia. pcnarvaezr@bt.unal.edu.co
ABSTRACT
This article presents an overview of world and Colombian energy sources, including distribution, production and consumption by fuel and end-user sectors, respectively, as well as a brief description of some non-conventional energy sources (NCES), pointing out those classified as bioenergy and used as non-conventional fuels in the transport and electricity generating sectors. Colombian policies for promoting the rational use of energy (RUE) and NCES are presented and their targets are compared to some established by the European Union and the USA.
Keywords: energy, non-conventional energy source, biomass, biofuel.
Received: September 4th 2010
Accepted: november 15th 2010
Introduction
The recent publication of resolution 180919 by the Ministry of Mines and Energy presenting the action plan for developing a programmme for the rational use of energy (RUE) and other non-conventional energy sources (NCES) in Colombia forms part of a series of initiatives by governments from countries on five continents seeking to help them solve some of the most important problems facing society in the 21st century. This includes their dependence on oil as the main source of energy and raw material for many chemicals, the finite nature of this natural resource, the negative impact on the environment of power generation and rural unemployment and underdevelopment.
NCES are intended to increase energy security and independence, reduce greenhouse gas (GHG) emissions and improving the economy's competitiveness, especially in developing countries where they are most needed, due to high unemployment and poverty rates, factors forcing people to move to big cities (internal migration) or to other countries, mainly the USA, Europe and Australia, to seek a better standard of living.
Biomass, sun, wind, waves, water and heat stored in the air and beneath the surface of the earth are energy sources having different levels of technological maturity which are or may be used for gradually replacing oil as the main source of energy. Although all of them are being used, the use of water for generating electricity and biomass for producing biofuels are the most widespread, given their availability, technological maturity and, in the case of liquid biofuels, the possibility of using them without changing the combustion engines of the vehicles we use today.
This article presents an overview of world and Colombian energy sources, including distribution of use by fuel type and end-user sectors. Succinctly, it describes some NCES and specifies those that are classified as bioenergy. Subsequently, Colombian policies for promoting RUE and NCES are presented and their targets are compared to some by the European Economic Community and the USA. It is proposed that academia can play a role in developing and implementting these energy sources.
Energy overview
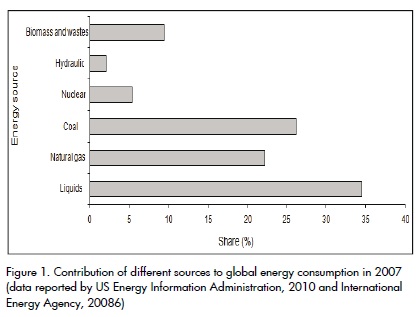
According to the US Energy Information Administration (EIA), world energy consumption in 2007 was 495.2 × 10¹⁵ BTU and 1.4% expected annual growth up to 2035, being higher in countries which are not members of the Organization for Economic Cooperation and Development (US Energy Information Administration, 2010). Liquid fuel, including oil and its derivatives, ethanol, biodiesel, coal liquefaction products and gas are the main sources of energy and contributed about 85 quadrillion BTU in 2007, 35% of the total, although it is expected that their share will decrease by 30% in 2035 (US Energy Information Administration, 2010). Moreover, the International Energy Agency (IEA) has reported that world energy demand will increase from 12,000 million tons of oil equivalent (Mtoe) in 2007 to 16,800 Mtoe in 2030, an increase of 40% (International Energy Agency, 2009). Central and South-American countries consumed only 5.6% of world energy consumption in 2007; share will increase to 5.9% and 6.2% in 2015 and 2035, respectively (US Energy Information Administration, 2010). According to the British Petroleum Company (British Petroleum Company, 2010), global primary energy consumption in 2009 was 11,164 Mtoe, 29.0 of that in Colombia (less than 0.26% of total).
Figure 1 shows the distribution of different energy sources in global consumption for 2007. Fossil fuels were the major source of energy; liquid fuels accounted for 35% and coal for 27%. In 2009, 34.8% of primary energy came from oil, 23.8% from natural gas and 29.4% from coal (British Petroleum Company, 2010). The situation was similar in Colombia and oil accounted for 30.3% of total energy. However, a remarkable difference to global behaviour was that hydropower accounted for 32.1% and coal only 10.7% (despite the availability of this natural resource in Colombia) (British Petroleum Company,2010)
Primary energy consumption in Colombia was 1,134.7 × 1012 BTU in 2005, 24% more than in 1990 and supply was distributed as follows according to source (UPME, 2007): oil 48%, natural gas 21%, hydro 12% and wood and coal 5.5%. Consumption for the same year had the following distribution: gasoline, diesel and other petroleum products 48%, electricity 19%, natural gas 15%, coal 8%, wood and bagasse 7%, and other sources 3% (UPME, 2007).
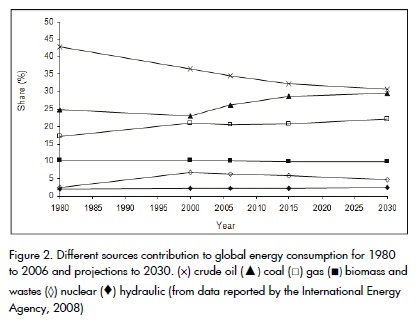
Figure 2 shows the contribution of each energy source to primary energy demand between 1980 and 2006 and projections to 2015, 2030 and 2035 (International Energy Agency, 2009). Oil contribution will decline from 43% in 1980 to 30% in 2030, while hydro, biomass and waste will maintain the same share percentage during these 50 years. Coal, gas and nuclear energy sources will increase their share by 5% for the first two and 2% for the last one.
Fossil fuels will remain the major energy source by 2035 according to EIA projections, although end-use by type of fuel contribution regarding liquid fuels will be constant or will decrease, with the exception of the transport sector, where the absence of significant technological advances will mean that these will remain the primary energy source (US Energy Information Administration, 2010). Likewise, the IEA says that fossil fuels will remain the largest source of primary energy and oil demand will increase by an average of 1% per year, from 85 million barrels per day (bpd) in 2008 to 105 million bpd in 2030, an increase almost entirely attributable to the transportation sector (International Energy Agency, 2009).
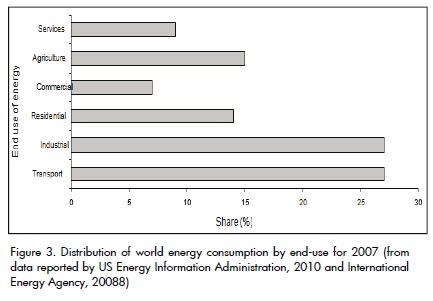
Figure 3 shows energy percentages according to end-use. Around 55% of the energy produced is intended for the transport and Industrial sectors. The highest percentage of energy in these two areas in 2007 came from liquid fuels: the transport sector consumed 50% more energy from liquid fuels, corresponding to 31% of the energy consumed in the sector (US Energy Information Agency, 2010). This data justified many efforts seeking to diversify energy sources focusing on these sectors and fuels.
The EIA expects that liquid fuels' contribution to the energy used in the industrial sector decreased to 25% in 2035, mainly due to the increased contribution of alternative sources to generating electricity and NCES, which will grow from 15% to 21% and 7% to 8%, respectively, between 2007 and 2035. In this year, 61% of energy from liquid fuels will be used in the transport sector, although its contribution in other sectors will decrease (US Energy Information Administration, 2010).
The transport sector in Colombia consumes 39% of all energy and, as in the rest of the world, fossil fuels are the main source, in despite of use of natural gas (CNG) and biofuels, the latter driven by policies encouraging consumption and forcing production (UPME, 2007). Moreover, in 2005, the industrial sector consumed a third of the energy produced in Colombia and ranked as second largest consumer after transport (UPME, 2007). Energy consumption in the residential sector was 17% (UPME, 2007).
The largest percentage of liquid fuels consumed in the world corresponds to oil and its derivatives. World oil production was 3,820 million t6 in 2009, 2.6% less than in 2008, such reduction being due to world energy consumption dropping 1.1% in 2009, the biggest decline since 1990 (British Petroleum Company, 2010). The IEA says that this behaviour was "a result of financial and economic crisis, but with current policies, will quickly start again their upward trend as long-term economic recovery begins" (International Energy Agency, 2009). Oil production in Colombia was 34.1 million t, 12.2% higher than in 2008, and corresponded to less than 1% of world production (British Petroleum Company, 2010).
The ratio between oil reserves and production, resulting in years of availability, was 45.7 years for 2009, while in 2008 it was 44.5 years, such rise being explained by increased reserves in Indonesia and Saudi Arabia (British Petroleum Company, 2010). This ratio has remained above 40 years since 1986, the value for 2009 being the highest in this period because, although oil consumption increased by 10.5% between 1999 and 2009, reserves increased 22.8%. Colombia's reserves were 200 million tones in 2009 so that reserves to production ratio was 5.9 years, while availability was 7.5 years in 1999.
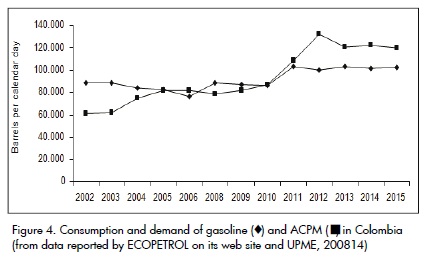
Figure 4 shows the consumption of gasoline and diesel fuel in Colombia until 2006 and the projected demand for them until 2015. It should be noted that from 2010 demand will exceed that of diesel fuel, a situation driven by policies that have kept the price below that of gasoline7
Non-conventional sources of energy
NCES or renewable energy sources are those from non-fossil sources involving wind and sun energy stored as internal energy in the air (aerothermal), below the surface of the earth (geothermal) and water (hydrothermal), ocean energy, hydropower, biomass, landfill gas produced in plants and wastewater treatment and biogas (The European Parliament, 2009).
Biomass is becoming the leading short-term energy source for the effective use of renewable energy sources within the above and from the global perspective of impact on the environment and security and energy supply (Liang, 2008), although wind energy will present the greatest growth from 2007 to 2030 (International Energy Agency, 2009). Bomass is a source of bioenergy which allows the production of fuels such as biogas, bio-hydrogen, biofuels, bioliquids, biocrude and synthetic biogas.
Te rational use of energy (RUE) is also considered a source of energy. Traditionally defined as the installation of technologies that reduce energy loss in homes, buildings and industrial facilities, today this involves much more following the restructuring of policies and offering rewards to consumers who use less energy, until the release of educational programmes to teach students the link between energy use and environment (Cooney, 2008).
Given that 27% of global energy is used by transport and a high percentage of it comes from liquid fuels, especially gasoline and diesel fuel, and a lower proportion of gas fuels such as natural gas, many countries have implemented policies to encourage the use of biofuels (The European Parliament, 2009, Senate and House of Representatives, 2009; CONPES, 2008). The most popular ones in the world are bioethanol and biodiesel which have been used in Colombia since 2005 and 2008, respectively, based on the requirement established by law 693/2001 for ethanol and 934/2004 for biodiesel.
World bioethanol production in 2009 was 57.7 million t, while 241,800 t were produced in Colombia. For biodiesel, 15.2 million t were produced in the world and 257,400 t in Colombia (Biofuels Platform, 2010). According to the Colombian Federation of Biofuels, installed capacity for bioethanol production is 306,000 t yr-1 in six process plants while it is 516,00 t yr-1 for biodiesel in seven process plants.11.
There was a radical change in perspectives about the biodiesel Industry between 2007 and 2009 from the political and scientific debate about the environmental impact of biodiesel to the industry's economic sustainability. For example, change in support policies for biofuels in Germany, substantially reduced demand which fell by 600,000 t from 2008 to 2009 (Lieberz, 2009). It is expected that in 2010 less than 50% of installed capacity for the production of biodiesel in Europe will be used (EU-27) and about 37% for bioethanol(Richey, 2008). Thus, efforts are now focused towards second- and third-generation biofuels which are produced from raw materials that are not used for food, mostly agro-industrial waste or energy
crops that can be used to obtain molecules similar to those currently used in cars, trains and planes, expanding the market, which so far has focused on automobiles and trucks.
Biofuels, bioethanol and biodiesel accounted for only 1.5% of total fuel demand in 2006 and is expected to contribute around 6% in 2030, most provided by bioethanol (International Energy Agency, 2008). Ethanol production was 1.5% of world production of oil and biodiesel in 2009, as little as 0.4%.
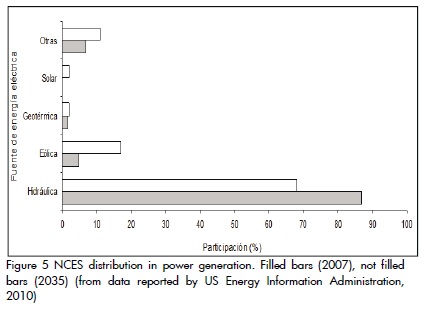
NCES share in power generation was 19% in 2007 and is expected to increase to 23% in 2035, while contribution in the industrial sector will grow from 7.3% to 8.3% over the same period (US Energy Information Administration, 2010). Figure 5 shows the distribution of the share of some of the NCES in electricity generation according to origin. Hydropower provides more than 80% of electricity from renewable sources, wind 4.8%. The EIA projects that behaviour will be similar in 2035, accompanied by significant increases in the share of wind and solar energy increasing from 4.8% to 17.0% and 0.2% to 2.1%, respectively.
63% of the electricity generated during August 2010 in Colombia came from hydropower, while 32% came from thermal power, most fuelled by natural gas which contributed 446 GWh of the 4,821 GWh from the Colombian Interconnected System (CIS), while coal generated 235 GWh (UPME, 2010).
Action plan for promoting RUE and NCES in Colombia
The Colombian Ministry of Mines and Energy adopted an action plan in June 2010 (2010-2015) for developing an RUE and other NCES programme whose objective is to contribute towards the Colombian economy's competitiveness through consumer protection and promoting the sustainable use of non-conventional energy, protecting the environment and natural resources (Ministry of Mines and Energy, 2010).
Moreover, the action plan is aimed at consolidating a culture of efficient and sustainable management of natural resources throughout the energy chain, developing economic, technical, regulatory and communication conditions promoting RUE and NCES, strengthen institutions and promote private, mixed or social capital initiatives for developing programmes and projects and facilitate the implementation of standards and tax incentives (Ministry of Mines and Energy, 2010).
Priority programmes were established according to five sectors: residential, industrial, commercial, public and services and transportation. It is proposed optimising the use of energy for motive power, boilers, combustion processes and the cold chain and URE in small and medium-sized companies in the industrial sector. Conversion technology, best practices and modes of transport are the targets in the transport sector. Electricity saving goals by 2015 in the residential, industrial and commercial public services are 10.6%, 5.3% and 4.4%, respectively. The proposals in the transport sector include 0.44% energy saving by converting articulated buses and a fraction of the other buses and minibuses in the massive transport system (MTS) from diesel powered engines to electric ones, and 0.16% for better driving practices and MTS entering into operation in Bogota (Ministry of Mines and Energy 2010).
Some US and European Union policy goals are presented as an example of efforts to promote global NCES. In the Security Energy Act of 2007, the United States Congress approved a series of actions for energy security by improving fuel efficiency in vehicles, increasing biofuel production, improving energy saving lighting standards, saving energy in buildings and industry and accelerating R&D in solar, geothermal, marine and hydrokinetic energy (Sissine, 2007).
For instance, it is proposed that corporate average fuel economy should be at least 35 miles per gallon while in 2015 federal agencies should save 20% of the oil consumed in 2005 and get 10% alternative sources (Sissine, 2007). The goal for 2025 is that 25% of energy comes from agriculture, forestry and working lands (Sissine, 2007).
Moreover, "in the light of the positions taken by the European Parliament, the Council and the Commission, it is appropriate to establish mandatory national targets consistent with a 20% share of energy from renewable sources and a 10% share of energy from renewable sources in transport in Community energy consumption by 2020" (The European Parliament, 2009).
Conclusion
Although dependence on oil as an energy source will remain dominant for at least the next 25 years, there are remarkable policies which promote the diversification of energy sources. Efforts will focus on the transport and industrial sectors because these sectors together consume more than 50% of global energy and liquid fuels. A common feature in European, American and Colombian policies promoting the efficient use of energy and non-conventional sources
of energy is the need for research programmes and technological development supporting new needs arising from the goals proposed. In this field, as in many aspects of science and technology, it is necessary that each country or region do their own R&D because one of the objectives is to leverage its resources thereby generating employment and rural development may arise from these initiatives.
An example is the case of biofuels; each country researching their own resources. For instance, corn and soybeans for producing bioethanol and biodiesel are investigated in the USA while in the European Union rapeseed and sunflower oil for the production of the latter are being studied. This does not mean basic research in all cases, but laying the foundations for specific aspects of national resources so that most of the benefits remain in the countries producing them.
The university can both generate knowledge and adapt technologies and can help to negotiate these with state of the art knowledge and the true scope and implications of its implementation in the shortand long-term. The university can also educate qualified the necessary personnel for operating and improving technologies that are alreadyin place.Biofuels Platform. 2010. Production of biofuels in the World, data 2009, disponible en http://www.plateforme-biocarburants.ch/en /infos/production.php?id=bioethanol, consultada octubre 23 de 2010 [ Links ]
British Petroleum Company., BP Statistical Review of World Energy, June 2010. disponible en http://www.bp.com/statisticalreview, consultado octubre 25 de 2010. [ Links ]
CONPES 3510. 2008,. Lineamientos de Política para Promover la Producción Sostenible de Biocombustibles en Colombia., marzo 31 de 2008. [ Links ]
Cooney, C., Energy Efficiency as an Energy Resource., Environmental Science & Technology, February 1, 2008, pp. 652-653. [ Links ]
International Energy Agency., World Energy Outlook 2009, Resumen Ejecutivo. disponible en http://www.worldenergyoutlook.org/docs/weo2009/WEO2009_es_spanish.pdf, consultado octubre 25 de 2010 [ Links ]
International Energy Agency., World Energy Outlook 2008, Paris, 2008, pp 78-84. [ Links ]
Liang, D. T., Yan, R., Lee, D. H., Introduction to the Special Section of Energy & Fuels., Bioenergy Outlook 2007, Singapore, Energy & Fuels, Vol. 22, No. 1, January / February 2008. [ Links ]
Lieberz, S., Smaller German Biofuel Mandates Reduce Biodiesel Demand., GAIN Report GM 9032, United States Department of Agriculture, 8/7/2009. [ Links ]
Ministerio de Minas y Energía de Colombia., Resolución 180919., de junio de 2010. [ Links ]
Richey, B., Heute, S., EU 27 Bio-Fuels Annual 2008., GAIN Report E48063, United States Department of Agriculture, 5/30/2008. [ Links ]
Sissine, F., Energy Independence and Security Act of 2007: A Summary of Major Provisions., December 21, 2007. [ Links ]
The Senate and House of Representatives of the United States of America., 2009. American Clean Energy and Security Act of H. R. 2454, 111th Session, 1st Congress, 2009. [ Links ]
The European Parliament and the Council of the European Union. 2009., Directive 2009/28/EC, Official Journal of the European Parliament, 5.6.2009, L140/16. [ Links ]
US Energy Information Administration., International Energy Outlook 2010., Washington DC, 2010, pp. 1-9. [ Links ]
UPME., Plan Energético Nacional 2006-2025., abril de 2007. [ Links ]
UPME., Proyección Oferta de Demanda de Energía para el Sector Transporte Gasolina - Diesel - GNV., julio de 2008 [ Links ]
UPME., Evolución de la Variables de Generación., septiembre de 2010. [ Links ]

