


Services on Demand
Journal
Article
 text in
  Spanish (pdf)
 Article in xml format
 Article references
 Send this article by e-mail
Indicators
-
 Cited by SciELO
 -
 Access statistics
Related links
-
 Cited by Google
 -
 Similars in
SciELO
Similars in
SciELO -
 Similars in Google
Share

 Permalink
Ingeniería e Investigación
Print version ISSN 0120-5609
Ing. Investig. vol.31 no.2 Bogotá May/Aug. 2011
Standardising and validating aromatic profile analysis by an electronic nose
Carlos Mario Zuluaga1, Amanda Consuelo Díaz2, Martha Cecilia Quicazán3
1 Chemical Engineer, Master in Food Science and Technology, Universidad Nacional de Colombia. Ph.D. student of Chemical Engineering, Universidad Nacional de Colombia, Colombia. cmzuluagad@unal.edu.co
2 Food Engineering , Universidad de la Salle. Doctor Quality, Safety and Food Technology, Universidad de Zaragoza, Spain. Assistant Professor, Universidad Nacional de Colombia. amcdiazmo@unal.edu.co
3 Chemical Engineering, Universidad Nacional de Colombia. Master in Food Science and Technology, Universidad de La Habana, Cuba. Associate Professor, Universidad Nacional de Colombia. mcquicazand@unal.edu.co
ABSTRACT
The electronic nose is one of the most innovative techniques which had been used in the analysis of food and other aroma matrices. This device imitates the human olfactory system through sensors which are partially specific for different groups of volatile chemicals and differentiating and classifying food (by involving multivariate statistics) and it is also used for establishing quality and control parameters. Although the technique has been increasingly applied in research and industry, few studies have been published in the scientific literature referring to validating its use as an analytical methodology. This work' s main objective was to standardise and validate the aromatic profile analysis method for differentiating apiculture products: honey, pollen and propolis. Standardisation involved modifying sample preparation and system variables while validation involved analysis of repeatability and intermediate repeatability of the method and establishing its uncertainty. The results showed that it was possible to set suitable operational parameters for each apicultural product while validation data showed that this technique did not reveal significant differences as reliable values were obtained when using this device as an analysis and quality control tool.
Keywords: Repeatability, intermediate repeatability, uncertainty, aromatic profile, food.
Received: May 10th 2010
Accepted: July 17th 2010
Introduction
There is an ongoing need for developing reliable analytical methods for food analysis which can be evaluated by validation. The Official Journal of the European Community defines validation as, "Confirmation by examination and provision of objective evidence that the particular requirements for a specific intended use have been fulfilled." (CCE, 2002) In other words, it refers to evaluating the performance of an instrument or methodology whose ultimate goal is to provide objective evidence that a particular method will have acceptable and accurate reproducibility to be applicable (Walton, 2001).
The following information should be considered as support for evaluating an analytical procedure: a description of such method including details re operational parameters such as sample preparation, extraction method, reference standards and reagent preparation. The most relevant characteristics when validating an analytical method are specificity, linearity, precision, accuracy, range, detection limits and quantification and robustness which can be partially or fully implemented depending on the nature of the test (APVMA, 2004).
The Universidad Nacional de Colombia' s Institute of Food Science and Technology (ICTA) has been running a research project entitled, "Selecting physical-chemical indicators by applying an electronic nose for cataloguing bee products," (funded by the Ministry of Agriculture and Rural Development). Its objective is to improve apicultural commercial chain competitiveness by developing the scientific and technological tools required for characterising bee products and in the near future to promote quality labels, such as Designation of Origin, for differentiated hive products considering this production chain' s great potential in Colombia.
A methodology for obtaining honey, pollen and propolis' aromatic profile by using an electronic nose was standardised and validated during this project' s first stage; its results are presented in this article. An electronic nose consists of four main elements, it has a technique for extracting aroma or air-flow system which transports volatile compounds to the next step, an array of chemical sensors which transform aroma into electrical signals, an instrumentation and control system for measuring the signal from different sensors and control and automation for the entire system (Mannino et al., 2007). Combining an array of sensors provides a global signal called a "fingerprint" as a simple response (i.e. a characteristic aroma for a particular sample) (López-Feria et al., 2008).
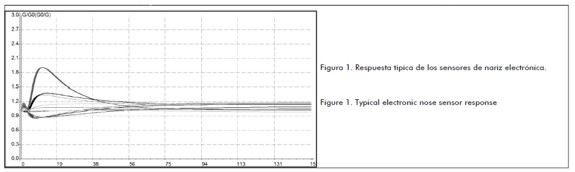
The basic principle of electronic nose operation consists of injecting the headspace (gas space occupied by volatile elements in a vial) with the sample placed in a 20 mL chromatographic vial. Sample amount should not exceed more than 1/3 of vial volume at any time; the sample is then left for an established time and temperature to reach volatile compound concentration equilibrium. A dimensionless conductivity ratio is obtained (G/Go) after injecting the headspace recording time for each electronic nose sensor; this data is related to the conductivity value reported by each sensor in its natural state (Go) and the recorded one when the gaseous substance passes through it (G) (see Figure 1). The expected condition gives a stable response in the shortest time.
The usefulness of electronic noses for classifying and differentiating food industry process control and product quality according to geographical origin has been demonstrated in the scientific literature (Aleixandre et al., 2008; Ampuero et al., 2004; Benedetti et al., 2004; Cosio et al., 2006; Lammertyn et al., 2004); however, no reports were found regarding the methodology' s standardisation and validation for analysing an aromatic profile. The method was thus standardised by finding operating and sample preparation parameters for ensuring an appropriate and reproducible device response. Once such parameters had been found, validation led to evaluating whether the proposed method could be applicable; given the nature of assessing this technique, it was established that the most important characteristics for such validation were accuracy, repeatability and intermediate reproducibility, thereby guaranteeing that the data collected would be reliable and reproducible.
Precision is an instrument' s ability to give the same result when different measurements are made in the same conditions. Repeatability (r) is related to the range of values which may be obtained from an instrument' s response when several measurements are made in the same material, equipment, environmental and operator conditions in a short period of time. It is calculated by subtracting the highest and lowest results of each operator' s analysis and for each electronic nose sensor (equation 1) (INS, 2005).
 | [1] |
Intermediate repeatability (R) is related to the range of values obtained by an instrument' s response within the same laboratory but using different operators, days, equipment and/or reagent lots. Its calculation is similar to that for repeatability but this time by subtracting the lowest from the highest result for all results obtained (Equation 2) (INS, 2005).
 | [2] |
Experimental procedure
Materials
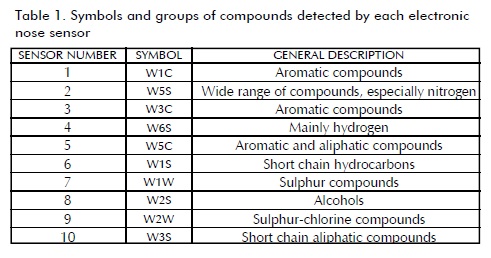
A PEN3 electronic nose (Airsense Analytics GmbH, Germany) was used; this device has a 10 metal oxide sensor (MOS) array (Table 1). Honey, pollen and propolis samples were provided by the beekeepers' associations involved in the aforementioned project.
Standardisation parameters
Standardisation parameters
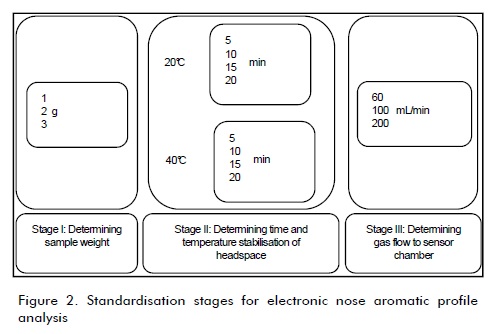
The same procedure was followed for each hive product, varying both product (sample weight) and equipment operation conditions (vial conditioning temperature, sensor chamber headspace and gas flow stabilisation time) during three stages (Figure 2). The first stage evaluated the sample weight factor with three levels (1, 2 and 3 g), the second assessed two factors (headspace time and stabilisation temperature) having four levels each (5, 10, 15 and 20 min) and the third considered gas flow to the sensor chamber having three levels (60, 100 and 200 mL/min). Three repeats were made for each level. The most appropriate conditions were selected based on the sensors' most stable response and least variability. Once the best value at each stage had been selected it was used as a parameter in the next one.
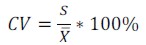
The coefficient of variation (CV) value was used as factor criteria during standardisation stages; this measurement of dispersion is useful for stating the mean  and standard deviation (s), according to equation 3:
 | [3] |
Validation parameters
Honey, pollen and propolis values' repeatability and intermediate repeatability were assessed to validate the analytical methodology with different analysts and on different days. These parameters were established for each electronic nose sensor. Five repeats were made per test. A Student' s t-test was performed for evaluating repeatability to find statistically significant differences between different analysts and different days. An α = 0,05 significance value was used. Microsoft Excel was used for statistical analysis. Equation 4 was used for calculating uncertainty due to precision (U) by relating standard deviation data (SD) and the number of times a sample was analysed (N) (Maroto et al., 2003; Reutemann and Huber, 2003):
 | [4] |
Results
Standardisation
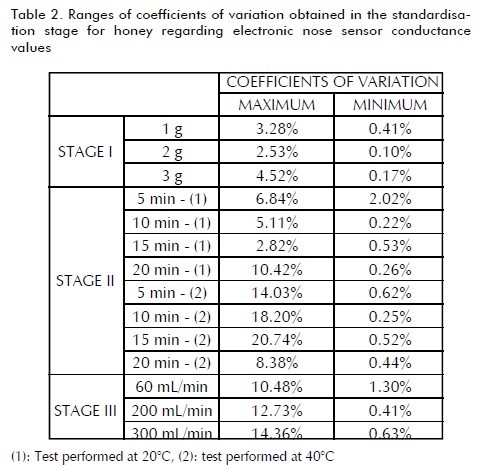
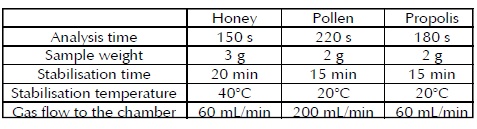
Tables 2, 3 and 4 summarise the results for the honey, pollen and propolis standardisation stage, respectively, showing just the maximum and minimum values from 10 electronic nose sensors' responses. Variation in sample weight (stage I) for honey (Table 2) established that the heavier the sample size, the higher the sensors' coefficient of variation response. It was also observed that these sensors' response stability was greater with a 3 g sample weight so that amount was used in the later stages. Headspace temperature and conditioning time variation revealed that the best response was obtained in 20 min at 40ðC; a stable response was given in a shorter analysis time than others, even though not having responses from the sensors having the least variability. This stage also established that a 150 s analysis time was sufficient to ensure response stability. It was found that response was affected by the amount of gas entering the chamber in the last stage; therefore, lower variability was found when dealing with flows as low as 60 mL/min and this would lead to expecting reliable results.
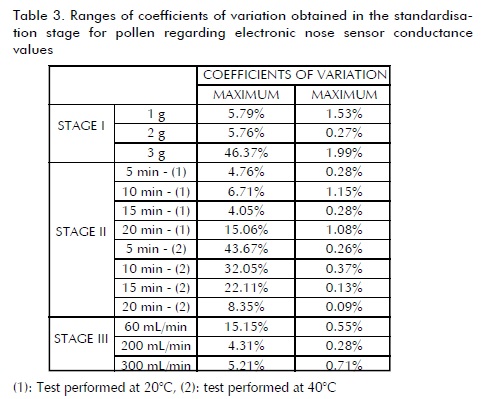
Stage I showed a stable sensor signal in pollen (Table 3)) with a 2 g sample weight. It was found that the amount of sample greatly affected response repeatability. Stage II led to concluding that applying higher temperatures to the vial did not significantly reduce analysis time compared to room temperature; 15 min headspace stabilisation time was enough for obtaining a suitable response, with little variability and in a short injection time (220 s). Unlike the findings for honey analysis, high gas flows into the sensor chamber led to obtaining a more stable response; values greater than 200 mL/min had minimal variability.
Stage I for propolis (Table 4) was conducted with 1 and 2 g weight samples due to the product' s size; higher weights occupied more than 1/3 of the vial. Sample size could not be easily reduced because very small particles may have caused severe damage to the sensors; it was found that 2 g provided stable responses with less variability. Stage II led to observing that heating was unnecessary for obtaining a stable signal response since conductivity values were similar at room temperature; a 15 min stabilisation time offered a less variable response signal. It was determined during this same stage that a 180 s analysis time was sufficient for achieving total stability for the 10 sensors.
Validation
Once the analysis parameters from the standardisation stage had been established then they were validated. The results from calculating the coefficient of variation and repeatability are shown in Table 5 for honey, pollen and propolis; maximum and minimum values found from the 10 electronic nose sensors are shown.
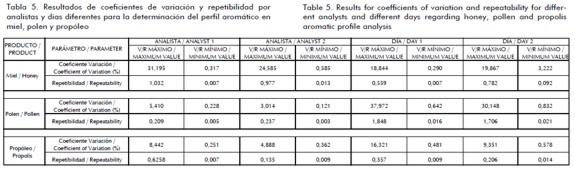
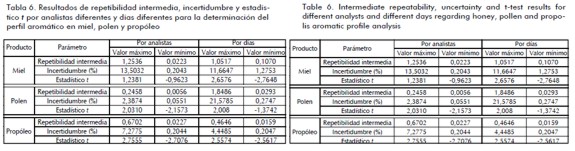
Table 6 shows the range of intermediate repeatability, uncertainty, and t-test values for mean analysis (± 2.7764 critical value).
Overall, it appeared that volatile compound analysis repeatability when using an electronic nose had reduced variability. Some authors have reported less than 2% reference values when assessing the accuracy of methods based on volumetric and chromatographic coefficients of variation (Boqué et al., 2008; Reutemann and Huber, 2003), less than 3% for spectrophotometric methods (Perel et al., 1978) and less than 5% for microbiological methods (Nguz, 2007). Aromatic profile analysis using an electronic nose ranged from 7%-10% for honey, 1% to 4% for pollen and 2%-7% for propolis; this meant that liquid samples has a higher variable response.
T-test analysis results for accuracy between different analysts and different days revealed no statistical differences for all cases, meaning that bee product aromatic profile analysis results using an electronic nose were repeatable for each sensor. Different analysts' uncertainty values were especially low regarding pollen and propolis; uncertainty for honey exceeded 1% in most cases. Sensor response uncertainty was low in pollen and propolis on different days but exceeded 5% in most sensors for honey.
Comparing values with other analytical methods having higher uncertainty, the aromatic profile methodology was reliable, given the specificity and selectivity of this type of analysis compared to chromatographic methods capable of separating compounds, while this approach identified patterns or "fingerprints", groups of substances having common characteristics detected by sensors through changes regarding conductivity. An electronic nose does not work with linear responses, i.e. responses are subject to certain conditions set forth in standardisation allowing more stable responses in the shortest possible analysis time.
Conclusions
A methodology for aromatic profile analysis in honey, pollen and propolis was standardised, the following operating conditions being the most appropriate ones:
Validating analytical methodologies established that methods were statistically precise and repeatable by analysing aromatic profile measurement on different days and by different analysts. Uncertainty values for repeatability and intermediate repeatability for electronic nose sensors in honey ranges from 1% to 10%, 0.5% - 5% in pollen and 0.2% - 5% in propolis meaning thatit can be concluded that honey was the product where sensors provided the most variable response. Liquid samples usually have such pattern while solid matrices tend to have lower uncertainty. These results represent an initial step for future applications of the electronic nose in several fields, especially in quality control. Different laboratories around the world now focus on developing new technologies for assessing substances' aromatic behaviour to find instruments which are able to provide more precise responses. Further investigation is still required in this field.
Acknowledgements
The authors wish to acknowledge the support for carrying out this work provided by the Universidad Nacional de Colombia’s Institute of Food Science and Technology (ICTA) in Bogota, the Ministry of Agriculture and Rural Development, the Sumapaz Region Beekeepers’ Association, the Boyacá Beekeepers’ Association, the Comunera Beekeeping Association, the Association of Beekeepers from Sierra Nevada de Santa Marta, the Colombian Science, Technology and Innovation Department’s (COLCIENCIAS) Young Scientists and Innovative Program and the Science and Food Technology Master’s Program run by the Faculty of Agricultural Sciences at the Universidad Nacional de Colombia in Medellín.
References
Aleixandre, M., Lozano, J., Gutiérrez, J., Sayago, I., Fernández, M., Horrillo, M., Portable e-nose to classify different kinds of wine., Sensors and Actuators, B 131, 2008, pp. 71 - 76. [ Links ]
Ampuero, S., Bogdanov, S., Bosset, J., Classification of unifloral honeys with an MS-based electronic nose, using different sampling modes: SHS, SPME and INDEX., European Journal of Food Research and Technology, 218, 2004, pp. 198-207. [ Links ]
APVMA., Guidelines for the validation of analytical methods for active constituent, agricultural and veterinary chemical products., Australian Pesticides & Veterinary Medicines Authority, Kingston, Australia, 2004. [ Links ]
Benedetti, S., Mannino, S., Sabatini, A., Marcazzan, G., Electronic nose and neural network use for the classification of honey., Apidologie 35, 2004, pp. 397-402. [ Links ]
Boqué, R., Maroto, A., Vander, Y., Assessment of accuracy in chromatographic analysis., LCGC Europe 21, 2008, pp. 15- 21. [ Links ]
CCE., Decisión de la Comisión por la que se aplica la Directiva 96/23/CE del Consejo en cuanto al funcionamiento de los métodos analíticos y la interpretación de los resultados., Diario Oficial de la Unión Europea, 2002. [ Links ]
Cosio, M., Ballabio, D., Benedetti, S., Gigliotti, C., Geographical origin and authentication of extra virgin olive oils by an electronic nose in combination with artificial neural networks., Analytica Chimica Acta, 567, 2006, pp. 202-210. [ Links ]
INS., Selección y validación de métodos de ensayo., Instituto Nacional de Salud. Lima, Perú, 2005. [ Links ]
Lammertyn, J., Veraverbeke, E., Irudayaraj, J., Nose technology for the classification of honey based on rapid aromaprofiling., Sensors and Actuators, B 1, 2004, pp. 54 - 62. [ Links ]
López-Feria, S., Cárdenas, S., García-Mesa, J., Valcárcel, M., Simple and rapid instrumental characterization of sensory attributes of virgin olive oil based on the direct coupling headspace-mass spectrometry., Journal of Chromatography A 1188, 2008, pp. 308 - 313. [ Links ]
Mannino, S., Benedetti, S., Buratti, S., Cosio, M., Scampichio, M., Electrochemical sensors for food authentication., Electrochemical Sensor Analysis, Elsevier, 2007, pp. 1091-1098. [ Links ]
Maroto, A., Boqué, R., Riu, J., Rius, X., Cálculo de incertidumbre en medidas químicas: Análisis cromatográfico., Departamento de Química Analítica y Química Orgánica, Instituto de Estudios Avanzados, Universitat Rovira i Virgili, 2003, pp. 1-10. [ Links ]
Nguz, A., Uncertainty associated with microbiological analysis., Strengthening fishery products health conditions, Belgium, 2007. [ Links ]
Panigrahi, S., Balasubramanian, S., Gu, H., Logue, C., Marchello, M., Design and development of a metal oxide based electronic nose for spoilage classification of beef., Sensors and Actuators, B 119, 2006, pp. 2 - 14. [ Links ]
Perel, M., Kiryanov, A., Krivut, A., Increase in accuracy of the spectrophotometric method of analysis as a result of the introduction of an instrumental correction., Pharmaceutical Chemistry Journal 12, 1978, pp. 1088-1091. [ Links ]
Reutemann, G., Huber, H., Validation of titration methods., Switzerland: Mettler-Toledo, 2003, pp. 1-28. [ Links ]
Walton, R., Validation of Laboratory Tests and Methods., Seminars in Avian and Exotic Pet Medicine ,10, 2001, pp. 59-65. [ Links ]

