


Services on Demand
Journal
Article
 English (pdf)
 Article in xml format
 Article references
 Send this article by e-mail
Indicators
-
 Cited by SciELO
 -
 Access statistics
Related links
-
 Cited by Google
 -
 Similars in
SciELO
Similars in
SciELO -
 Similars in Google
Share

 Permalink
Ingeniería e Investigación
Print version ISSN 0120-5609
Ing. Investig. vol.31 suppl.2 Bogotá Oct. 2011
Methodology for assessing the impacts of distributed generation interconnection
Metodología para evaluar los impactos de interconectar generación en los sistemas de distribución
Luis E. Luna1 and Estrella E. Parra2
1 Electrical Engineer, Colombian School of Engineering ''Julio Garavito'', M. Sc. National University of Colombia. Ph.D. (Candidate), National University of Colombia, luisluna84@gmail.com
2 Electrical Engineer, National University of Colombia, Specialist in Power Systems, National University of Colombia Teacher, eeparral@bt.unal.edu.co
ABSTRACT
This paper proposes a methodology for identifying and assessing the impact of distributed generation interconnection on distribution systems using Monte Carlo techniques.This methodology consists of two analysis schemes: a technical analysis, which evaluates the reliability conditions of the distribution system; on the other hand, an economic analysis that evaluates the financial impacts on the electric utility and its customers, according to the system reliability level.
The proposed methodology was applied to an IEEE test distribution system, considering different operation schemes for the distributed generation interconnection. The application of each one of these schemes provided significant improvements regarding the reliability and important economic benefits for the electric utility. However, such schemes resulted in negative profitability levels for certain customers, therefore, regulatory measures and bilateral contracts were proposed which would provide a solution for this kind of problem.
Index terms: distributed generation, reliability assessment, Monte Carlo techniques
RESUMEN
Este trabajo propone una metodología para identificar y evaluar los impactos de interconectar generación en los sistemas de distribución, utilizando técnicas de Monte Carlo.Dicha metodología está compuesta por dos esquemas de análisis: uno técnico que evalúa las condiciones de calidad del servicio con las que cuenta el sistema de distribución, y por otro lado, un análisis económico que evalúa el impacto financiero sobre el operador de red y sus clientes, de acuerdo con el nivel de calidad del servicio del sistema.
La metodología propuesta fue aplicada a un sistema de distribución de prueba IEEE, considerando diferentes esquemas de operación para la interconexión de generación distribuida. La aplicación de cada uno de estos esquemas, trajo consigo mejoras significativas en la calidad del servicio suministrado e importantes beneficios económicos para el operador de red. Sin embargo, dichos esquemas implicaron niveles de rentabilidad negativa para ciertos clientes, por lo tanto, se propusieron medidas de carácter regulatorio y contratos bilaterales, que permitirían dar solución a este tipo de problemas.
Palabras claves: Generación distribuida, calidad del servicio, técnicas de Monte Carlo.
1. Introduction
Due to growing demand and concern over environmental pollution, new electricity generation with technological alternatives having the lowest impact on the environment is becoming a global reality. This situation has led to implement the concept of small generating units located near to consumption points, incorporating the electrical system backup, as an option of great penetration in the electric sector commonly known as distributed generation (DG).
The worldwide acknowledgment of DG inclusion in power systems and the incentives for optimizing energy resources has received great interest. This situation has mainly been guided by environmental statutes aimed at providing greater coverage, quality and better costs for customers. Hence, some countries have modified their regulatory policies to promote the installation of DG systems, allowing such plants to become competitive compared to large-scale generators. Although implementing DG is not prohibited in Colombia, no market schemes or interconnection technical specifications have been established for DG.
The DG integration leads to a certain technical and economic impacts on distribution networks, because power systems were not designed to incorporate power generation sources into distribution levels. Such impacts should thus be estimated and studied before allowing DG to participate in the market. Since reliability represents a key distribution system performance measurement, due to its high impact on costs and customer satisfaction, then it represents an important aspect when evaluating DG interconnection feasibility.
This paper proposes a methodology for evaluating the technical and economic impacts of these generation sources through stochastic simulation techniques to contribute to feasibility studies regarding DG interconnection in distribution systems.
It begins by providing an overview of reliability assessment and requirements of the incentives and compensations scheme due to the reliability supplied. It then describes the methodology proposed which evaluates the DG effects by a balance between performance and costs. Finally, it applies this methodology to a distribution system and it identifies regulatory strategies when DG interconnection is not profitable.
2. Reliability assessment
The Colombian regulatory policies established by CREG 097 resolution (CREG097, 2008), provided the rules for electric utilities concerning distribution system reliability. Such rules were defined in an incentives and compensations scheme aimed at stimulating the ongoing improvement of reliability.
Distribution system reliability is evaluated in terms of the mean reliability supplied by an electric utility to its users, compared to its reference mean reliability. Such mean reliabilities are expressed as the following indexes:
- IRAD reference index, which determines the mean reliability level that has been supplied quarterly by an electric utility to its customers.
- ITAD performance index, which determines the reliability level supplied by an electric utility during the calculation quarter.
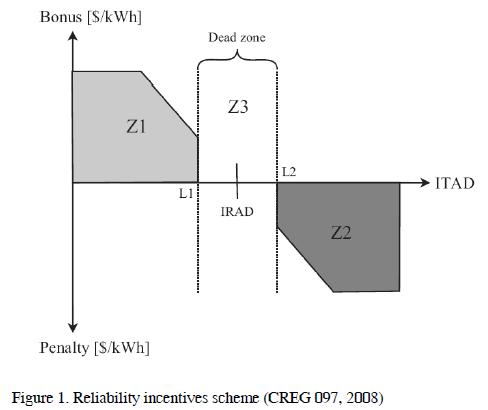
These indexes relate the average amount of Energy Not Supplied (ENS) per unit of Energy Supplied (ES) by an electric utility. Depending on the amount of ENS during a calculation quarter regarding the reference level, an incentives scheme will be applied to the electric utility allowing it to receive a bonus or a penalty.
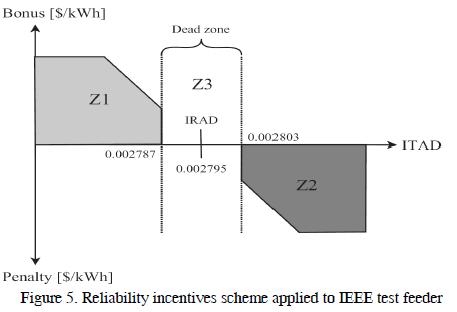
The incentives scheme consists of a dead zone (Z3) where neither a penalty nor a bonus will be assigned. If reliability is worse than the dead zone boundary (Z2), a penalty is assessed. The penalty increases as performance worsens and it is capped when a maximum penalty is reached. Rewards for good reliability can be implemented in a similar way. If reliability is better than the dead zone boundary (Z1), a bonus is given. The bonus grows as reliability improves and it is capped at a maximum value. The scheme so described is presented in Figure 1.
The incentives scheme is complemented by a compensations scheme to ''worst served'' customers, which seeks to reduce the dispersion of reliability supplied by an electric utility around its mean reliability. This will ensure a minimum level of reliability for customers.
The regulatory scheme's object is to ensure ongoing improvement reliability. This allows electric utility to increase historic levels of reliability for the whole distribution system.
The incentives and compensations applied to electric utility are directly included in customers' electricity bill, therefore, they are who promote the reliability improvement.
A. Methods for Reliability Assessment
The object of electrical network reliability assessment is to determine indexes reflecting the electricity continuity on distribution systems, substations, circuits or defined regions.
Besides providing a set of indexes, reliability assessment can be used for determining how a system can fail, the consequences of such failure, and it also provides information for the electric utility to relate the quality of its system to capital investment (Brown, Burke, 2000). By doing so, a utility may have a more efficient distribution system and greater knowledge about its system's operation.
Reliability evaluation techniques can be based on analytical methods or simulation methods (Billinton, Jonnavithula, 1997).
Analytical methods generally involve base conditions and include a combination of reliability parameters of the system components by applying mathematical tools that quantify the reliability supplied. It is also used as reference, state diagrams, logic diagrams, etc, depending on the case and accuracy required. One of the most popular techniques in systems evaluation using analytical methods is called the Markov model.
Simulation methods generate an artificial history of the system by using computational tools, assuming probability distributions for each component which represent their operation conditions. One of the most popular techniques in systems evaluation using simulation methods is called Monte Carlo.
Both methods have advantages and disadvantages depending on the scenarios considered, the system features, the available tools and the desired accuracy in studying a particular system, which should be considered when choosing a reliability evaluation method.
3. Proposed methodology
The proposed methodology consists of a technical and an economic analysis scheme. The technical analysis evaluates the distribution system reliability conditions and the economic analysis evaluates the financial impacts on the electric utility and its customers, according to system's reliability level.
In order to carry out the methodology application, it is necessary as a first step to simulate a reference period leading to determine the reliability level annually provided by the electric utility to its customers. However, if the utility has historical information about its reliability behavior, then this step is unnecessary. To simulate the reference period, it is necessary to model the distribution system without considering the DG interconnection, and the iterative simulation procedure described below (section III-A) is then applied. This procedure is executed until the variation coefficient for all the evaluated indexes becomes lower than the present value (for example, 5%).
Then, the assessment periods of the reliability supplied by electric utility to its customers are simulated. For simulating the first period, the iterative simulation procedure is applied for the same operation scheme (without DG), which is executed until the number of preset iterations is fulfilled (for example, 10000). Finally, each operation scheme for the DG interconnection which it is desired to evaluate is simulated. For each scheme, it is necessary to model the distribution system considering three variables:
- The location of DG units in the system customers.
- The installed capacity of each DG unit.
- The generation technologies that wish to be studied for each DG unit, depending on the primary energy sources available at the installation site.
Once the distribution system with the DG interconnection has been modeled, it is applied the iterative simulation procedure which is executed until the number of preset iterations is fulfilled.
A. Iterative Simulation Procedure
The computational tool which was designed for implementing the proposed methodology (Luna, Parra, 2011) is summarized below:- A year of study is chosen. Taking a given reference (date and hour), the study time is initialized to zero.
- Considering an n-1 contingency level and assuming that the system is operating normally, it is generated for each system components a random number between 0 and 1 from a uniform distribution for that range. By the inverse transformation method and using the probability density function of each component, such random numbers are converted to times to failure (Tf).
- We proceed to determine the faulty component as the one with the lowest Tf. The simulation will advance from the reference moment to the Tf of the faulty component.
- Based on the assignation of the faulty component, the distribution system is reconfigured either to a single subsystem (supplied by power system or by DG units) or two subsystems (the first one supplied by power system and the other one by DG plants), basically depending on three variables: the existence of DG, the installed capacity of these plants, and the fault location.
- The fault condition for a load point is defined if:
- The load point is isolated from both the power system and the DG, or
- The voltage in its Point of Common Coupling (PCC ) is outside the voltage regulation limits, for which the AC load flow is used.
- A repair time (Tr) is assigned for the faulty component, following the same procedure described in step 2.
- The study time will advance to the instant Tf + Tr, so that the system is again in normal operating conditions. The times to failure and repair times of the components are sequentially added until reaching a year corresponding to an iteration.
- Once each iteration has been completed, the following reliability indexes are calculated for each load point: interruptions duration, energy not supplied, total consumed energy, consumed energy from power system, and consumed energy from DG sources if exists DG. These indexes allow assessing the distribution system reliability and the ITAD index.
On the other hand, the following variables are calculated: financial incentives and compensations for the electric utility, and the customers' electricity bill. These variables allow evaluating the behavior on the electricity bill of each system customer, and the behavior on financial benefits or penalties for the electric utility due to reliability supplied.
- The preset number of iterations and variation coefficient for all the indexes are used as stop criteria for the simulation.
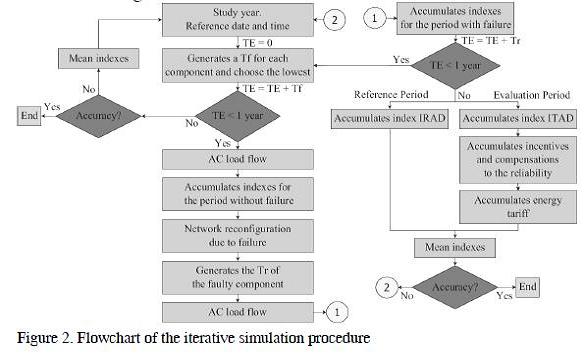
- At the end of the iterative simulation procedure, each one of the indexes and variables is fitted to a probability density distribution that models its behavior.
The simulation procedure described above is presented on a flowchart in Figure 2
B. Result Analysis
Once the simulation of both the reference period and the assessment periods has been completed, the following analysis is made:- Analyzing and comparing the reliability index (ITAD), for the two operation schemes (with and without DG).
- Studying and comparing the incentives and compensation due to the reliability supplied, for the two operation schemes (with and without DG).
- Evaluating and comparing the electricity bill of each customer, for the two operation schemes (with and without DG). The customers who would install DG units would have a more detailed study, orientated towards calculating the estimated time for recovering investment costs due to the installation of these plants, according to the technology used.
These results allow through a balance between performance and costs, contribute to feasibility studies for DG interconnection in customer installations.
C. Methodology Considerations
- The DG units are installed directly by customers and these units operate as backup plants, so that when the distribution system is in normal operating conditions, the DG exclusively supplies to the customer owns the plant. However, when a fault occurs in the system and consequently the power supplied to some customers is interrupted, the DG supplies electricity to those customers depending on the fault location, and the relationship between the DG installed capacity and the power demanded by such customers.
- The simulation technique used corresponds to Monte Carlo sequential of mixed time (Billinton, Jonnavithula, 1997), therefore the methodology designed was adapted to the guidelines proposed by this technique. These guidelines consist in that the simulation time increases at irregular intervals, and the use of hourly demand curves for each customer.
- The methodology was adapted for its application to the Colombian regulatory conditions related to:
1. The voltage regulation limits (ICONTEC, 2004), which correspond to 0:9 < V p:u < 1:1.
2. The incentives and compensations scheme (CREG 097, 2008) described in section II, which promotes the improvement in the reliability supplied by electric utility.
3. The tariff scheme for energy commercialization in the regulated customers (CREG 119, 2007).
- The ITAD reliability index and the incentives and compensations scheme adopted in the methodology are not evaluated quarterly as described in section II, but annually. This is because the period of time defined for each Monte Carlo iteration is one year.
4. Methodology application
A. Test feeder
The proposed methodology was applied to the distribution system IEEE 34 node test feeder (IEEE, 2001), shown in Figure 3.
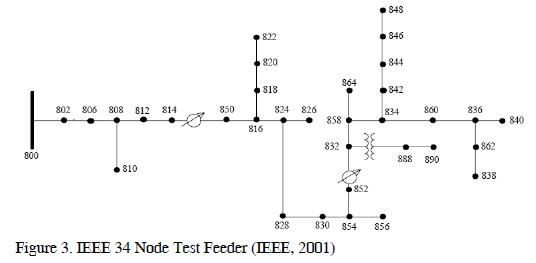
The feeder's nominal voltage is 24.9 kV, and it is characterized by:
- Very long and lightly loaded.
- Two in-line regulators.
- An in-line transformer reducing the voltage to 4.16 kV.
- Unbalanced loading with both ''spot'' and ''distributed'' loads.
- Shunt capacitors.
For this application case, the distribution system does not consider the two in-line regulators, the in-line transformer and the shunt capacitors. Additionally, all the loads are considered ''spot''.
B. Distribution System Modeling
1. Reliability Model of Components:
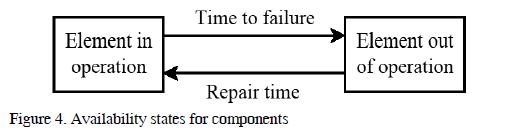
For the system components such as generation units, distribution lines and transformers, a two states model is used to represent their availability, which is shown in Figure 4. This model is equivalent to a continuous time process for a repairable component, and it is constructed from historical information about output events and their corresponding reconnection times.
The statistical parameters assumed for generation units were obtained from the Roy Billinton Test System (RBTS) (Billinton, 1989). On the other hand, the statistical parameters assumed for lines were obtained from the Billinton test distribution circuit (Billinton, Allan, 1984), where the failure rates are proportional to the length.
The times to failure and repair times of generation units and lines, were fitted to an exponential probability density distribution.
2. Electrical Model of Components and Demand:
The traditional models for load flow are used, therefore, the positive sequence of impedances and admittances for lines and transformers is required. The generators are modeled by an ideal voltage source in series with its equivalent impedance (+ sec.).
The demand model for the load points consists of hourly active and reactive power curves, therefore, the demand for each load point in the test system was adjusted to the behavior of the typical Colombian hourly demand curve. The maximum value of the demand curves for each load point correspond to its respective data provided of active and reactive power.
C. Result Analysis
1) Reliability reference conditions:
In order to carry out the methodology implementation, initially, it was necessary to simulate a reference period because there was not historical information regarding the reliability supplied. To simulate this reference period, the IEEE test feeder was modeled without considering the DG interconnection, and the iterative simulation procedure described in section III-A was then applied. This procedure was executed until the variation coefficient for all the evaluated indexes was lower than 5%, for which it was necessary to simulate 342 years. This reference period led to determining among others, the dead zone for the incentives scheme that is shown in Figure 5.
2) Characteristics of DG units interconnected to system:
Next, the assessment periods of the reliability supplied by electric utility to its customers were simulated.
For simulating the first assessment period, the iterative simulation procedure was applied for the same operation scheme (without DG) which was executed for 10000 years of analysis.
After, two assessment periods were simulated which considered different operation schemes for the DG interconnection in the test system. For simulating each of these periods, the iterative simulation procedure for 10000 years of analysis was applied.
The characteristics of the DG units considered in each of these schemes are shown in Table 1. However, it should be noted that the generation sources capacities are theoretical and do not represent the construction standard capacities for these sources.
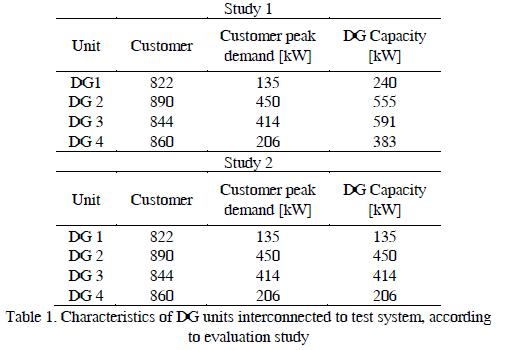
The first study implies the simultaneous installation of four DG units, located in the test system customers with the highest electricity consumption. The capacities of these generation sources allow supplying the total demand of the distribution system in a fault condition in the power system. This interconnection scheme represents a very optimistic condition, because it evaluates the simultaneous installation of four DG units in a distribution system as lightly loaded as the one designed by the IEEE.
On the other hand, the second study considers the simultaneous installation of four DG units, located in the same customers with the highest demand. However, this study assumes that the capacities of the DG plants adequately represent the peak demand of the respective plant owner customers, which is a more realistic situation.
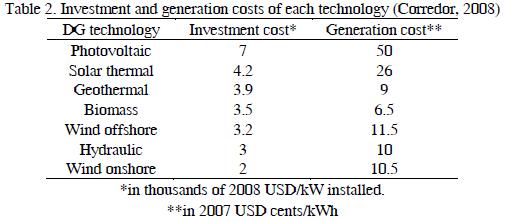
For the application of these studies that consider the DG interconnection, it was necessary to define the generation technologies to be analyzed for these plants which corresponded to renewable sources, and they are presented below:
- Photovoltaic system
- Solar thermal system
- Geothermal
- Biomass
- Wind onshore
- Hydraulic
- Wind offshore
Also, it was required certain information of the DG technologies considered. This information consists of the investment and generation costs of each technology, which are presented in Table 2 (Corredor, 2008).
3) The technical impacts for system
The technical impacts for system were quantified by the reliability index ITAD, which was assessed for each operation scheme in study (with and without DG). The results of this analysis are presented in Table 3.
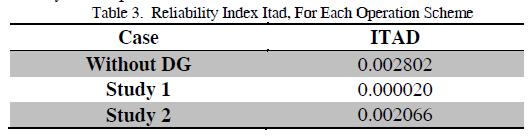
Based on the results presented in Table 3 and Figure 5, it was observed that without DG interconnected to test system, the estimated value of the ITAD reliability index came within the dead zone for the incentives scheme or zone number three (Z3).
The execution of the first study would imply large reductions in the estimated value of the ITAD, regarding the reference conditions offered by the dead zone. This produces that the mentioned value take place on the left hand edge of zone number one (Z1), because the operation scheme designed for this study led to ensuring an excellent reliability for system customers.
The application of the second study would bring small reductions in the estimated value of the ITAD reliability index, regarding the reference conditions offered by the dead zone. This produces that the mentioned value takes place on the right hand side of zone number one (Z1), because the operation scheme designed for this study does not provide great benefits to the test system reliability, however, it represents a more realistic situation.
The location of the estimated value of ITAD in the reliability incentives model involves certain economic impacts for the electric utility that must be quantified and analyzed. These impacts are discussed in the next section (IV-C4).
The behavior of the ITAD index for each operation scheme in study is shown in Figure 6.
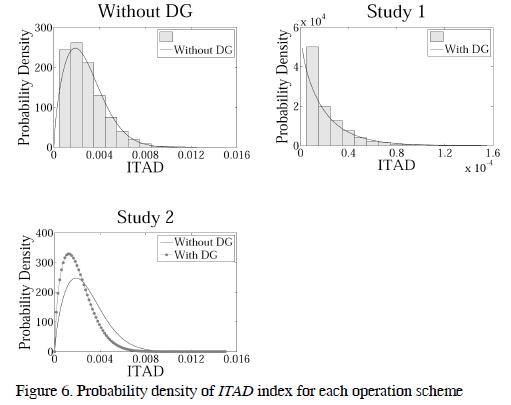
The information of the ITAD behavior for the operation scheme without DG and the second study was fitted to a weibull function of probability density. On the other hand, the ITAD behavior for the first study was fitted to a gamma function of probability density.
From Figure 6 it was observed that the oper ation scheme that does not consider the DG interconnection has a high ITAD dispersion around its mean value, however, implementing either of the two studies would reduce this dispersion in different proportions.
The ITAD dispersion around its mean value leads to great economic impacts for the electric utility that must be analyzed. These impacts result from implementing the compensations scheme to ''worst served'' customers and they are discussed in the next section (IV-C4).
4) Economic Impacts for Utility:
Based on the results of technical impacts for system that bring the application of each study, it was possible to analyze the estimated impacts on the incentives and compensations scheme. This analysis is presented in Table 4.
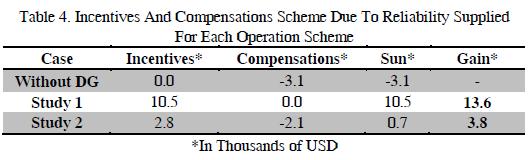
Based on the results of the incentives scheme shown in Table 4, it was possible to observe that without DG in the system, the electric utility neither receives financial benefits nor should pay financial penalties, because it is located in the dead zone of the incentives curve. However, if the DG units described in any of the two studies are connected, the utility would receive from its customers through the electricity bill, an annual bonus due to improvements in the reliability supplied.
Regarding the compensations scheme, it was possible to observe that without DG in the system, the electric utility should compensate its ''worst served'' customers through the electricity bill, with an expected annual compensation of 3.1 thousand dollars. However, if the DG units described in either of the two studies are connected, the utility should compensate to such customers with a lower annual amount over the case without DG, due to the dispersion of the reliability supplied around the mean reliability would fall.
As a conclusion of the incentives and compensations scheme due to the reliability supplied, it should be noted that without DG the electric utility is leaving to receive an expected annual value of 3.1 thousand dollars, because of its poor management in improving the reliability. On the other hand, if the DG units described in either of the two studies are connected to the system, the utility would receive a certain amount of money per year. It can thus be deduced that the utility would be perceiving an annual profit, exclusively from applying the incentives and compensations scheme.
It should also be stated that such profit or part of it, could be negotiated through a bilateral contract between the electric utility and the customers who would connect DG units. This negotiation represents a very adequate and fair option for such customers, because they are who would improve the reliability by using their DG units as backup plants.
5) Economic impacts for DG owner customers:
The economic impacts for DG owner customers were evaluated based on the time taken to recover the investment due to the installation of these plants. The calculation of this time is a function of two variables, which are described below:- The economic savings in the energy bill of each one of the customers who would install DG units.
- The economic investments by technology type, of the customers who would install DG units. The Table 5 shows the time taken to recover the investment according to the technology used.
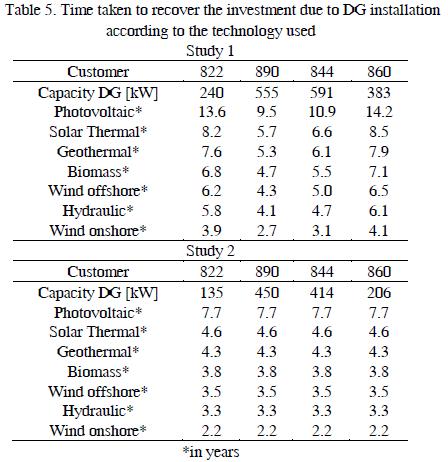
The results presented in Table 5 were evaluated with the following two assumptions:
- It was considered that the period of useful life of a DG plant corresponds to 20 years, regardless of the technology type used.
- It was assumed that the installation of a DG plant would be economically profitable, if the time to recover the investment of that installation is shorter or equal than half of the machine useful life (≤ 10 years).
Based on the results presented in Table 5 and according to the assumptions outlined above, it was observed as expected, that the photovoltaic system represents the least profitable technology from an economic point of view, due to such technology has the highest investment costs, and therefore it has the longest time to recover the initial investment.
It was also noted that the installation of the DG units described in the first study, corresponding to customers 822, 844 and 860 and whose technology is photovoltaic would not be profitable, because they exceed the defined maximum time to recover the initial investment. It was also possible to observe that the time to recover the initial investment in the second study is significantly reduced compared to the first study. This reduction in time to recover the initial investment, make economically profitable the installation of DG units in the customers 822, 890, 844 and 860, whose technology is any of the considered.
According to all the results presented above, it was thus concluded that it is more profitable for a customer to install DG whose capacity represents its actual peak demand or its projected demand. This is because the price that could be negotiated between the customer and the electric utility, to improve the reliability, does not cover the additional investment that the customer would do by the purchase of additional generation capacity used as backup for the system.
This situation will not change unless incentive mechanisms are implemented by the state, which promote the use of DG through renewable energies. These mechanisms should ensure to the customers that would install these generation sources, that the time to recover their initial investment is shorter or equal than the time calculated for that situation in which the DG capacity represents the peak demand of the respective plant owner. For example, these mechanisms must guarantee to customers 822, 890, 844 and 860 that the times taken to recover investment costs due to the DG installation, are shorter or equal than those shown in Table 5 for the second study.
6) Economic impacts for passive customers:
The economic impacts for customers who would not install DG units or passive customers were evaluated by a comparative method, that assesses the behavior of the estimated electricity bill of each one of those customers, for the two operation schemes (without and with DG).
In order to carry out the implementation of this study, it was necessary as a first step to bring up a simple key analysis for evaluating the results of the comparative method, which is shown in Figure 7.
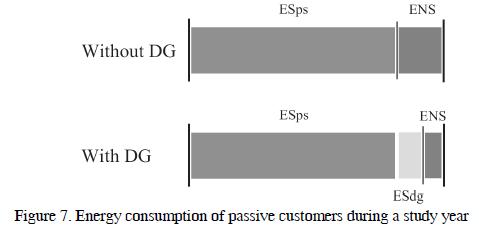
Where:
- ESps: Energy supplied by power system.
- ESdg: Energy supplied by DG sources.
- ENS: Energy not supplied.
The Figure 7 shows that when the system does not consider the DG interconnection, each customer has an Energy Not Supplied (ENS) estimated for a year, which is evaluated with the rationing cost (RC). However, when DG units are connected, a large part of the ENS will be supplied by the new generation sources interconnected to the system and it will be billed to customers through the unit cost of electricity service from DG units (CUdg). The remaining amount of such ENS is going to continue appearing and it will be evaluated with the same RC.
The purpose of this analysis is to explain that, the DG interconnection in distribution systems may cause that the energy bill of passive customers increases or decreases, with respect to the operation scheme without DG. This is mainly due to the CUdg is higher or lower than the RC respectively. However, it is important to note that the behavior of the incentives and compensations scheme due to the reliability supplied, also has a significant impact on the energy bill of passive customers.
In order to carry out the implementation of the comparative method, it was required the information of the values of CUdg according to the technology used, without considering the incentives and compensations scheme due to the reliability supplied. This information is presented in Table 6.
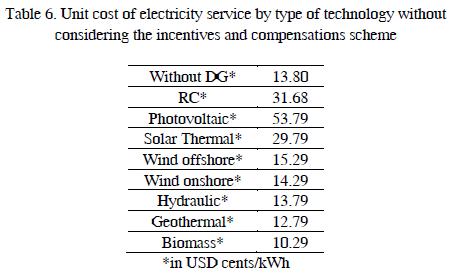
The estimated values of the unit cost of electricity service described in Table 6 were the same for all passive customers, because these customers were connected to the same voltage level.
Once the key analysis described above was understood, it was evaluated the results of the comparative study.
The results obtained from the comparative study led to deducing that the interconnection of the DG units described in the first study whose technology was any of the analyzed would imply increases in the estimated annual electricity bill of passive customers, regarding the operation scheme that does not consider the DG interconnection. This is because the application of the incentives and compensations scheme would cause some increases in the electricity bill of passive customers, which would be higher than the reductions in the bill due to the CUdg in most of the technologies is lower than the RC. It is important to indicate that the photovoltaic system is the only technology whose application not only increases the electricity bill of passive customers due to the implementation of the incentives and compensations scheme, but also because its CUdg is higher than the RC. Therefore, the increases in the electricity bill due to the use of this technology are really significant.
According to the analysis presented above, it was concluded that the interconnection of the DG sources described in the first study, would imply that the incentives and compensations model due to the reliability supplied has greater impacts on the electricity bill of passive customers than the unit cost when the electricity comes from DG units (CUdg). This is because, despite the CUdg allows a greater variation in the bill behavior of passive customers, the application period is very short, because the DG units operate as backup plants to fault conditions in the system. On the other hand, despite the incentives and compensations scheme allows smaller variations in the bill behavior of passive customers, its application is constant.
Although such increases in the electricity bill result from improvements in the reliability supplied by the electric utility, they would be preventing that any of the technologies is economically profitable for passive customers, because the bill price would be higher than the price these customers are able to pay to avoid a cut in the electricity supply.
On the other hand, the results obtained from the comparative study led to deducing that the interconnection of the DG units described in the second study whose technology was any of those analyzed, would imply decreases in the estimated annual electricity bill of most of passive customers, with respect to the operation scheme that does not consider the DG interconnection. This is because the operation scheme designed for this study does not provide great benefits to the system reliability, however, represents a more realistic situation.
According to the results presented of the comparative method, it was concluded that for passive customers it is more profitable to connect DG sources whose installed capacities do not produce very strong improvements in the reliability supplied by the electric utility. This is because if the reliability became greatly improved, then passive customers would prefer not to have the electricity, because the electricity unit cost would be higher than the cost they are able to pay, that is the rationing cost.
It is important to indicate that a suitable option for passive customers to perceive profitability with the DG connection in the distribution system would be the execution of a bilateral contract between the electric utility and passive customers harmed by such connection. This contract consists of giving such customers a portion of the profit received by the utility due to the implementation of the incentives and compensations scheme. For example, from the 3.8 thousand dollars that utility receives annually as profits with the implementation of the second study, according to Table 4, it should give to the customer 806 at least 55 dollars per year, in order to this customer perceive profitability with the connection of the DG units described in the mentioned study.
5. Conclusions
The main contribution of this paper is the development of a methodology orientated towards estimating and analyzing the technical impacts, on topics of reliability, and the economic impacts that imply the DG interconnection, with the possibility of islanding operation, by customers of the distribution system. This impacts assessment allows through a balance between performance and costs, contribute to feasibility studies to connect these sources.
To implement the proposed methodology, a computational tool was developed using MATLAB and the simulation technique of Monte Carlo sequential of mixed time. This tool consisted of two analysis schemes: a technical analysis, which evaluates the reliability conditions of the distribution system; on the other hand, an economic analysis that evaluates the financial impacts on the electric utility and its customers, according to the system reliability level.
The proposed methodology was applied to the IEEE 34 node test feeder, from which it was concluded that the technical benefits of DG interconnection in distribution systems are very significant for both the electric utility and its customers. This shows that the use of these generation sources allow to solve problems of deficiencies in the reliability supplied by utilities.
It was also concluded that the economic benefits of connect DG plants are directly for electric utility, because it is the one that perceives profits with the implementation of the incentives and compensations scheme due to the reliability supplied. On the other hand, the situation is not as beneficial for DG owner customers or for passive customers, due to the high investment and generation costs that still keep most of the DG technologies.
It is clear that the DG interconnection significantly changes the traditional concept of distribution systems operation, but it is a challenge for the near future that must be assumed and evaluated with attractive benefit-cost relationships for the different agents involved.
6. References
Billinton, R. ''A reliability test system for educational purposes - basic data''. IEEE Trans., PWRS-3, (4), 1989, pp. 1238 - 1244. [ Links ]
Billinton, R., Allan R. ''Reliability Evaluation of Power Systems'', Plenum Press, New York, U.S.A., 1984. [ Links ]
Billinton, R., Jonnavithula, A. ''Application of Sequencial Monte Carlo Simulation to Evaluation of Distributions of Composite System Indices'', United Kingdom, IEE Proc.-Gener. Transm. Distrib. Vol. 144, No. 2, March 1997. [ Links ]
Brown, R., Burke, J. ''Managing the Risk of Performance Based Rates'', IEEE Transactions on Power Systems, Vol. 15, No. 2, May 2000. [ Links ]
CREG097, Resolution CREG 097. ''By which the general principles and the methodology for establishing charges for use of the Regional Transmission and Local Distribution Systems are approved'', Ministry of Mines and Energy, Sep. 26, 2008. [ Links ]
CREG119, Resolution CREG 119. ''By which the general tariff formula which allows to the electricity dealers to establish the costs of providing service to regulated customers in the National Interconnected System is approved'', Ministry of Mines and Energy, Dec. 21, 2007. [ Links ]
Corredor, G. ''Energy Economics Course'', National University of Colombia, 2007. [ Links ]
ICONTEC, Standard NTC 1340. ''Nominal Voltage and Frequency in Electric Systems'', ICONTEC, Aug. 25, 2004. [ Links ]
IEEE, IEEE 34 nodes test feeder - Subcommittee on distribution system analysis of the IEEE. Available at:http://ewh.ieee.org/soc/pes/dsacom/testfeeders/index.html. 2001 [ Links ]
Luna, L., Parra, E. ''Feasibility Assessment of Distributed Generation Interconnection'', IEEE PES PowerTech, Trondheim - Norway, Jun. 2011. [ Links ]

