


Services on Demand
Journal
Article
 English (pdf)
 Article in xml format
 Article references
 Send this article by e-mail
Indicators
-
 Cited by SciELO
 -
 Access statistics
Related links
-
 Cited by Google
 -
 Similars in
SciELO
Similars in
SciELO -
 Similars in Google
Share

 Permalink
Ingeniería e Investigación
Print version ISSN 0120-5609
Ing. Investig. vol.31 suppl.2 Bogotá Oct. 2011
Entropy and coefficient of variation (CV) as tools for assessing power quality
Entropía y coeficiente de variación (CV) como herramientas para evaluar la calidad de la energía
J. H. Estrada1, E. A. Cano-Plata2, C. Younes-Velosa3, C. L. Cortés4
1 Electronic engineer and PhD candidate. Associate Professor Universidad Nacional de Colombia - Sede Manizales (e-mail: jhestradae@unal.edu.co).
2 Electrical engineer and PhD. Associate Professor Universidad Nacional de Colombia -Sede Manizales (e-mail: eacanopl@unal.edu.co).
3 Electrical engineer and PhD. Associate Professor Universidad Nacional de Colombia - Sede Manizales (e-mail: cyounesv@unal.edu.co).
4 Electronic engineer and master's student.Universidad Nacional de Colombia - Sede Manizales (e-mail: clcortesc@unal.edu.co).
ABSTRACT
This paper presents several concepts and techniques for quantifying electric signal entropy and variability for assessing power quality, showing their irregularities, such as the electrical sine wave which delivers power to industry and homes. The paper will review these concepts and show some magnetic radiated waves measurements taken below 115 KV electricity line circuits in the city of Manizales (Colombia) through non-invasive and indirect measurement of the complexity of the current transported by the supply.Entropy, as an accepted indicator of physical complexity, is proportional to the logarithm of the number of states in a thermodynamic system. Some writers have identified entropy as being system disorder, but this is not completely true. Entropy of information was first defined by Shannon in 1949 and it is applied to many physical events. Entropy has been used for describing the complexity of the magnetic wave radiated by the line in this paper.
Furthermore, the magnetic waves' spectral and amplitude coefficient of variation (CV) were obtained using a multi-resolution wavelet algorithm which measures data distribution dispersion. It is a dimensionless number allowing the variation of magnetic radiated data having significantly different mean values to be compared to a 60 Hz pure magnetic wave as reference.
Keywords: Power Quality, Harmonics, Entropy, Wavelets, nonlinear loads, Magnetic wave, Coefficient of variation.
RESUMEN
Este artículo presenta varios conceptos técnicos para cuantificar la entropía de la señal eléctrica y la variabilidad con el fin de evaluar la calidad de la energía, mostrando sus irregularidades, como la onda sinusoidal eléctrica, que suministra energía a la industria y a los hogares. El documento examinará estos conceptos y mostrará algunas medidas de ondas magnéticas radiadas por los circuitos de las líneas eléctricas de la ciudad de Manizales (Colombia) tomadas por debajo de 115 KV, por medio de una medición no invasiva e indirecta de la complejidad de la corriente transportada por el suministro. La entropía, como un indicador aceptado de la complejidad de la realidad física, es proporcional al logaritmo del número de estados en un sistema termodinámico. Algunos autores identifican la entropía como un desorden de un sistema, pero esto no es del todo cierto. La entropía de la información se definió por primera vez por Shannon en 1949, y se aplica a múltiples eventos físicos. En este contexto, la entropía describe la complejidad de la onda magnética radiada por la línea.Además, se obtuvo el coeficiente de variación (CV) espectral y de amplitud de las ondas magnéticas con un algoritmo Wavelet de multirresolución, que permite la medición de la dispersión en la distribución de datos. Es un número adimensional que facilita la comparación de la variación de los datos magnéticos radiados, con valores medios muy diferentes, frente a una onda magnética pura de 60 Hz como referencia.
Palabras claves: Calidad de la energía, armónicos, entropía, Wavelets, cargas no-lineales, onda magnética, coeficiente de variación
I. Introduction
The users of electricity (industrial and domestic) are concerned about electric power quality, since poor quality causes damage and malfunctions for different kinds of load (Santoso et al., 1996). Some industries are very sensitive and many losses occur from instabilities, harmonic distortion, shorts, line disturbances, impulses, notches, glitches, interruptions, over voltages, under voltages, wave faults. computer lockups, flicker, equipment damage (at partial load),data processing equipment PFC instability, overloading problems when switching heavy loads, overheated neutral wiring, problems with long lines, nuisance tripping, utility metering claims, etc. There is thus great interest in improving electric power quality to lower the cost of protection equipment (Santoso et al., 1996). Many sources of such disturbances must be identified to take appropriate action to mitigate such effects.
There are several commercialtools for protection, such as surge protection, UPS, true RMS metering equipment, dedicated circuits, total rewiring, meshed earth passive filters, active conditioner, TN-S rewiring, etc.
Upsized neutral comparison of adjacent cycles, neural networks, wavelet transforms for analysing harmonic distortion are methods for evaluating power quality (Santoso et al., 1996); they all have advantages and drawbacks. This paper proposes using an entropy and coefficient of variation (CV)for multi-resolution wavelet transform analysis to create indicators by comparing magnetic radiated waves from HV lines to clean 60 Hz magnetic radiated waves as reference.
Entropy is an intuitive procedure because it can visually distinguish between a clean and distorted signal. Furthermore, entropy is independent of absolute scales such as signalamplitude or frequency. Signalentropy can be computed in two ways: Shannon entropy is considered in the time domain and spectral entropy in the frequency domain. A combination of time and frequency domains is desirable to optimise this.
The CV is obtained via multi-resolution wavelet transform;this is a mathematical tool, similar to Fourier transform,for analysing stationary and non-stationary signals by their decomposition into different scales having different levels ofresolution. Such decomposition is possible because wavelet transform is supported by a predictable signal.
A. Multi-scale entropy, coefficient of variation and wavelet multi resolutionfor processing data
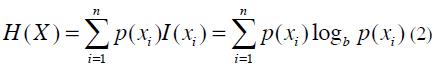
Shannon (Shannon, 1948) proposed entropy H of arandom variable X, having multiple values {x1, ...,xn} as,

Child wavelets are defined as: Ewas the expected value one expects, and I is the amount of information of X.
I(X) is defined as a random variable.p indicatesthe probability function of X, then, the entropy canbe written as(Shannon, 1948):
The entropy (ApEn) derived from the above equation is a statistical expression quantifying regularity and complexity, having many potential applications to a wide variety of areas with relatively short (greater than 100 points) and noisy time‐series data, and is applied in this paper to magnetic waves radiated by HV lines, thereby permitting a great amount of powerto be analysed. The theory of complex systems has not yetbeen completely delineated. As electric engineers begin to work on complex systems, they will obtain better understanding of their properties and how to use them to analyse power; however, the idea differs from engineer to engineer. The complex systems studied to date have been biological ones, i.e. systems related to people: individuals, groups, culture, internet, electric power networks, etc.
The CV is denoted as the ratio of standard deviation σ to mean µ (Shannon, 1948):
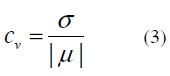
This is the inverse of the signal to noise ratio. The CV is defined for non-zero mean and the absolute value is taken for the mean to be sure it is positive; it can also be expressed as a percentage (CV multiplied by 100%).
Wavelet theory has many applications. Wavelet transforms may be understood as time-frequency representation for analogue signals, so they can be related to harmonic analysis. Wavelet transforms use discrete-time filter banks. They are called the wavelet and scaling coefficients in wavelet theory. These filter banks may include finite-impulse response (FIR) or infinite impulse response (IIR) filters. Wavelet transformsare divided into continuous, discrete and multi resolution-based.
The signal of interest may be represented on every frequency band between f and 2f for f>0. The signal can thus be rebuilt by integration on all bands.
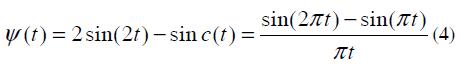
The mother wavelet may be written as (Burrus, 1998):
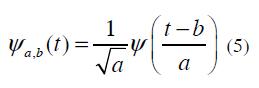
Child wavelets are defined as:
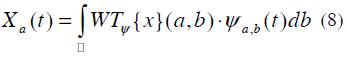
X takes the following form:
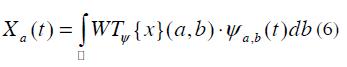
whose wavelet coefficients are:
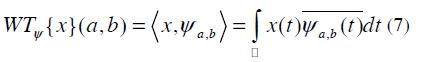
A computer program based on multi-resolution wavelet was used to compute the CV in multiple scales by:
In any wavelet transform there are a finite number of wavelet coefficients on the upper half plane. Each coefficient needs the application of an integral. To make it easy, one can use an auxiliary function: the father wavelet Ø∈L2( ) . Subspaces can thus be constructed from the father wavelet:
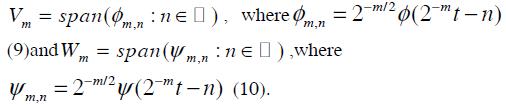
Such sub spaces are the basis for creating the multiple resolution scales.
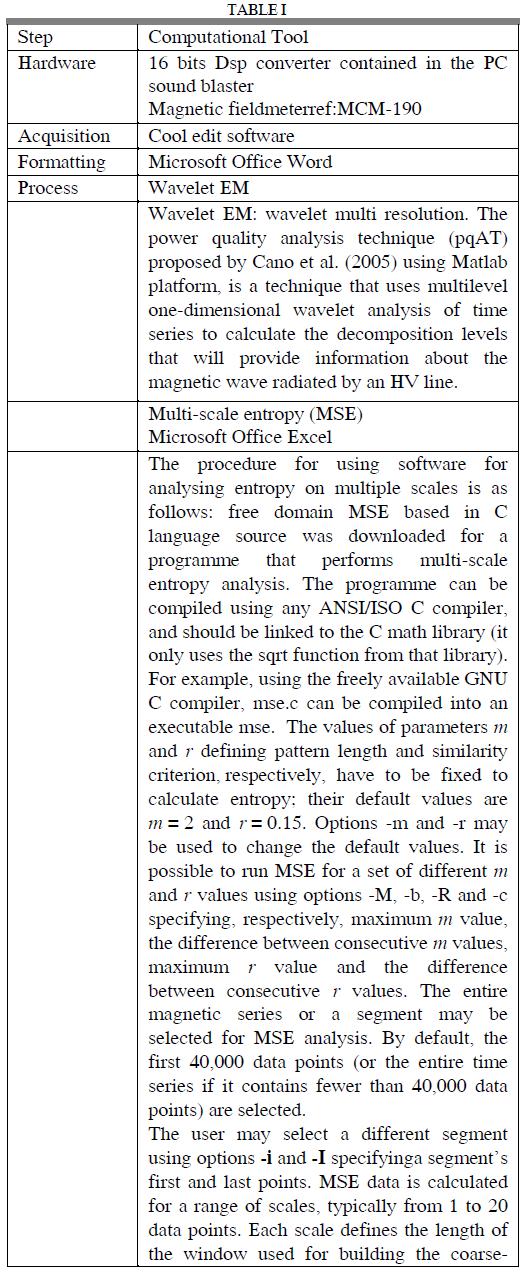
B. Tools and methods
II. Data and conclusions
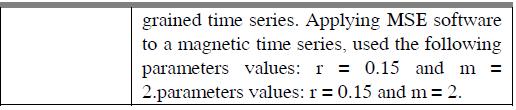
Figures 1 and 3 suggest an industrial network having high harmonic generation. To understand this in such power system, a harmonic can be defined as a sinusoidal component of a periodic wave having a frequency that is an integral multiple of fundamental frequency. Thus, for a power system having ƒ0 fundamental frequency, the frequency of the h-th order of the harmonic would be hƒ0. Harmonics are often used to define distorted sine waves associated with currents and voltages having different amplitudes and frequencies; entropy evaluationis used for this (Figure 1).
A distorted periodic wave shape of any conceivable shape can be composedby using different harmonic frequencies at different amplitudes. Conversely, any distorted periodic wave shape can be decomposed into a fundamental wave and a set of high harmonic entropy. This technique can be used for systematically analysing the effects of nonlinear elements in power systems via non-intrusive measurement techniques.
Most elements and loads in a power system respond the same in positive and negative half-cycles. The produced voltages and currents have half-wave symmetry. Therefore, harmonics of even orders are not characteristic. Also, triples (multiples of third harmonic) can always be blocked by using three-phase ungrounded-wye or delta transformer connections in a balanced system, because triples are entirely zero sequence. Even-ordered and triples are thus often ignored in harmonic analysis. Generally, the frequencies of interests for harmonic analysis are limited to the 50th multiple; the rate between the noise and signal is thus used. Figure 2
Figures 1 and 5 show a lot of harmonic sources. The static power converter is the main source of harmonics in the power system.
The current harmonics generated by a p-pulse line commutated converter can be characterised by Ih = I1 / h and h = pn±1 (characteristic harmonics), in ideal operating conditions, where n = 1, 2, ... and p is an integral multiples of six. If the converter input voltages are unbalanced or unequal commutating reactance exists between phases or unequally spaced firing pulses are present in the converter bridge, then the converter will produce non-characteristic harmonics in addition to the characteristic ones. Non-characteristic harmonics are those that are not integer multiples of the fundamental power frequency; this is traditional in industrial feeders, as can be seen in Figure 2.
Figures 2 and 4 also show great harmonicactivity, especially in the industrial network. Harmonic frequencies which are not integral multiples of the fundamental power frequency are usually called inter harmonics. This phenomenon can be evaluated more exactly using the entropy method. A major source of inter harmonics is the cycle converter (Figure 2). One special subset of inter harmonics is called sub-harmonics; they have frequency values that are less than that of that of fundamental frequency. Lighting flicker is one indication of the presence of sub-harmonics. A well-known source of flicker is the arc furnace.
Figure 1 shows higher entropy values for the industrial power radiated magnetic waves network caused by rectifiers, AC and DC motor controllers, adjustable frequency AC motor circuits, uninterruptable power supplies (UPS), arc furnace, static and dynamic motors and generators, cycle converters, motor starters, electronic lighting, switch mode power supplies etc. These loads are sensed as nonlinear loads and are magnetically coupled to the HV lines,thereby increasing the complexity of the industrial magnetic wave by introducing additional waves as harmonics.
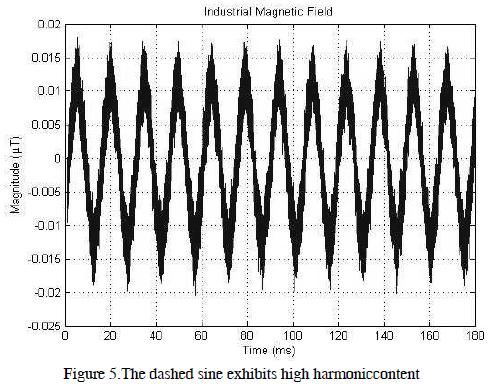
Entropy means higher complexity, understood as higher harmonics content; this affects and distorts the waveform (Figure 5). Industrial higher entropy is caused by nonlinear loads which may be considered as additional electrical generators in parallel to the main generator. The generator is built to produce sinusoidal voltage but, when nonlinear current is taken, the harmonic currents interact with system impedance causing voltage distortion. This also means higher entropy.
An industrial network (Figure 5) contains complex magnetic waves that repeat in a given pattern; however,such pattern is far from a sine wave. The complex wave thus consists not only of one frequency sine wave but also a number of different frequency superimposedsine waves. In the time domain, the repeated time of the wave's pattern gives the period of lowest frequency contained within the complex magnetic wave. All other frequencies are integer multiples of this lowest frequency. The complex radiated magnetic wave is created by resonances whose frequencies are harmonically related, emitting other complex tones. Higher entropy (for an industrial network) suggests an irregular shaped envelope for the wave in the time domain.
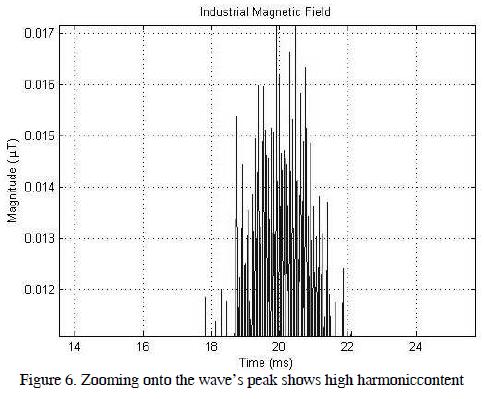
It should be emphasised that the percentage of total harmonic current distortion is not the main concern here; the magnitude of the harmonic currents is more important. The magnitudes of these harmonic currents interacting with impedances produces total harmonic voltage distortion (see Figure 6). Total harmonic voltage distortion is thus the main preoccupation for decreasing adverse effects in an installed system;the intention of harmonic mitigation must thus be to reduce total harmonic voltage distortion.
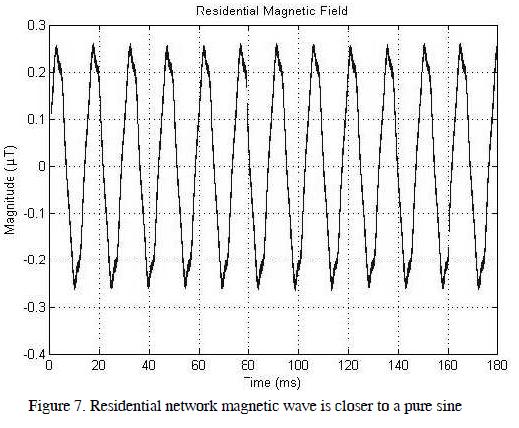
Figure 1, indicates lower entropy for a residential network (see Figure 7) because the magnetic wave is simpler,having less harmoniccontent. The magnetic residence wave measured below the HV line is a pure one, consisting of a single frequency. The magnetic wave being recorded is an almost perfect sine pattern, repeated over and over aging at a given repetition rate.
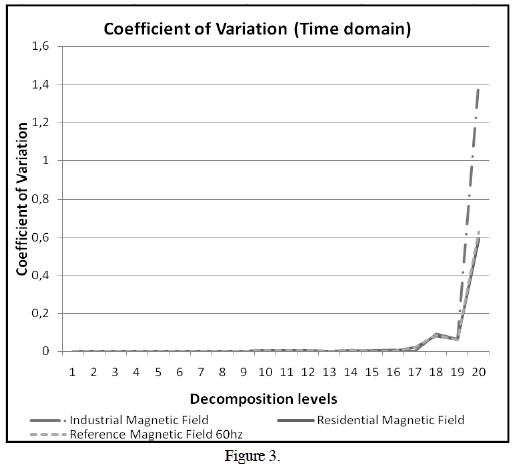
Figure 3 shows the coefficient of variation for multiple scale decomposition. As expected by theory, its value was zero. However, the coefficient of variation for industrial network increased suddenly for scales 18 and 19, indicating high noisecontent.
It should be remembered that CV is defined as the ratio of noise to signal. This means that the magnetic wave begins to be similar to noisefor such scales; such conclusion agrees with higher entropy for an industrial network. It must thus beacceptedthat noise generation from high-voltage lines is caused by the discharge of energy when electrical field strength is greater than 'breakdown strength' (the field intensity needed to initiate a flow of electric current) of the air around the conductor. This discharge also causes radio noise, a visible light close to the conductor (energy loss known as corona loss). Corona discharge intensity and the resulting noise are affected by weather (humidity, air density, wind and water). Water, in the form of rain or fog, increases the conductivity of the air thereby increasing dischargeintensity. Also, defects in the conductor, like sharp points and air contaminants, may increase corona activity.
Higher industrial network entropy mayalsobe explained by inter harmonics (Figure 6). As well as harmonics, other frequencies can be measured,though not being an integer of the fundamental. They surge as discrete frequencies increasing the spectrum. Inter harmonics can be considered as a system's harmonic components inter-modulating with other frequency elements. These can be observed with nonlinear loads: huge AC frequency converter drives, as cycle converters. Thepeak voltage deviations caused by inter harmonic voltage thus also increase the CV(Figure 6).
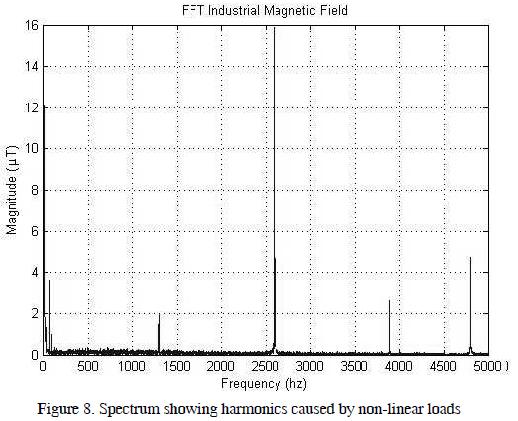
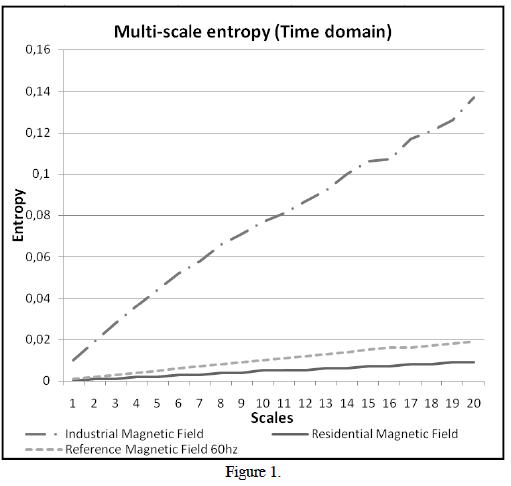
Figure 2 showed entropy in the frequency domain.Here, higher entropy means a wider spectrum: power linecables supplying harmonic loads, introducingelectromagnetic interference(EMI). High entropy values may be observed for the industrial network on scales 1, 2 and 3. High-voltage transmission line EMI field is caused by corona, as explained before. The corona effect adds more frequenciesin the frequency domain, thereby increasing entropy and the spectrum. Such ''EMI noise'' interferes with telephones, televisions, radios, computers, control systems and other types of electronic equipment.
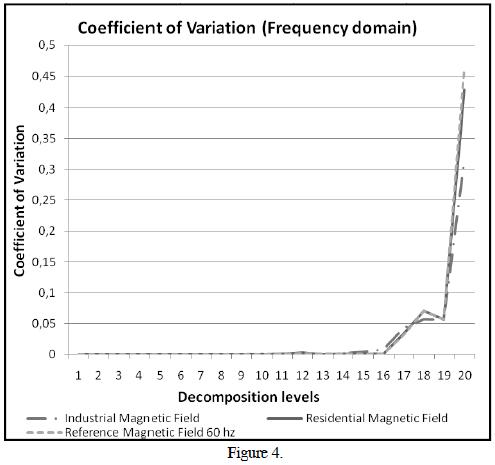
Figure 4 indicates zero CV for the first 16 scales. For further scales, the fundamental frequency suffers some deviation and the presence of harmonics (Figure 8), caused especially by non-lineal load which reflects on the main generator. Power systems designed to work at 60 Hz fundamental frequency are prone to erroneous behaviour. The Figure thus shows fundamental frequency drift as more nonlinear loads are connected to a network.
A. Benefits of a macro network power quality monitoring for quality assessment
- Carrying out preventative and predictive maintenance, identifying the source and timing of events causing damages or mal-functioning;
- Developing new schedules assisted by new quality trends;
- Creating plans and strategies to mitigate harmonics to reduce damage caused to equipment;
- Analysing harmonics and improving factor correction, by adjusting active and passive filters;
- Improving equipment operation and performance;
- Evaluating electric and electronic networksensitivity to disturbance;
- Servicing many utilities to perform for their industrial and key customers;
- Detecting, solving and preventing problems regarding customer power systems;
- Monitoring for information about disturbances,
- preventing user complaints; and
- Protecting (enhancing) power quality reputation.
III. Acknowledgment
The authors gratefully acknowledge the financial support provided by COLCIENCIAS and would also like to thank the Universidad Nacional de Colombia for financing and providing the tools for conducting this research.
IV. References
Artioli, M., Pasini, G., Peretto, L., Sasdelli, R., Filippetti, F., "Low-cost DSP-based equipment for the real-time detection of transients in power systems", Instrumentation and Measurement, IEEE Transactions on, On page(s): 933 - 939, Volume: 53 Issue: 4, Aug. 2004. [ Links ]
Barros, J., Perez, E., "Automatic Detection and Analysis of Voltage Events in Power Systems", Instrumentation and Measurement, IEEE Transactions on, On page(s): 1487 - 1493, Volume: 55 Issue: 5, Oct. 2006. [ Links ]
Burrus, C.S., Gopinath, R.A., Guo, H. Introduction to Wavelets and Wavelet Transforms. Prentice Hall, New Jersey, 1998. [ Links ]
Katsaprakakis, D.A., Christakis, D.G., Zervos, A., Voutsinas, S., "A Power-Quality Measure", Power Delivery, IEEE Transactions on,On page(s): 553 - 561, Volume: 23 Issue: 2, Apr. 2008. [ Links ]
Ming Zhang, Kaicheng Li, Yisheng Hu, "A High Efficient Compression Method for Power Quality Applications", Instrumentation and Measurement, IEEE Transactions on,On page(s): 1976 - 1985, Volume: 60 Issue: 6, Jun. 2011. [ Links ]
Santoso, S., Powers, E.J., Grady, W.M., Hofmann, P., "Power quality assessment via wavelet transform analysis", Power Delivery, IEEEtransactions on,On page(s) 924 - 930, Volume: 11 Issue: 2, Apr. 1996. [ Links ]
Sedighi, A.R., Haghifam, M.R., Malik, O.P., Ghassemian, M.H., "High impedance fault detection based on wavelet transform and statistical pattern recognition", Power Delivery, IEEE Transactions on, On page(s): 2414 - 2421, Volume: 20 Issue: 4, Oct. 2005. [ Links ]
Shannon, C.E., "A mathematical Theory of Communication", Bell Syst. Tech. J., 27, 379-423, 623- 656. 1948. [ Links ]
Youssef, O.A.S., "Online Applications of Wavelet Transforms to Power System Relaying - Part II", Power Engineering Society General Meeting, 2007 IEEE, On page(s): 1 - 7, Volume: Issue:, 24-28 Jun. 2007. [ Links ]
Zwe-Lee Gaing, "Wavelet-based neural network for power disturbance recognition and classification", Power Delivery, IEEE Transactions on, On page(s): 1560 - 1568, Volume: 19 Issue: 4, Oct. 2004. [ Links ]

