


Serviços Personalizados
Journal
Artigo
 Inglês (pdf)
 Artigo em XML
 Referências do artigo
 Enviar este artigo por email
Indicadores
-
 Citado por SciELO
 -
 Acessos
Links relacionados
-
 Citado por Google
 -
 Similares em
SciELO
Similares em
SciELO -
 Similares em Google
Compartilhar

 Permalink
Ingeniería e Investigación
versão impressa ISSN 0120-5609
Ing. Investig. v.31 supl.2 Bogotá out. 2011
Generalised strategy for implementing the minimum fault reactance based fault location algorithm in real power distribution systems
Estrategia generalizada para la implementación del método de localización de fallas basado en la reactancia mínima de falla en sistemas de distribución reales
E. Correa-Tapasco1, J. Mora-Flórez2, S. Pérez-Londoño3
1 E. Correa-Tapasco: Ingeniero Electricista y Magister, Universidad Tecnológica de Pereira. Profesor catedrático, Universidad Tecnológica de Pereira, Colombia. ever@utp.edu.co
2 J. Mora-Flórez: Ingeniero Electricista y Magister, Universidad Industrial de Santander. Doctor en Ingeniería eléctrica, Universidad de Girona. Profesor asociado, Universidad Tecnológica de Pereira, Colombia. jjmora@utp.edu.co
3 S. Pérez-Londoño: Ingeniero Electricista y Magister, Universidad Tecnológica de Pereira. Estudiante de doctorado dela Universidad Nacional, Colombia. Profesora asociada, Universidad Tecnológica de Pereira, Colombia. saperez@utp.edu.co
ABSTRACT
The paper presented here is aimed at proposing a generalised strategyfor easily implementing a fault locator in real power distribution systems. The strategy is based on the definition of a fault location method and its successive application along section lines from a power substation to the section where the fault has been determined. According to the results, the proposed strategy seems to be applicable to real power systems as an alternative for reducing fault location time and thuskeeping good continuity indexes.Keywords: fault location, implementation strategy, power distribution systems.
RESUMEN
En este artículo se propone una estrategia generalizada para fácilmente implementar un localizador de fallas en sistemas reales de distribución de energía eléctrica. La estrategia se fundamenta en la definición de un método de localización de fallas y su sucesiva aplicación a lo largo de las secciones de línea desde la subestación hasta donde se determine la localización de la falla. De acuerdo con los resultados, la estrategia propuesta es aplicable en sistemas de potencia reales como una alternativa para reducir el tiempo de localización de fallas y en consecuencia para mantener buenos índices de continuidad.Palabras claves: Localización de fallas, estrategia de implementación, sistemas de distribución de energía eléctrica.
1. Introduction
Power systems are usually exposed to faults caused by a variety of circumstances such as lightning, accidental contact with trees or conductive materials, storms and hurricanes. These faults affect power quality, reducing the two well-known continuity indexes, the system availability interruption frequency index (SAIFI) and the system availability interruption duration index (SAIDI) (Bollen,2000; Dugan et al.,1999, pp. 1164-1169). These indexes are an indirect measurement of maintenance staff response in the case of unpredictable power outages.
Fault location is considered the first step ina expeditious recovery strategy which is necessary for maintaining good power service continuity indexes. The fault location task is complex in the case of power distribution systems, mainly due to such systems' characteristics like the presence of laterals, tapped loads, multiple conductor gauge, un-transposed lines, single and three phase loads and measurements available only at the power substation (Mora-Florezet al., 2007).
The methods usually used for determining fault location are those that use voltage and current measurements at a power substation to estimate the reactance from the measurement point to the faulted node (Das,1998; Novoselet al.,1998;Aggarwalet al., 1997, pp. 184-187; Morales and Mora-Florez, 2009). However, most methods work in terms of fault location in a simplified line section.
Considering the differences in line sections presented in power distribution systems, this paper was aimed at presenting a complete methodological approach to applying a fault location method in real environments, considering such power systems' main characteristics described above.
2. Generalised strategy for implementing the proposed fault location method
A. Basic fault locator aspects
The model used to represent a power distribution system could be based on the simplified circuit presented in Figure 1;Figure 2 presents another model which considers laterals. Such definition has been considered due to the proposed fault location technique's low complexity and also the locator'sdesired precision. The more complex the modelused then the better the results obtained in fault location. However, to determine all adequate parameter values is not always an easy task, due to power distribution system complexity and the lack of information, which unfortunately is relatively common in power utilities. Considering the above, several methods use simplified models which give useful results for solving the proposed fault location problem.


As previously explained, the proposed technique is an improvement of that initially presented in (Morales, et al, 2007, pp. 49-54) and is implemented using the concept of minimum fault reactance because this method is very suitable due to low requirements. This method only requires the pre-fault and fault measurements of voltage and current at a power substation and serial line impedances.
Using the simplified circuit and the measurements at a power substation, two complex equations were obtained to relate voltage and current and the distance to the faulty node. Considering fault impedance as purely resistive, the proposed method was aimed at determining the feeder node where the absolute value of fault reactance had its minimum value. This node was obtained by systematic variation of the assumed fault distance along the analysed feeder. The feeder load was lumped at the farthest node to reduce uncertainty associated with this dynamic pattern. The methodology proposed here makes this method easily applied to any power distribution feeder, considering variation of the overhead structure configuration, conductor gauge, number of phases, tapped loads, amongst such systems' other characteristics.
B. Generalised methodology followed for implementing the fault locator in real power distribution systems
Considering the simplified power system presented in Figure 1, VpsandIps represented voltage and current in a pre-fault situation, ZL represented line section impedance between nodes X and X+1, and ZC represented the lumped node at final section node X+1. In real power distribution systems, ZL varies as a consequence of section length, thus other aspects such as line configuration and conductor gaugecould also differ in each line section.
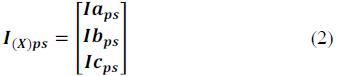
The voltages, currents and impedances in pre-fault conditions were represented as presented in equations (1), (2) and (3). Subindex X represented the reference node.


1) Equivalent circuit considering fault conditions
The equivalent circuit considering a fault is presented in Figure 3.

From Figure 3 shows how fault distance m from node X to the faulted pointwasdetermined. Assuming that the line section is known, and line impedance ZL is given in ohms, then m was obtained as a per unit value. The value obtained formwas then multiplied by total line section lengthto obtain the distance from node X to the fault.
Methodologically, the initial assumption was to consider the first line section as the faulted section. In the case of determining a value of m higher than 1, it would show that the faulted section was beyond the analysed section. The fault location method would then be applied again in the next downstream section, considering the voltages and currents at this new section's initial node. This procedure was repeated until the value of mwas obtained in the interval [0, 1], meaning that it would be in the faulted section.
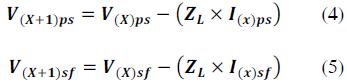
To determine the values of voltages at the initial node of the new analysed line section, the voltage at the endnode of the actual section would only need to be estimated, as presented in equations (4) and (5), considering pre-fault (ps) and fault (sf) situations, respectively.
2) Lumped load
Considering the power system represented in Figure 1, line impedance is a well-known parameter. However the lumped load would vary in each time instant, so the value of ZC presented in equation (6) would have to be determined.

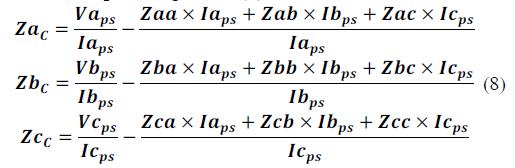
From figure 1, the pre-fault voltage at the initial node of the analysed section (X) would be given by equation (7).

From (7), ZC could be obtained as a function of section line impedance and pre-fault voltages and currents, as presented in the set of equations given in (8).
Only the voltage was updated in each linesection, while the current remained constant due the proposed lumped load located at the end of all of the analysed line sections.
3) Analysis in pre-fault and fault conditions
Considering the faulted circuit presented in Figure 2, the voltage at faulted node F and the fault current were obtained as given in (9) and (10), respectively. The fault reactance was then estimated as presented in (11).
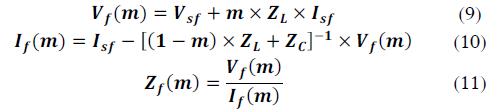
Equations (9) and (10) are functions of the previously defined impedances, the value of m and also of voltages and currents estimated at the initial node of the line sectionbeing analysed.
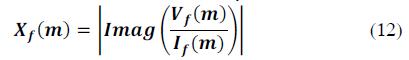
4) Estimation of the fault distance
Considering completely resistive fault reactance, the fault distance was then defined as being the value of m where the absolute value of fault reactance reached its minimum value, as presented in equation (12). An extensive simulation was performed considering variation in the value of in from 0 to 1 in 0.01steps but a simple algorithm for obtaining the minimum value could be used to avoid unnecessary calculations.
If the minimum value obtained along the line section corresponded to node X+l, then the next line section would have to be analysed. The absolute fault reactance value decreased from the substation node to the faulted node and then increased from the faulted node to the last feeder node.
C. Analysis considering different fault types
The strategy presented in Figure 4 was proposed to determine the fault type. It required measuring voltage and current at the power substation and also defining a phase pickup current (It) to determine whether the system was faulty.
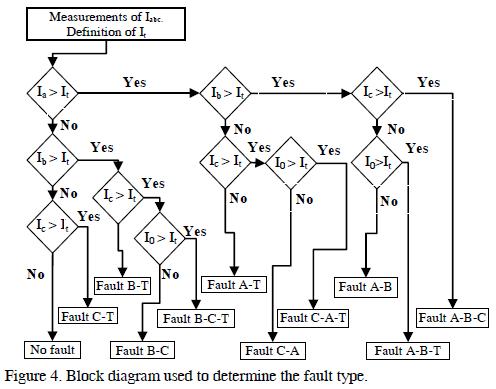
Having determined the fault type, Table I presents the different voltages and currents used in equation (11); voltages and currents at the faulted node were then obtained by using equations (9) and (10).
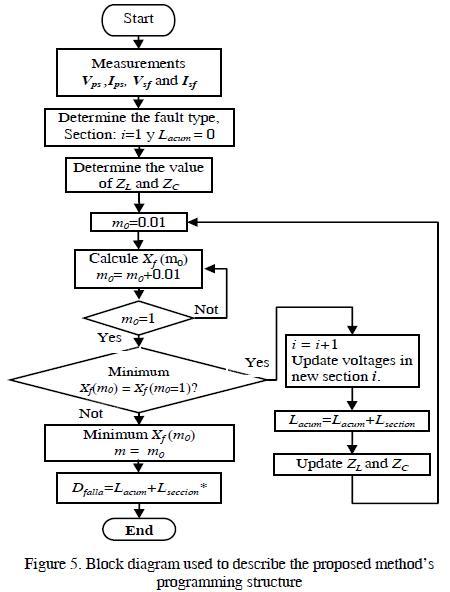
A. Programming structure
The generalised fault location algorithm proposed in this paper was coded in Matlab programming language, usin the structure presented in Figure 5.
3. Tests and results
A. Analysed power system
The system analysed here is a 34.5 kV power distribution system located in Colombia and operated by Codensa-Endesa E.S.P. The feeder analysed is 29 km long and its nominal load is 95 A. Figure 6 presents a geographical referenced diagram of the power systemso analysed.
A. Defining the tests
The tests involved analysing single phase, phase to phase, double phase to ground and three phase faults along the main feeder (29 km length). Variations in fault resistance from 0 to 40 Q were also tested to determine the proposed fault locator's performance (Dagenhart, 2000, pp. 30-32.).

B. Obtained results
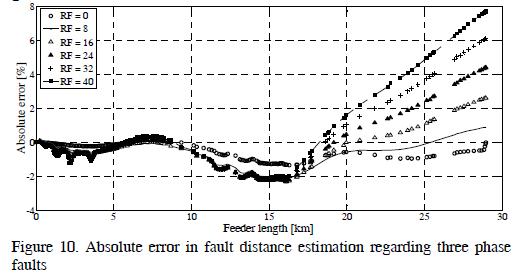
Figures 7 to 10 present the results of absolute error estimation for all analysed fault type,s considering several fault resistance values. The absolute error (Ae) was estimated as presented in (13) (Mora, Carrillo and Barrera, 2007).

C. Result analysis
According to the results, considering faults from 0 to 40 Ω, maximum estimated error was around 20%. However, considering the fault resistances given in (Dagenhart, 2000, pp. 30-32.), the average reported fault resistance in the case of single phase faults gave values from 8 to 16 Ω. Considering the latter, the errors were below 10%. In the case of phase faults, where reported average values for the fault resistances ranged from 0.5 to 5 Ω, absolute estimated error was lower than 4%.
As clearly shown in the Figures, the error in fault distance estimation was proportional to the fault resistance value. According to the results, the proposed method would then be constrained to low impedance faults applications.
Considering the evaluated power distribution feederlength it was noticed how estimated error increasedthe farther away the fault was.


4. Conclusions
A generalised methodology has been proposed in this paper to implement fault location methods in real power distribution systems, such as that based on minimising fault reactance. The results showed that this methodology was suitable for power distribution systems, givingsatisfactory results in fault location where location errors were below 10%, considering the maximum for the most probable fault resistance values. It has also been demonstrated that proposed approach contributes towards improving power continuity indexes in distribution systems by opportune zone fault location.
5. Acknowledgments
This work was partly financed by Codensa, COLCIENCIAS and Sena in Colombia through research contract 537-2008. The authors would like to thank M. Suárez-Sánchez from Codensa and G. Morales-España from UIS for their contributions which helpedto improve the paper.
6. References
Aggarwal, R. K., Aslan, Y., and Johns, A. T., An interactive approach to fault location on overhead distribution lines with load taps.,In Proc.Inst. Elect. Eng., Develop. Power Syst. Protection, Conf. Publ. 434, 1997, pp. 184- 187. [ Links ]
Bollen, M. H. J., Understanding Power Quality Problems: Voltages Sags and Interruptions.IEEE Press series on power engineering, New York,2000. [ Links ]
Dagenhart, J. B., The 40- ground-fault phenomenon.,IEEE Trans. Ind. Applications., Vol. 36, No. 1, Jan./Feb., 2000, pp. 30-32. [ Links ]
Das, R., Determining the locations of faults in distribution systems, Univ. Saskatchewan, Saskatoon, SK, Canada, Ph.D. dissertation, 1998. [ Links ]
Dugan, R., Brooks, D., McDermott, T., and Sundaram, A., Using voltage sag and interruption indices in distribution planning.,InProc. IEEE Power Eng. Soc. Winter Meeting, Vol. 2, 1999, pp. 1164-1169. [ Links ]
Mora-Florez, J., Carrillo, G., Barrera, B.,Fault Location in Power Distribution Systems Using a Learning Algorithm for Multivariable Data Analysis.,IEEE Transaction on Power Delivery, Vol. 22, 2007, pp. 1715-1721. [ Links ]
Morales, G., Mora-Florez, J., Elimination of Multiple Estimation for Fault Location in Radial Power Systems by Using Fundamental Single-End Measurements.,IEEE Transactions on power delivery, Vol. 24, No. 3, ISBN 0885-8977, July 2009. [ Links ]
Morales, G., Mora-Florez, J., and Pérez, S., Método de localización de fallas en sistemas de distribución basado en gráficas de reactancia., JournalScientia et Technica., Universidad Tecnológica de Pereira, Vol. 34, 2007, pp. 49-54. [ Links ]
Novosel, D., Hart, D., and Myllymaki, J., System for locating faults and estimating fault resistance in distribution networks with tapped loads., U.S. Patent 5 839 093, 1998. [ Links ]

