


Serviços Personalizados
Journal
Artigo
 Inglês (pdf)
 Artigo em XML
 Referências do artigo
 Enviar este artigo por email
Indicadores
-
 Citado por SciELO
 -
 Acessos
Links relacionados
-
 Citado por Google
 -
 Similares em
SciELO
Similares em
SciELO -
 Similares em Google
Compartilhar

 Permalink
Ingeniería e Investigación
versão impressa ISSN 0120-5609
Ing. Investig. v.31 supl.2 Bogotá out. 2011
Developing a PQ monitoring system for assessing power quality and critical areas detection
Desarrollo de un sistema de monitoreo de calidad de potencia para la evaluación de calidad de potencia y la detección de zonas críticas
Miguel Romero1, Ricardo Pardo2, Luis Gallego3
1 Electrical Engineer, Universidad Nacional de Colombia. M.Sc. Universidad Nacional de Colombia. Ph.D (candidate), Universidad Nacional de Colombia. Work in Research Program of Acquisition and Analysis of Electromagnetic Signals of the Universidad Nacional de Colombia - PAAS-UN. mfro-merol@unal.edu.co
2 Electrical Engineer, Universidad Nacional de Colombia. M.Sc. (Candidate), Universidad Nacional de Colombia. Work in Research Program of Acquisition and Analysis of Electromagnetic Signals of the Universidad Nacional de Colombia - PAAS-UN. rapardom@unal.edu.co
3 Electrical Engineer, Universidad Nacional de Colombia. Ph.D in Electrical Engineer, Universidad Nacional de Colombia. Teacher, Universidad Nacional de Colombia. lgallegov@unal.edu.co
ABSTRACT
This paper outlines the development of a power quality monitoring system. The system is aimed at assessing power quality and detecting critical areas throughout at distribution system. Such system integrates a hardware system and a software processing tool developed in four main stages. Power quality disturbances are registered by PQ meters and the data is transmitted through a 3G wireless network. This data is processed and filtered in an open source database. Some interesting statistical indices related to voltage sags, swells, flicker and voltage unbalance are obtained. The last stage displays the indices geo-referenced on power quality maps, allowing the identification of critical areas according to different criteria. The results can be analyzed using clustering tools to identify differentiated quality groups in a city. The proposed system is an open source tool useful to electricity utilities to analyze and manage large amount of data.Index Terms: Clusters, Critical zones, Information management, Power quality (PQ), PQ indices, PQ meter, Sags Activity Index (SAI), Voltage disturbances, Web Platform.
RESUMEN
Este trabajo propone el desarrollo de un sistema de monitoreo de calidad de potencia, el cual está diseñado para evaluar la calidad de potencia y detectar zonas críticas en un sistema de distribución. Al sistema de monitoreo lo conforman un soporte físico y una herramienta de procesamiento de software, de los que se pueden describir cuatro etapas: Primero, las perturbaciones de calidad de potencia son registradas por medio de un analizador de calidad de potencia y los datos se transmiten por un router inalámbrico que posee tecnología 3G. Segundo, estos datos llegan a un servidor, donde se procesan y filtran mediante una base de datos construida en una herramienta de código abierto. En la tercera etapa se obtienen algunos indicadores estadísticos relacionados con tensiones sags, swells, flicker y desbalance de tensión. La cuarta etapa muestra estos indicadores georreferenciados en un mapa de calidad de potencia, permitiendo la identificación de zonas críticas de acuerdo con diferentes criterios. Los resultados pueden ser analizados utilizando herramientas de agrupamiento a los fines de identificar grupos de calidad de potencia diferenciados en la ciudad. El sistema desarrollado es una herramienta de código abierto que puede ser empleada por compañías eléctricas para analizar y gestionar gran cantidad de información.Palabras Clave: Agrupamientos, Zonas Críticas, Calidad de Potencia (PQ), Gestión de Información, Indicadores PQ, Índice de Actividad de Sags (IAS), Medición PQ, Plataforma Web, Perturbaciones de Tensión.
1. Introduction
The Colombian regulatory body CREG has demanded that Colombian electricity utilities install power quality measuring systems. These systems are aimed at providing the utilities with the necessary information to determine their local power quality conditions and improve PQ conditions (CREG, 2005). The measuring devices were installed on all medium voltage buses (> 1kV) recording steady state disturbances every 10 minutes and voltage events in a distribution network. The utilities thus face the task of managing a large amount of information, as well as defining methodologies for analysing and assessing PQ indices. Considering that the power quality information should be as clear and easy to interpret as possible, the utilities must also find a manner to display the information in a synthesized and consistent way to display information about disturbances (Bingham, 2008).
Once the above described tasks are already solved, it is possible to identify power quality clusters as it will be shown in section IV-C1. Clusters are able to identify and mark off customer groups with critical conditions of power quality (Romero, 2011). Additionally, further analysis should be carried out in those particular groups related to some cumbersome PQ disturbances. These analysis search the relationship between the trends of the calculated indicators and the behavior of the load in the monitored customers.
The implementation of such a system is not an easy task given some limitations in the measurement of final customers. For instance, the power quality indices registered at medium voltage (MV) buses differ significantly from those indices at the Point of Common Coupling PCC. Therefore, an integral and complete power quality analysis cannot be carried out due to the lack of complete information about the PQ disturbances given the limited number of measurement devices (Gallego, Torres, Pavas, Urrutia y Cajamarca 2005). Furthermore, some measurements at the PCCs are not necessarily synchronized with the medium voltage measurements, making the problem even worse.
To cope with the above mentioned difficulties, it is necessary to design and develop a PQ monitoring system that optimizes the allocation of PQ meters, improving in this manner the uses of data and simplifying the analysis on the final users (Gallego et al., 2005; Pavas, Torres, Delgadillo 2010). As part of this long-term task, a measurement device was built to record voltage disturbances like sags and swells on final customers, which is accessible from a web platform to characterize statistically PQ disturbances during long term measurements.
This paper presents the design, construction and implementation of a PQ monitoring system, which partially provides a solution to the previously described problems. This system is composed by a hardware device and the development of a software tool. In addition, a web platform was designed to build the PQ indices and to analyze them, as it was explained before. As a result of this analysis, PQ clusters may be determined on-line through a web query application. In this application, an user may query, on an ongoing basis, some PQ indices and easily visualise the current and future power quality conditions (Bollen, 2010).
The indices are calculated and shown using tables, time evolution graphs or even cumulative frequency distributions for a given interval of time. These tools allow the user to identify the severity of the problems in a more detailed way. The results also include a display of the PQ disturbances which are properly geo-referenced in an specific place (in this case, the system was implemented in the city of Bogotá, Colombia).
2. Measurement system description
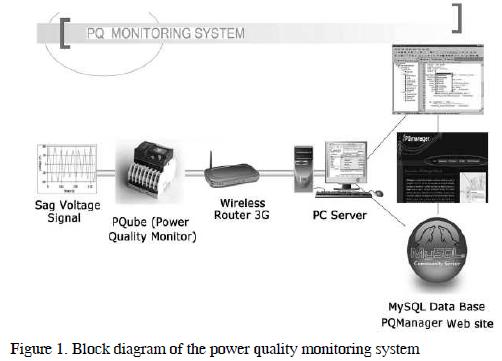
In general terms, the implemented power quality monitoring system consists of the stages of data acquisition (measurement), data pre-processing and data visualisation. The first step is to measure phase-to-neutral voltages to detect real time voltage disturbances at the PCC. This stage involved a PQ meter constructed and designed for this purpose. After any voltage events have occurred, this disturbance is stored in the PQ meter recording data concerning the location, duration, date, time and magnitude of phase-to-neutral voltages in each of the three phases during a disturbance. Next, the information is sent to an e-mail server (in this case, gmail mail manager) through a 3G wireless router. These different stages are illustrated in Figure 1.
All the information is processed in a master server located in a specific place for centralising the measured data. Thus, by the time the information is in the mailer (mailer is an acronym for e-mail server), there is an algorithm detecting minute by minute whether an e-mail had arrived to extract it into a
MySQL database. Once data are properly recorded in the database, the power quality indices are calculated and may be queried through the web app. These PQ indices enabled an analysis to be carried out to determine critical areas to be grouped to establish PQ clusters. These clusters may also be visualised by means of PQ maps, these were constructed for Bogotá.
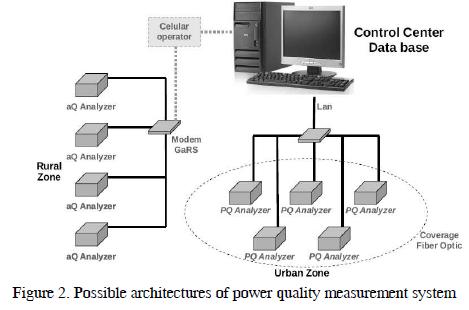
The proposed structure is very useful for any electricity utility, not only for monitoring purposes but also for support solutions to PQ problems identified in the distribution grid (Gallego et al., 2005). For instance, these devices may be connected to a particular substation (probably located in a critical area) as well as in some customers' PCCs (associated with the same substation) for providing a more detailed monitoring of PQ disturbances and their possible causes. Different architectures may be implemented depending on the nature (urban or rural) of the critical area to be monitored. These different architectures differ in the available communication technology (GPRS, WAN, LAN, 3G, etc). An example of the possible architectures is illustrated in Figure 2.
IEC standard 61000-4-30 Class A measurements (IEC, 2008). Both, steady-state disturbances (flicker, voltage unbalance, voltage and current harmonics) and voltage events (interruptions, sags, swells and voltage deviations) are measured. However, the proposed system is focused on the information required by CREG, so the analyzed PQ disturbances are:
- Steady-state. Flicker and voltage unbalance
- Voltage events. Sags, swells and voltage deviations.
A. Description of Power Quality Monitoring Equipment
The first stage in developing of power quality monitoring system was developed and built an equipment to measure phase to neutral voltages and analyze voltage signals to detect voltage disturbances. This equipment has the following functions:
- To measure in real time phase to neutral voltage, frequency, current, power of 3 phases system and individual power of each phase, power factor, the vectors diagram of voltage and active, reactive, apparent energy. The equipment measures the minimum, maximum and average values.
- To detect, measure and record voltage disturbances like voltage sags, swells, flicker, interruptions and voltage unbalance.
- To send the voltage disturbances information detected through a 3G wireless router to an e-mail server. Later, this information is stored in MySQL database as it will be shown in section II-B.
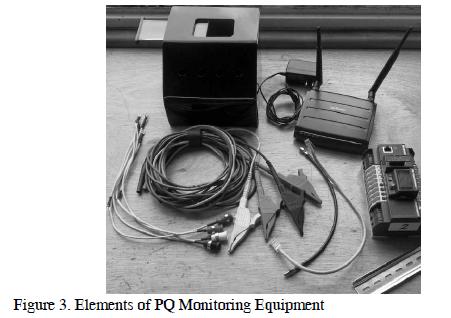
To meet these goals, the PQ monitoring equipment was developed and constructed with the following components as shown in Figure 3.
The PQ monitoring equipment had to have the following main features. It has to be a three-phase meter and powerful PQ disturbances recorder which is able to work with sensitive electronic equipment and electrical installation where service continuity is critical or essential for users and does not need special software to send e-mails with disturbance records to an e-mail server.- Three-phase meter and monitor event power quality PQube PSL Firmware 1.3.0.
- 3G wireless HSDPA wifi router. (Serie 421R).
- Acrylic Box Support. (16x16x16 cm).
- 4 IEC61010 panel mount banana jacks for sheathed plugs.
- 4, 195 strand, 12A, 18AWG, 0.146 OD silicone test lead wire.
- 8 solderless shrouded banana plugs.
- 4 large alligator test clip insulated, shrouded banana jack.
- Other accessories such as 18 AWG silicon cable and aluminium DIN rail bracket.
The PQ monitoring equipment records voltage disturbances as they occurred, the PQ meter has to have a built-in memory for data logging and capturing, capable of storing all measurements recorded over one week, one month and even one year. The communication equipment (3G wireless router) has 1024 samples per second sampling rate and be able to send information during a period of 24 hours every day of the year.
B. Web Application System
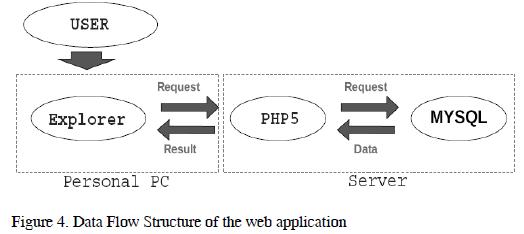
All The PQ monitoring system has a server where all information came from the PQ equipment described above. The information on the server is managed through internet through web tools and data management systems. The web application was implemented with an open source database (MySQL), a dynamic web page scripting language (PHP5), and an open source server (APACHE) platform. An internet site is used for a user to perform the necessary activities for managing and requesting information (Alves, Fernandez 1999). Figure 4 shows, that user can make a request from any computer. The request will be sent to the server by PHP and perform the corresponding action for delivering a reply.
Accessing the web application by internet for managing and consulting power quality information, the user has 3 HTML modules:
1) Information management. Users can manage data entries to the database, review misinformation and obtain detailed information for each bus observed.
2) Power quality indices. Users see indices calculated
for the entire system or for a group of buses in the distribution system during a selected time interval.
3) Power quality maps and critical areas detection.
Users can see indices for each disturbance on geo-referenced maps where critical areas are identified.
3. Information management
The information management module has the necessary tools to enter, extract and view detailed PQ information for each bus. It is possible to ask for PQ information from the database, the amount of records, observed buses, errors and database size to manage the space on the server. The PQ monitoring system data registered all 365 days; this required large storage capacity. However, only some kind of information is shown depending on the user. The utilities defined which users can modify the database and which users can see certain information. It is necessary to define some types of users and their privileges regarding the information. To make a request management system, users of the web application have one of three types of privileges:
- User with administrative and consultation privileges.
- User with consultation privileges.
- User without privileges.
Only users with administrative and consultation privileges can perform information management. User with administrative consultation privileges are only utility's staff, specially the staff committed to manage and analyze power quality.
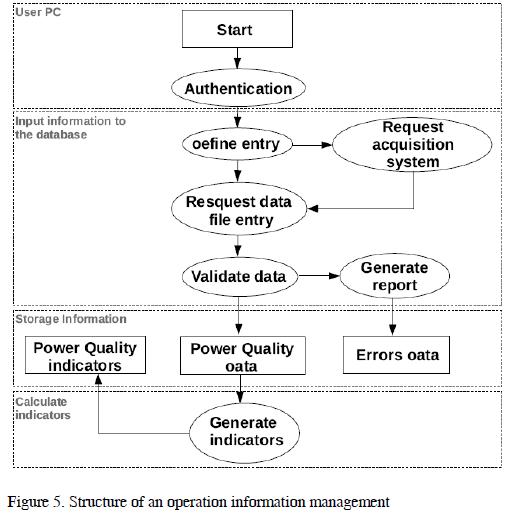
For entering information into the database, an user with administrative privileges access to consult the web application from any computer and to make a first step in operations related with authentication as shown in Figure 5. When the privileges are set, the user is able to select the input from the database which be directly from the measurement system or through some files of information generated by the control center.
Subsequently, the information is checked to identify and report some errors in format, communication or measurement.
When the information is checked, power quality data are stored in the MySQL database. For each measured bus, there are two data tables which are updated periodically. The errors are stored in other tables and are used to generate reports and to identify potential faults in the communication or faults in connections of any measuring device.
Finally, the module contains the necessary tools to perform custom queries about any observed bus in a selected time interval. The utility can check the error reports, to do a detailed monitoring of the recorded values and may have information available in individuals cases studies.
4. Power quality indices calculation
When the power quality information is stored in the database, the web application processes and calculates the power quality indices, which are set in the input options. For power quality assessment, indices for each bus or a group of buses have to be defined. Measurement methods of each disturbance recorded correspond to the parameters outlined in the standard IEC61000-4-30. The implemented indices for each type of disturbance are described in the following subsections.
A. Steady state disturbances
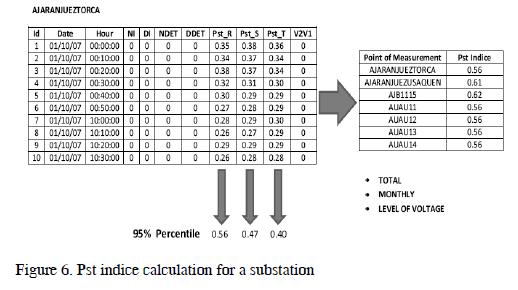
Disturbances such as voltage unbalance and flicker are recorded every 10 minutes by the measuring device, according to requirements of the regulator body. Indices obtained from the web application are percentiles between 50 and 95, average, maximum and minimum values for any selected period of time, including one day, a week, a month or all the recorded information. The Fig. 3 shows when the indicator 95% is selected and the calculated value is stored in another table on the database, then this table is queried by the Internet
B. Voltage Events
The indices calculated for voltage events such as voltage sags and voltage swells are more complicated (Conrad, Little, Grigg 1991). It must take into account various characteristics such as depth, duration and amount of events. Accordingly, to implement an indice is able to handle these three characteristics and evaluate them with a single value is necessary (IEEE, 2008).
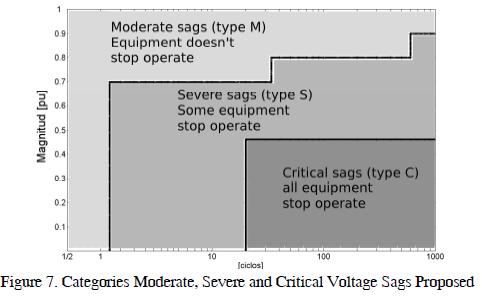
For this, according to (Romero, Pavas, Cajamarca, Gallego 2010) the voltage sags events can be classified as moderate, severe or critical using the immunity curves of electrical equipment as shown in Figure 7. In this way, sags are evaluated taking into account its impact on users' equipment.
The SAI indice (Sags Activity Index) is defined as a value between zero and one, where ''1'' represents the best quality scenery and ''0'' represents the worst scenario.
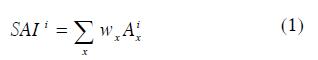
Where:
SAI i : Sags Activity index in the measured bar i.
Axi : Rating of Sags Category x in the measured bar i (between 0 and 1).
wx : Weighting of Sags Category x (between 0 and 1).
x : Sags Categories, x = {M ,C,S}
During the weighting process, it must be considered that critical sags must be punished in a more strict way than severe or moderate voltage sags. On the other hand, given that a normalized SAI index is required, the weighting factors for each category must be established as percentages of a total.
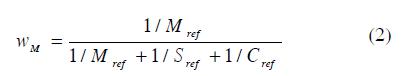
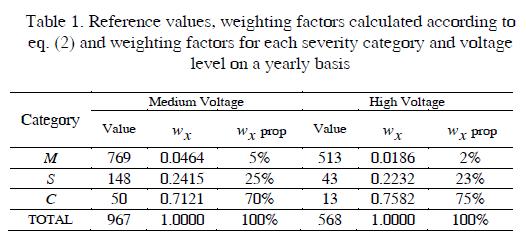
With the aim of determining these weighting factors, this paper propose an inverse weighting method based on the values listed in tables I and II, which are named as Mref (moderate sags), Sref (severe sags) and Cref (critical sags).
These reference values for categories M, S and C were based on Bogota PQ measurements in medium voltage (MV) and high voltage (HV), where the proposed categories were tagged with duration units in cycles and their corresponding values in milliseconds, considering a 60 Hz system such as that Colombia. An example of the calculation for the weighting factors for moderate sags is shown in Eq. (2).
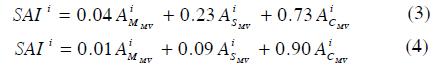
The results obtained for yearly-basis and quarterly-basis analysis are shown in Tables 1 and 2, respectively. As expected, the results showed the highest reference value for moderate sags and higher reference values for severe sags compared to critical sags (Romero et al., 2010). To avoid using weighting factors with many decimals, an approximated weighting was proposed.
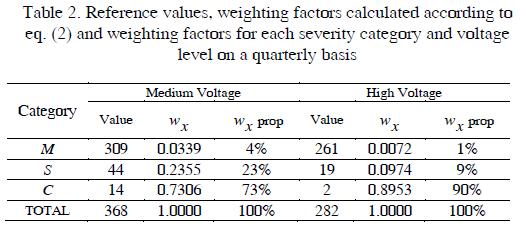
The calculation of SAI index for MV and HV on a quarterly basis is shown in Eqs. (3) and (4).
To achieve a normalization of the number of observed sags in each category, the equation proposed in (Cajamarca et al., 2006) is used, which is also presented in Eq. (5).
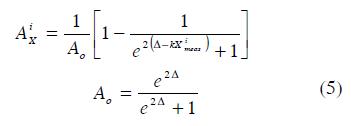
Where:
- k, β and Δ = kXref : Fitting parameters in the normalization function.
- Xref : Reference level or critical value for sags
X ∈ {M,C,S} (Reference value per year or per quarter).
- Ximeas: Level of disturbance in substation i, in other words, number of sags belonging to a category X registered during the quarter or year in the substation i.
- Aix : Normalized attribute in substation i for the category X.
For swell events, the available information referred to the equipment ITIC immunity curve, so the indicators for characterising this disturbance are percentiles 50 to 99 average, maximum and minimum values for features such as depth, duration and the amount of swells.
Once the indicators had been calculated, the web application saves the new information to new tables in the database. This information will be subsequently extracted by the web platform through user queries.
C. Query and display results
For query indices, a user has to first establish query parameters such as type of disturbance, indicators required, time interval for evaluation and observed buses (Pavas et al., 2006). When these parameters have been defined, the application displays the results as tables and graphs. Several results can be viewed in the application, for example the distribution values for an indice calculated for a substation, a voltage level or all the substations in general. The observed buses can be evaluated individually or in sets for analysing the information in detail. The results systematically extracted from the application are:
1) Clusters Detection: The PQ of industrial and commercial users mainly determines PQ conditions in power systems and distribution grids. Therefore, researching methodologies for analysing and assessing of PQ in users is necessary for determining PQ problems. PQ is evaluated by means of indicators, discriminated by area and load type in distribution grid substations (Mueller, McGranaghan 1995).
Clustering is a way to evaluate critical groups' PQ problems, they are spatial agglomerations having common economic activity; for example, a significant number of companies engaged in an activity represents a cluster, characterised by continuously trying to increase their economic efficiency through different ways of business coordination. Better quality electricity supply for a specific economic sector will be reflected in the increase of a cluster's economic efficiency (Altenburg, 2006), thereby contributing to the companies' concerns.
The web application for PQ monitoring system provided a tool for evaluating selecting and characterising clusters. PQ clusters allow studying the impact of local PQ conditions on the productivity any particular cluster, thus a suitable mechanism to improve an undesirable condition may be determined easily.
Evaluating PQ in users by using cluster methodology leads to identifying a cluster's needs disturbances and vulnerability. Thus, clusters methodology presents:
- Systematic PQ analysis, supporting the finding of any PQ problem.
- Final users would be grouped following specific criteria for identifying problems in a specific place.
- Correlating PQ disturbance and final user load performance.
The problem lay in performing PQ analysis focused on optimising solutions for a production sector using clusters. Previous studies have found technical shortcomings regarding final user measurements. One of the shortcomings was that the utilities needed to manage a crew of qualified technical personnel to carry out PQ measurement at certain network points. As customers may not allow companies to take PQ measurements, it causes difficulties in the logistics. The latter situation represents another shortcoming; PQ data records cannot be correlated efficiently and it is difficult to analyse the information so obtained. According to the above, it was necessary to implement a PQ monitoring system for customers allowing simultaneously synchronised measurement of PQ disturbances for comprehensive analysis of the costumer conditions.
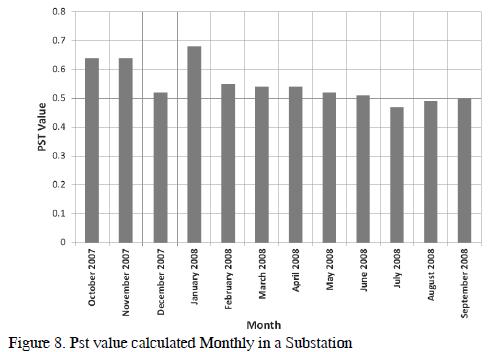
2) Evolution of indices: figure 8 shows the evolution of the Pst index in a time interval for a single substation, allowing disturbance to be verified as time elapsed and also identify periods of the year in which the observed buses have critical PQ conditions (Murillo, Blanco, Gallego 2010).
The profiles can be calculated for any among the above listed indicators, for either a single observed bus or groups. The profiles can be calculated with regard to voltage level as well. The value any disturbance for each month can be defined as percentiles 50 and 99, an average, a maximum or a minimum.
3) Frequency distributions: The user can verify which is the characteristic of the values of each disturbance resorting to frequency and cumulative distributions. The Figure 9 displays the amount of values that are in a specific range, the results allows to know the level of critical indicator.
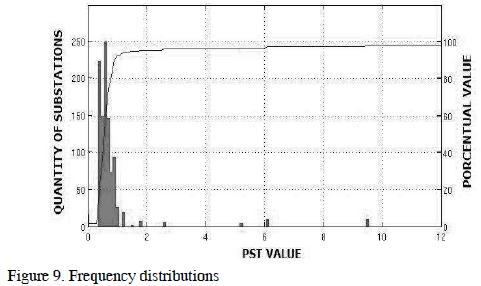
Cumulative distributions characterised a single bus in a network regarding a set of buses using a common filter. This is a handy function because future limits can be established by type of substation (rural or urban), or the observed bus' voltage level.
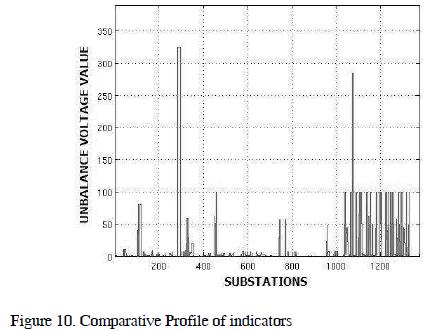
4) Comparative indicator profile: this profile is used to calculate a time interval for any disturbance. A user can observe the values calculated for each substation reported and verify this with other substations. The idea is to check which buses are more critical than others. It is shown in Figure 10.
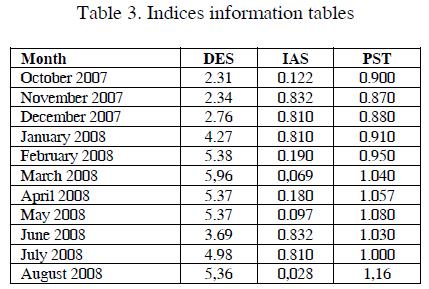
5) Indices tables: In this function the tables show a summary of the indices in each of the group substations. The tables permit the comparison of indices to verify and correlate with others. The web application displays indices information as shown in Table 3.
The utility or any user can perform an indices analysis in a practical and systematical way, he can identify potential critical substations, determine trends and identify a critical season, make comparisons and find relationships between indices values of all disturbances to a bus and view the details of indices for each observed bus.
A scheduled report can be generated on demand. A web application user can receive detailed and personalised information to control the recorded disturbances.
5. Power quality maps and critical areas detection
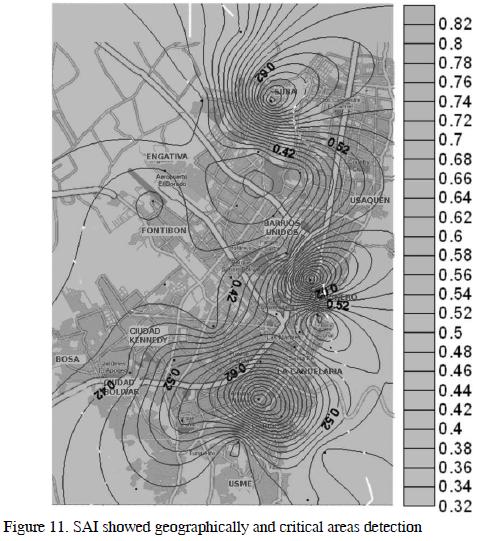
In the power quality maps and critical areas detection module, the web application shows the calculated indices for each disturbance and certain period of time over a georeferenced map. With this tool the utilities can identify areas with different power quality conditions.
In this module a map with Geo referenced information of each bus on the distribution system is used. A specific map from Google maps is used to show the location of all buses and graph contours. A user can select a disturbance and the time to be assessed. A query is performed by the web system and the calculated indices are assigned to a geographical point. Every contour is calculated by an algorithm programmed in octave (Linux). Figure 11 shows the SAI index. The utility can perform maintenance plans focused on critical areas of the distribution system (shown in number 0.82 in the Figure 11).
The construction of PQ maps depends of the distribution network configuration and the correct position of some specific number of PQ measurement equipments within the distribution network. This number depends to solve the problem of customer assignment responsibilities. This problem consists to find the disturbances origin and the contribution of one customer on other costumers in the distribution network and this problem will not study in this article.
6. Conclusions
The development of an automated PQ monitoring system called for the creation of a flexible hardware system and a software processing tool. The hardware system was used to detect voltage disturbances and the software processing tool together with a dynamic database, was designed taking into account specific monitoring objectives based on the Colombian regulatory entity. This resulted in an efficient system, allowing to record and to send voltage disturbances information in real time and the automatic emission of voltage disturbance indicators, making easier the management process.
This system is an important tool to utilities for systematical assessment of indices, especially in the cases when the bad PQ conditions affect the customers. In addition, it is possible to identify critical areas, in which the utilities can implement solutions to reduce failure rates in distribution networks and to improve the reliability of the distribution system and the PQ conditions. Some solutions for to the problems mentioned above could be: to revise maintenance plans, to automate the distribution network and to change the network topology.
7. Acknowledgment
The development of this work is framed within the research project ''Technological Innovation on Integrated Power Quality Management'', co-financed by COLCIENCIAS, CODENSA S.A. E.S.P. and the National University of Colombia. The authors would like to acknowledge the support of all the funding entities throughout the research.
8. References
Altenburg, T. ''La promoción de clusters industriales en América Latina''. Focopyme, Buenos Aires. 2001 [ Links ]
Alves, M.F.; Fernandes, D.E.B. Development of an automated power quality management system. Transmission and Distribution Conference, 1999 IEEE Volume: 2. 1999 , Page(s): 579 - 584. [ Links ]
Bingham, R.P. Measurement instruments for power quality monitoring. Transmission and Distribution Conference and Exposition, 2008. T&D. IEEE/PES. 2008, Page(s): 1-3. [ Links ]
Bollen, M. Understanding Power Quality Problems: Voltage Sags and Interruptions, The Institute of Electrical and Electronics Engineers, IEEE Press,INC. New York, NY 10016-5997, 2000. 543 pages, NY-USA. [ Links ]
Cajamarca, Torres, Pavas, Urrutia, Gallego, Delgadillo. Impact Assessment of Power Quality Limits in Colombia: a Regulatory Approach. IEEE Latin America Transm. and Distrib. Conference. Caracas (Venezuela). 2006. [ Links ]
Conrad, L., Little, K., Grigg, C., Predicting and preventing problems associated with remote fault clearing voltage dips. Industry applications, IEEE transactions on publication date Jun / Feb 1991, vol 27, issuel on page(s) 167 - 172, Tennessee. [ Links ]
CREG. Resolución 024 de 26 de Abril de 2005,''Por la cual se modifican las normas de calidad de potencia eléctrica aplicables a los servicios de Distribución de Energía Eléctrica''. Bogotá, Abril 26 de 2005. [ Links ]
Gallego L, Torres, H.,Pavas A, Urrutia D., Cajamarca G., Rondón, D., A Methodological proposal for monitoring, analysing and estimating power quality indices: The case of Bogotá - Colombia. IEEE Power Tech 2005. St Peterburg, Russia. July, 2005. [ Links ]
IEEE Std 1159 Recommended Practice for Monitoring Electric Power Quality 2008. [ Links ]
International Standard IEC 61000-4-30. Electromagnetic Compatibility (EMC) - Part 4-30: Testing and Measurement Techniques - Power Quality Measurement Methods. Ed 2.0. 2008-10-13. [ Links ]
Murillo O., Blanco A.M., Gallego L., Impact of Long and Short-time Voltage Variations on the PST and Voltage Unbalance Indicators; Universidad Nacional de Colombia ,International Conference on harmonics and Quality of Power ICHQP 2010. Bergamo, Italy. 2010. [ Links ]
Mueller, D., McGranaghan, M., Electrotek Concepts Effects of voltage sags in process industry applications. Invited paper spt IS 01-2, presented at the IEEE/ KTH Stockholm power tech conference, Stockholm Sweden, pages (6), June 18 - 22, 1995. Inc Knoxville, Tennessee. [ Links ]
Pavas A., Torres-Sánchez H., Delgadillo A., A novel approach for the simulation of power quality stationary disturbances in electric power systems. International Conference on harmonics and Quality of Power ICHQP 2010. Bergamo, Italy. 2010. [ Links ]
Pavas A., Torres H., Urrutia D., Cajamarca G., Gallego L., Delgadillo A. Method for the calculation of power quality indices. IEEE Power Engineering Society - PES General Meeting. Montreal, Canadá. Junio 2006. [ Links ]
Romero M., Pavas A., Cajamarca G., Gallego L., A new methodology for the comparative analysis of sags among substations in a distribution network in Colombia 14th International Conference on Harmonics and Quality of Power ICHQP2010, 2010. Bergamo Italy. [ Links ]
Romero M. Diseño de una metodología para análisis de sags de tensión en redes de distirbución. - Colombia. National University of Colombia. Master Thesis, Colombia. January, 2011. [ Links ]

