


Serviços Personalizados
Journal
Artigo
 Inglês (pdf)
 Artigo em XML
 Referências do artigo
 Enviar este artigo por email
Indicadores
-
 Citado por SciELO
 -
 Acessos
Links relacionados
-
 Citado por Google
 -
 Similares em
SciELO
Similares em
SciELO -
 Similares em Google
Compartilhar

 Permalink
Ingeniería e Investigación
versão impressa ISSN 0120-5609
Ing. Investig. v.32 n.1 Bogotá jan./abr. 2012
Uncertainty regarding instantaneous discharge obtained from stage-discharge rating curves built with low density discharge measurements
Incertidumbre en caudales instantáneos obtenidos con curvas nivel-caudal construidas con una baja densidad de aforos líquidos
Juan Felipe Martínez Plata1, Efraín Antonio Domínguez Calle2, and Hebert Gonzalo Rivera3
1 Civil Engineer, Universidad Nacional de Colombia. MSc in Hydrosystems, Pontificia Universidad Javeriana, Colombia. E-mail: juanfmartinezp@gmail.com.
2 Engineer Hydrologist, MSc in Ecology and Hidrometeorology, PhD in Technical Sciences, Russian State Hydrometeorological University, Russia. Associate Profes-sor, Facultad de Estudios Ambientales y Rurales, Pontificia Universidad Javeriana, Colombia. E-mail: E-mail:e.dominguez@javeriana.edu.co.
3 Engineer Hydrologist, PhD in Technical Sciences, Russian State Hydrometeoro-logical University, Russia. Posdoctoral Research, Universidad Nacional de Colombia. Associate Professor, Facultad de Ingeniería Ambiental, Universidad Santo Tomás and Facultad de Ciencias Humanas, Departamento de Geografía, Univer-sidad Nacional de Colombia. E-mail: hidricos@yahoo.com.
Received: December 12th 2011; Accepted: February 29th 2012
RESUMEN
En el presente trabajo se realizó un análisis de incertidumbre del proceso de construcción de la curva nivel-caudal, con el fin de estimar el error o incertidumbre de los caudales obtenidos considerando diversos escenarios de disponibilidad de aforos. Se implementó una metodología para generar muestras artificiales de aforos a partir de datos reales observados en campo y estudiar el efecto de la cantidad y distribución de las mediciones sobre la incertidumbre de los caudales instantáneos. Los resultados obtenidos indican que la incertidumbre de los caudales depende principalmente de la cantidad de aforos utilizados para la calibración de la curva nivel-caudal y del grado de extrapolación con respecto a los niveles aforados. Para los casos estudiados se encontró que cuando la curva es calibrada con una baja cantidad de aforos la incertidumbre de los caudales instantáneos en la zona de niveles medios puede llegar hasta un 14%. En la zona de niveles máximos y mínimos la incertidumbre puede llegar hasta el 20% y 60% respectivamente, valores que pueden incrementarse dependiendo del margen de extrapolación. En este orden de ideas, se estableció que en el caso de los caudales instantáneos para la zona de niveles mínimos es necesario disponer de al menos 35 aforos para la calibración de la curva, con el objetivo de cumplir los estándares mínimos recomendados por la Organización Meteorológica Mundial (OMM).
Palabras clave: incertidumbre, error, curva nivel-caudal, curva de gastos, aforos, regresión.
ABSTRACT
This work concerned uncertainty analysis for constructing stage-discharge rating curves to estimate error or uncertainty regarding calculated discharges, considering different discharge measurement availability scenarios. A methodology was used for creating artificial samples of discharge measurements from real data observed in the field and the effect of variation on measurement quantity and distribution concerning instantaneous discharge uncertainty was then studied. The results indicated that discharge uncertainty mostly depends on the number of river discharge measurements used for rating curve calibration and on the extent of extrapolation outside the range of measured river water levels. This research found that uncertainty regarding instantaneous dis-charges calculated for the area within average level values could be as high as 14% when the rating curve was calibrated with few measurements. Uncertainty can reach 20% and 60% for high and low water level values, respectively, or even higher depending on the extent of rating curve extrapolation. This work established that 35 discharge measurements for rating curve calibration were needed to fulfill World Meteorological Organization standards concerning discharge defined for low water level values.
Keywords: Uncertainty, error, stage-discharge relationship, rating curve, fluid measurement, regression.
Introduction
International hydrometric practice relies on frequent water level measurements taken at river gauge stations and on calculating river discharges through a previously established stage-discharge ratio. Constructing a rating curve requires taking a group of river dis-charge measurements concerning a wide range of water levels to calibrate the rating curve for a specific hydrological station. Some international standards recommend a minimum 10 to 15 discharge measurements per year (World Meteorological Organization 1994; Rantz 1982; ISO 1998), while others suggest up to 70 measurements for hydrometric stations located in mountainous areas (Karasiov and Shumkov 1985). A hydraulic section is considered to be morphologically stable when the best estimation of river discharges in a hydrometric station is obtained from the rating curve built with the maximum number of discharge measurements available (I. Karasev and Shumkov 1985). The Colombian hydrometric monitoring network budget does not mounting intense, ongoing measurement campaigns; rating curves are thus set up with a limited number of discharge measurements concentrated in mid water-level oscillation range (IDEAM 1998; Dominguez et al., 2006).
Several international publications (Clarke et al., 2000; Shiklo-manov et al., 2006; Petersen-Øverleir and Reitan 2009) have presented rating curve uncertainty estimations and shown error propagation from field measurements and the fitted rating-curve model; however, they have not considered the effect of the number of discharge measurements and their distribution regarding analysed rating curve confidence.
This study was mainly aimed at estimating uncertainty which is propagated into instantaneous discharge values obtained from rating curves built from low density discharge measurements. These refer to cases where the rating curve is constructed from scarce discharge measurements (less than 6 support points) and where support discharge-level point distribution does not cover the full range of registered levels for a particular hydrometric station.
The present work assesses rating curve uncertainty for cases where the discharges used to build the rating curves came from the same curve stability period, i.e. only discharges from periods of time having little or no significant changes in cross-section's hydraulic characteristics were included in the uncertainty assessment to ensure that only non-hysterical stage-discharge relationships were considered.
Theoretical framework
Rating curve calibration is essentially a regression exercise; the most frequently applied model has been the power relationship model (Herschy 1999):
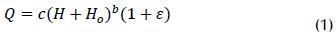
Q is estimated discharge [L3/T], H observed water level in a hydrometric station [L], Ho, b and c are the model parameters to be calibrated. Basic assumptions are that error term ε is normal distributed with zero mean value (E[ε]=0) and constant variance 8var[ε] = σ2). No correlated errors are assumed (cov[εi, εj]=0) for different observation points (Petersen-Øverleir and Reitan 2009).
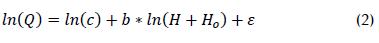
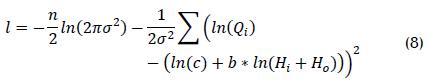
Before calibrating parameters, the potential model is logarithmically transformed equation [2] and then optimal parameters values are derived, searching for the combination minimising in equation [3] (Venetis 1970):

The main sources of rating curve analysis uncertainty are field measurement error (especially due to error in mean speed measurements for each speed profile, depth measurement error and discharge integration error, according to the number of speed profiles), model type selection (due to model incompleteness, i.e. neglecting variables like hydraulic slope) and calibration (i.e. due to numerical method approach or calibration point number and distribution). Other factors such as changes in section morphology and variation in hydraulic conditions because of variable backwater or rapidly changing discharge can be neglected depending on the site where the station is placed, and their effect is usually added to other sources of error when individual estimation is not affordable (Petersen-Øverleir and Reitan 2009).
The following equations (Clarke 1999) can be used for assessing power model rating-curve relationship uncertainty in estimated discharges for a specific level (H=a):

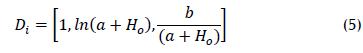

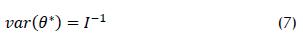
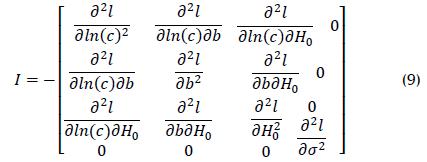
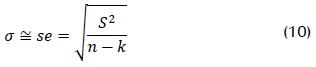
where I is known as the Fischer information matrix (Stuart et al., 2009; Seber and Wild 2003). Venetis has dealt with partial derivate terms included in the matrix (Venetis 1970). The value of σ2 can be estimated using standard error of regression (se):
Case study
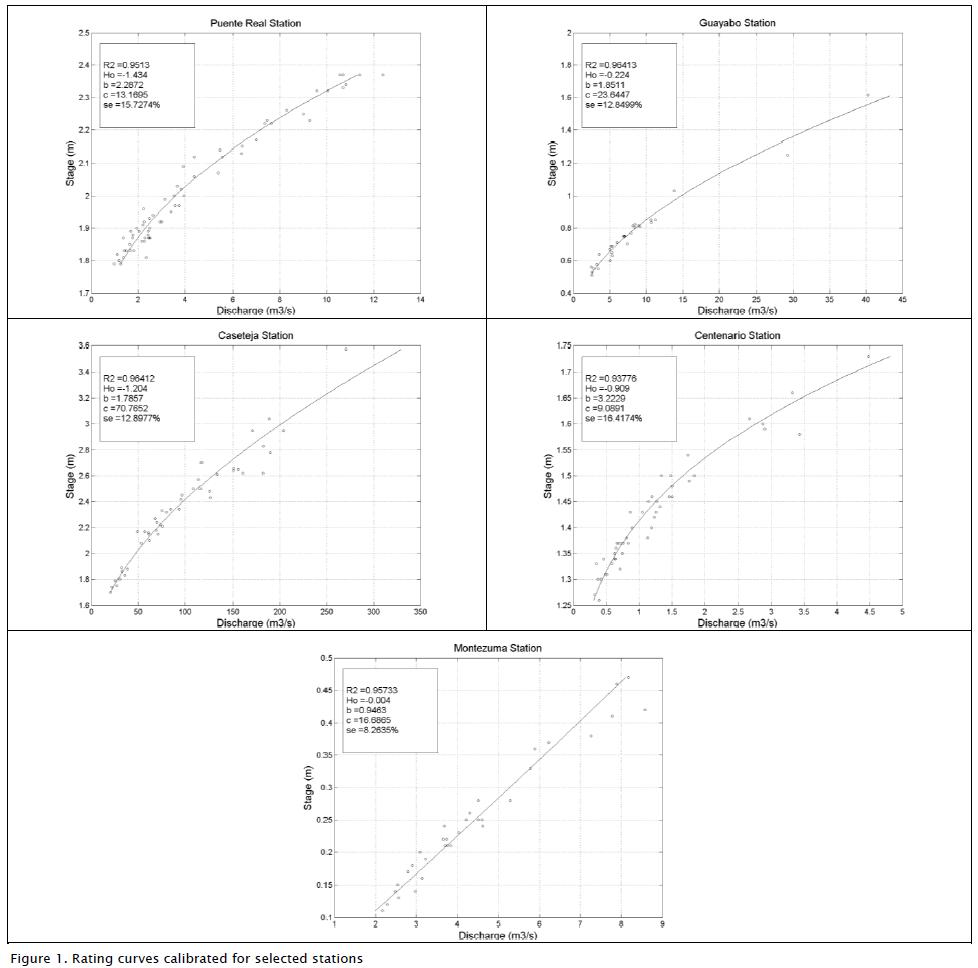
Discharge measurement records were collected from 5 hydrometric stations forming part of IDEAM's hydrometric network (Martínez 2011) (Table 1). Hydrometric records were selected from hydrometric stations having intense measurement campaigns in IDEAM regional headquarters to have a rating curve calibrated with high discharge measurement density and then compare this situation to a low-density measurement scenario. Attempting to exceed international standards, selected stations had at least 30 discharge measurements for the same stability period. Figure 1 shows the rating curves calibrated for selected stations.
Figure 1Artificial random samples were produced following a procedure similar to that proposed by Petersen-Øverleir and Reitan (Petersen-Øverleir and Reitan 2009). Random water level samples conside red uniform distribution and calculated discharge values from the rating curve constructed from the total measurement sample; a random term ~ N (0, ) was then added to include overall model error, involving the following equations:

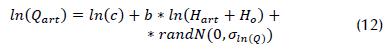
Hart were artificially generated water levels, Qart were artificial discharge values, randU(Hmin,Hmax) was a random value assuming uniform probability density function within minimum and maximum interval observed water levels for total discharge measurement sample record. randN(0, σ) was a simulated random value supposing normal probability density function having zero expected value and σ2 variance. The latter was always approximated with the regression's square standard error (se). This simulation scheme was replicated by changing the number of support points used for rating curve calibration and instantaneous discharge uncertainty was then estimated by using equation [7] for every replicated subsample.
Results
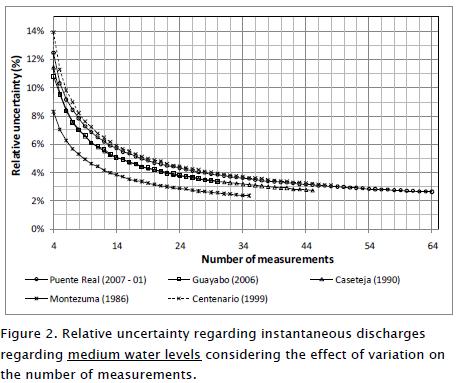
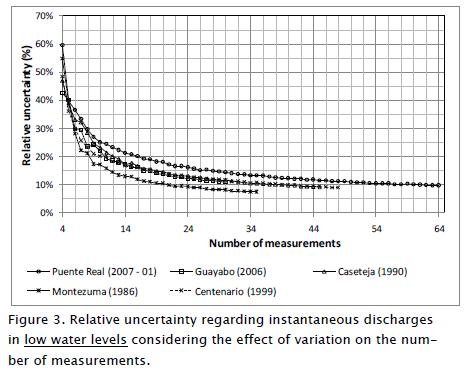
Discussion focuses on the uncertainty of instantaneous discharges determined for medium, high and low recorded water levels for the current rating curve. Figures 2 to 4 plot the uncertainty rates for instantaneous discharge against the number of discharge measurements supporting rating curve construction. The values shown in the Figures were grouped subsample medians according to the number of measurements used in each case. Regarding these figures, a generalised trend towards reducing relative uncertainty with increased discharge measurements supporting rating curve fitting were fixed. In the case of instantaneous discharges calculated for medium level range, relative uncertainty reached 8% to 14% when the number of measurements was 4 and tended to decrease to 4% to 7% when the number of measurements rose to 12. Taking the 10% maximum uncertainty limit recommended by WMO (World Meteorological Organization 1994) into account, it was established that it would be fulfilled even with 10 measurements in every case; nevertheless, for minimum level range instantaneous discharges, relative uncertainty was 40% to 60% with 4 support measurements. Such uncertainty could decrease to 15% to 25% when discharge number rose to 12. This meant that the recommended number of discharge measurements for rating curve calibration should be higher than 35 for instantaneous discharges defined for low levels to fulfil WMO uncertainty requirements.
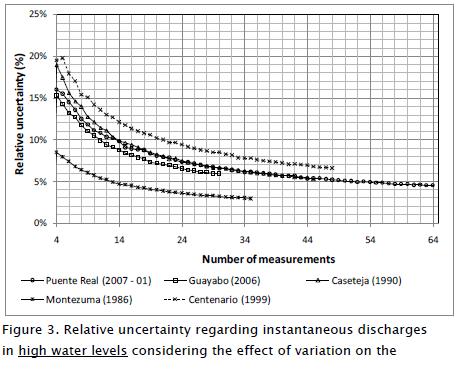
Instantaneous discharge uncertainty in maximum water level areas was around 9% to 20% when the rating curve was built with at least 4 discharge measurements. Such uncertainty became reduced to 5% to 13% when the supporting number of measurements rose to 12 measurements. Instantaneous discharge uncertainty calculated with rating curves constructed with 20 or more measurements would be lower than 10%, fulfilling the maximum allowed error required by international standards. According to these results it could be concluded that hydrology monitoring systems must supply at least 35 measurements to support construction of rating curves for every period of the curve's validity to fulfil international hydrometric standards.
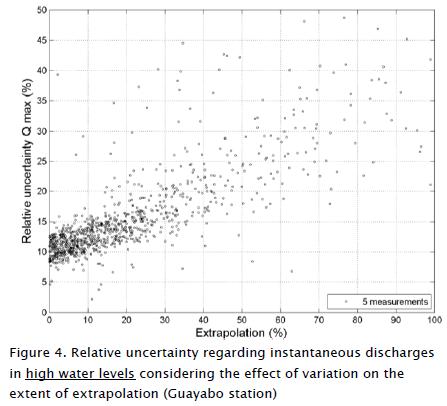
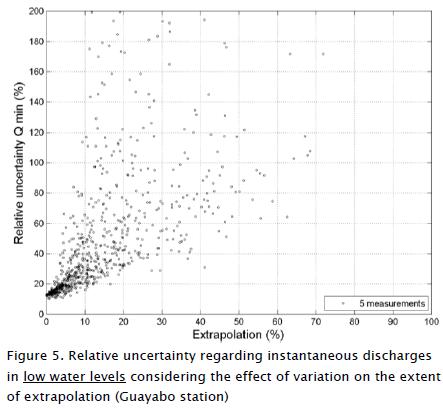
An important aspect of instantaneous discharges defined for the low and high water level values was that uncertainty was closely related to the extent of extrapolation outside the range of observed water levels. The present study assumed that extrapolations towards maximum and minimum levels used the same model calibrated for the water level range supported by discharge measurements. Figure 4 and Figure 5 show instantaneous discharge uncertainty results in maximum and minimum observed water level areas considering variation regarding the extent of rating curve extrapolation. According to the results for samples generated with 5 measurements, instantaneous discharge uncertainty in the area of high water level values could have increased from 10% (no extrapolation case) to 15% (20% Extrapolation). Instantaneous discharge uncertainty for low water level values could be increased from an average 15% (no extrapolation) to 40% (10% Extrapolation).
Conclusions
This work has established that instantaneous discharge uncertainty calculated through rating curves built with low support discharge measurement density was higher than the maximum allowed uncertainty values recommended by international standards; therefore, their use should be limited, depending on the kind of application or study and the consequences so triggered.
According to the results, estimated instantaneous discharge uncertainty within the area of medium water level values could be as high as 14% when rating curves were constructed with a low number of discharge measurements. Similarly, uncertainty could be as high as 60% for instantaneous discharges derived from the low water level area, while discharge uncertainty for high water levels could reach 20%. Instantaneous discharge uncertainty in the maximum and minimum areas significantly depended on the extent of extrapolation outside the range of observed water levels, hence, extrapolations higher than 20% for maximum discharges and 10% for minimum discharges are not strongly recommended. It should be stressed that there should be more than 35 discharge measurements for rating curve calibration to fulfil WMO uncertainty requirements regarding instantaneous discharges defined for low water level areas.
Further investigations envisage studying uncertainty propagation regarding daily, monthly and annual average discharge values and the results of hydrological calculations and modelling, such as water scarcity indexes or flood designs used for hydraulic structure dimensioning.
References
Clarke, R. T., 1999: Uncertainty in the estimation of mean annual flood due to rating-curve indefinition. Journal of Hydrology, No. 222, pp. 185-190. [ Links ]
Clarke, R. T., E. M. Mendiondo, and L. C. Brusa, 2000: Uncertainties in mean discharges from two large South American rivers due to rating curve variability. Hydrological Sciences Journal, No.45, pp. 221-236. [ Links ]
Dominguez, E., I. Verdugo, and R. Niño, 2006: Criterios de optimización de Karaziov aplicados a la red hidrológica colombiana. Avances en recursos hidráulicos, No. 13, pp. 22. [ Links ]
Herschy, R. W., 1999: Hydrometry: Principles and Practice, 2nd Edition. 2nd ed. Wiley, 384 pp. [ Links ]
IDEAM, 1998: Diseño y Optimización de la Red de Estaciones Hidrológicas. www2.ideam.gov.co/temas/guiaagua/Anexo%203.pdf. [ Links ]
ISO, 1998: ISO 1100-2:1998: Measurement of liquid flow in open channels - Part 2: Determination of the stage-discharge relation. [ Links ]
Karasiov, I., and I. Shumkov, 1985: Hydrometry. Leningrad: Guidrometeoizdat, 384 pp. [ Links ]
Martínez, J., 2011: Propagación de errores en cálculos hidrológicos con caudales obtenidos mediante curvas nivel - caudal construidas con una baja densidad de aforos líquidos. Pontificia Universidad Javeriana, 96 pp. [ Links ]
Petersen-Øverleir, A., and T. Reitan, 2009: Accounting for rating curve imprecision in flood frequency analysis using likelihood-based methods. Journal of Hydrology, No. 366, pp. 89-100. [ Links ]
Rantz, S. E. and O., 1982: Measurement and Computation of Streamflow: Volume 1. Measurement of Stage and Discharge. department of the Interior, 284 pp. [ Links ]
Seber, G. A. F., and C. J. Wild, 2003: Nonlinear Regression. Wiley-Interscience, 792 pp. [ Links ]
Shiklomanov, A. I., T. I. Yakovleva, R. B. Lammers, I. P. Karasev, C. J. Vörösmarty, and E. Linder, 2006: Cold region river dis-charge uncertainty - estimates from large Russian rivers. Journal of Hydrology, No. 326, pp. 231-256. [ Links ]
Stuart, A., K. Ord, and S. Arnold, 2009: Kendall's Advanced Theory of Statistics, Classical Inference and the Linear Model. 6th ed. Wiley, 224 pp. [ Links ]
Venetis, C., 1970: A note on the estimation of the parameters in logarithmic stage-discharge relationships with estimates of their error. International Association of Scientific Hydrology. Bulletin 15, 105 pp. [ Links ]
World Meteorological Organization, 1994: Guide to hydrological practices. Data acquisition and processing, analysis, forecasting and other applications. 735 pp. [ Links ]
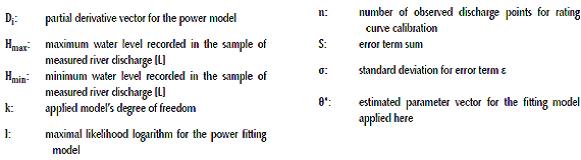
Nomenclature

