


Servicios Personalizados
Revista
Articulo
 Inglés (pdf)
 Articulo en XML
 Referencias del artículo
 Enviar articulo por email
Indicadores
-
 Citado por SciELO
 -
 Accesos
Links relacionados
-
 Citado por Google
 -
 Similares en
SciELO
Similares en
SciELO -
 Similares en Google
Compartir

 Permalink
Ingeniería e Investigación
versión impresa ISSN 0120-5609
Ing. Investig. v.32 n.2 Bogotá may./ago. 2012
Sand's electrical parameters vary with frequency
Variación de los parámetros eléctricos de la arena con la frecuencia
J. Montaña1, J. Candelo2, O. Duarte3
1 Johny Hernan Montaña Chaparro. Affiliation: Universidad del Norte, Colombia. PhD in Engineering. MSc. In High Tension. BSc in Electric Engineering. E-mail: johnym@uninorte.edu.co
2 John Edwin Candelo Becerra. Affiliation: Universidad del Norte, Colombia. PhD in Engineering. BSc. in electric engineering. E-mail: jcandelo@uninorte.edu.co
3 Oscar Germán Duarte Velasco. Affiliation: Universiad Nacional de Colombia, Colombia. PhD in informatics, Universidad de Granada. MSc. In Industrail Automatization, Universidad Nacional de Colombia. BSc. In Electrical engineering, Universi-dad Nacional de Colombia. E-mail: ogduartev@unal.edu.co
ABSTRACT
This paper presents the results of two types of test in one kind of sand to obtain resistivity and permittivity values for frequency ranging from Hz to MHz. One test involved wave generation at specific frequencies and the other an impulse generator (continuous frequency spectrum). Tests were made for three humidity values. The results of both test revealed non-linear performance on test electrode surface. Such non-linearity was modelled and eliminated to give the permittivity and resistivity values in frequency domain.
Keywords: Soil measurement, impedance measurement, permittivity measurement, resistivity variation, impulse testing, transient response.
RESUMEN
Este artículo presenta los resultados de dos tipos de pruebas hechas a una clase de arena para obtener los valores de resistividad y permitividad eléctricas en el rango de los Hz hasta los MHz. Una de las pruebas fue realizada a frecuencias específicas con un generador de señales, y la otra fue hecha con un generador de impulsos de tensión, con lo cual se trabajó un espectro continuo de frecuencias. Las pruebas se llevaron a cabo para tres valores de humedad, y los resultados de ambas mostraron un comportamiento no lineal presente en la superficie de los electrodos de prueba. Esta no linealidad fue modelada y considerada en el procedimiento de cálculo de los valores de permitividad y resistividad en el dominio de la frecuencia. Finalmente, se señalan los resultados, las conclusiones y el trabajo futuro.
Palabras clave: mediciones del terreno, medición de impedancia, medición de permitividad, variación de resistividad, prueba de impulso, respuesta transitoria.
Received: May 18th 2011 Accepted: March 28th 2012
Introduction
When a grounding system is being designed, the values for soil's electrical parameters must be known at the site where the sys-tem will be built. Resistivity (ρ), permittivity (ε) and permeability (µ) values must be considered if a study is aimed at ascertaining a grounding system's transient behaviour (Montaña, 2011; He et al., 2005).
Grcev (Grcev, 1993) classified soil as being wet or dry by means of constant values based on their humidity. Dry soil has high resistivity (10e3 Ωm) and low relative permittivity (9) and wet soil has low resistivity (10e2 Ωm) and high relative permittivity (36). These electrical parameters are assumed to be constant since they do not vary with frequency or position in soil (Visacro, 2007; Visacro et al., 2009).
Previous work has established that soil's electrical parameters, permittivity and resistivity have variations regarding frequency and humidity (Visacro and Portela, 1988; Portela, 1997a; Portela 1997b), (Scott and Smith, 1992; Visacro et al., 2011; Visacro and Alipio, 2012), whereas the relative permeability value is near to that of the vacuum. Some have used equations to represent such variation (Visacro, 1992; Visacro and Alipio, 2012); these studies were conducted in the 40 Hz to 2 MHz frequency range because the most representative lightning frequencies are in that range. These papers showed that relative permittivity can vary from 10e4 up to 10 and that resistivity can vary from 8kΩm up to 1kΩm in the range being studied.
It can be concluded from previous work that frequency variation largely affects soil's electrical parameters and therefore final results (Visacro and Rosado, 2009). This work was aimed at developing some tests for ascertaining soil's electrical parameters via frequency. Two tests were carried out in a larger range than previous work; the results of both experiments are compared and shown in this paper.
Test description
A spherical configuration was used for measuring the electrical parameters of a type of sand. The setup consisted of a 0.25 m radius outer sphere (half sphere) and 0.035 m radius inner sphere. The spheres were built with copper foils and the space between both spheres was filled with the sand. This setup was fed with two kinds of signals, a sinusoidal signal at different frequencies and an impulse voltage in the other one.
Sand humidity was changed using distilled water (5%, 10% and 15%); the ratio between the volume of distilled water added to the sand and the volume of sand was represented as a percentage. The sand and distilled water were mixed for about 4 hours to ensure a homogeneous sample. The sand had been dried at 350C for two days to eliminate any water. Distilled water was applied by means of a spray and the sample was continuously mixed. The sand used in the test had octagonal grains (0.23 mm average size).
The sand was placed into the half sphere and pressed to elimi-nate air gaps (Scott and Carroll, 1967), (Nor et al., 2006). The second sphere (inner sphere) was inserted and the setup was thus ready to start the tests immediately to avoid changing humidity values. Figure 1 shows the final setup.
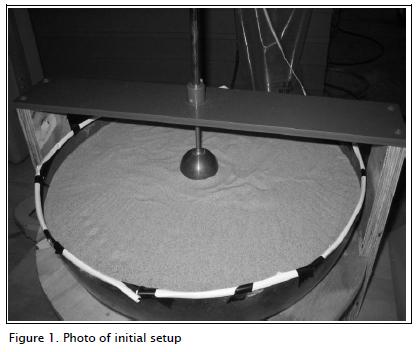
Sand was chosen since it is easily wetted and dried without loss of physical properties. The hemispherical test setup was chosen because this type of geometry may provide a comparable configuration to that in commonly used earthing systems (Nor et al., 2006; Liu et al, 2003).
This setup has been widely adopted during laboratory testing to compute soil parameters. The results computed by means of this test could lead to up to 10% error, as mentioned by Nor Haddad and Griffiths (Nor et al., 2006).
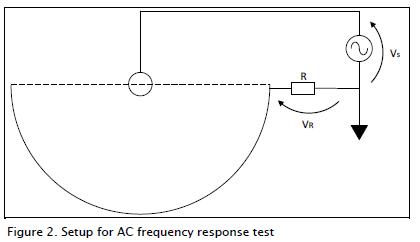
AC frequency response
A wave generator (Wavetek, Model 166) was used, frequency ranging from 0.0001 Hz up to 50 MHz in 11 different ranges, 30 V peak to peak output, 0.5% sine distortion for 10 Hz up to 100 kHz and 30 dB down for 100 kHz up to 5 MHz.
20 Hz up to 3 MHz sinusoidal waveforms were used; a resistance located in series with the setup was used to measure the current. Resistance value was 94.2Ω; it was built with eleven re-sistances in a cylindrical configuration to reduce inductive effects. Source voltage Vs and voltage over resistance VR were meas-ured with an oscilloscope (Figure 2).
Impulse frequency response
The impulse voltage source was obtained with a Schaffner gener-ator (NSG-650) involving the following types of pulse: 1.2/50 Ωs (open circuit) and 8/20 Ωs (short circuit), 200 V up to 6.6 kVΩ10% voltage range, up to 3.3 kA at 6.6 kV, dynamic impedance: low 12 Ω - high 36Ω. Three peak values were used: 1 kV, 3kV and 6.6 kV. Voltage and current were measured by means of voltage and current probes, as shown in Figure 3.
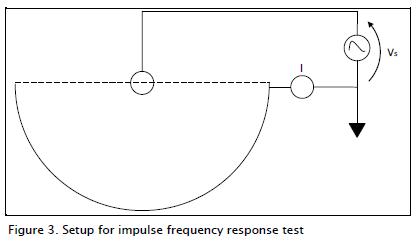
A current probe (Tektronix P6021) was used to measure the circuit current (2mA/1mV sensitivity, 450 Hz to 60 MHz band-width).
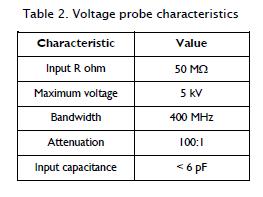
A voltage probe (Lecroy PPE 5kV) was used to measure the impulse voltage. Table 2 shows this probe's average characteristics.
Data
AC frequency response
Voltages were recorded for 36 frequency values ranging from 20 Hz up to 3MHz. This procedure was repeated for the three humidity values; Figure 4 shows 300 kHz voltages when the sample contained 5% distilled water.
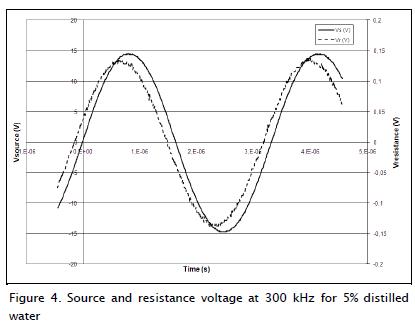
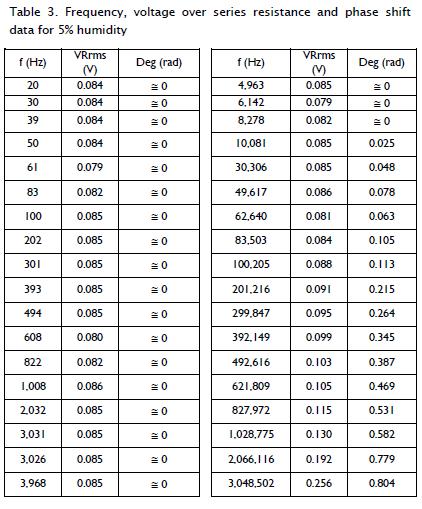
Table 3 compares values for frequency f(Hz), voltage over series resistance VRrms (rms values) and phase shift Deg(rad) between Vs and VR (see Figure 2) for 5% humidity (10% and 15% are not shown in this paper). Source voltage Vs was about 10.2 Vrms.
Impulse frequency response
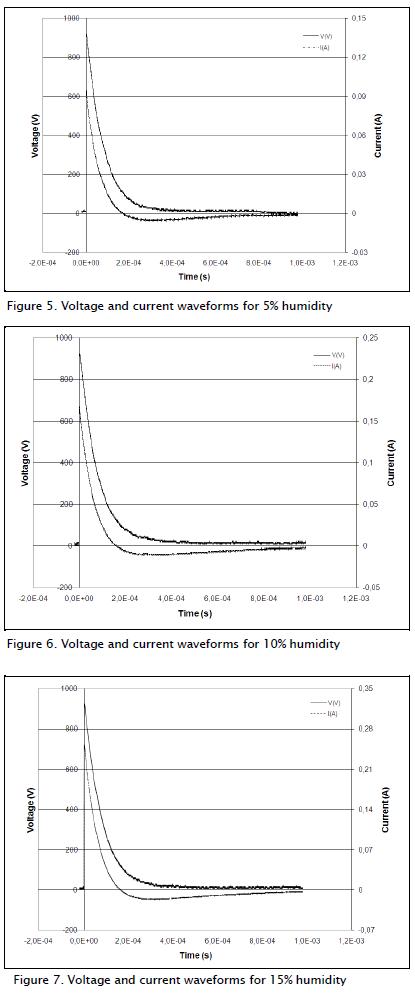
Voltage and current were recorded for three impulses (1kV, 3 kV and 6,6 kV) and for three humidity values (5%, 10% and 15%) to provide enough information for analysis.
Figures 5, 6 and 7 show voltage and current waveforms when Schaffner generator output voltage was fixed at 1kV for the three aforementioned humidity values.
Data analysis
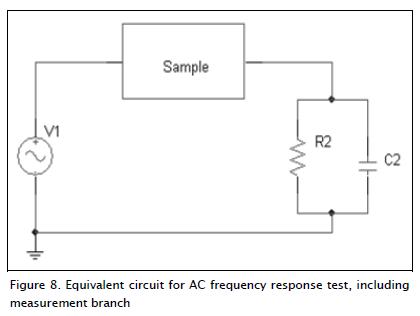
A series resistance was used in the AC frequency response test for computing the current. Figure 8 shows the equivalent circuit representing the setup used here.
V1 was the wave generator, R2 the series resistance used to calculate the current and C2 capacitance between the outer sphere and earth.
The C2 value was computed using ANSYS finite-element soft-ware; capacitance value was 34 pF.
Current and voltage in the impulse frequency response test were measured directly through current and voltage probes (described above). The outer sphere was directly connected to earth; the previous R2/C2 branch was thus not considered in the test.
AC frequency response
Once the data had been recorded, the current from the voltage measured in the R2/C2 parallel branch was computed. Impedance was calculated from the current and voltage over the sample.
Impulse frequency response
Impedance could be computed immediately due to the current and voltage being recorded directly. Voltage and current frequency spectrums were obtained using the fast Fourier transform (FFT) technique.
Figure 9 shows the impedance amplitude found by means of two tests; one was developed at low voltages and specific frequencies and the other at medium voltage involving infinite frequencies.
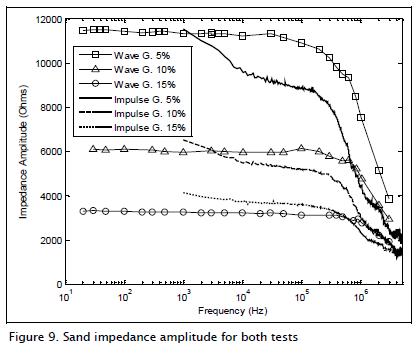
As linearity and superposition were not satisfied in both tests, it was concluded that nonlinear behaviour had taken place during the tests. Nonlinearity was attributed to ionic polarisation on the surface of the test electrodes, as described by Scott and Carroll (Scott and Carroll, 1967) and Nor, Haddad and Griffiths (Nor et al., 2006).
An under peak was seen from current waveforms shown in Figures 5, 6 and 7 which could not be represented by parallel branch C1/R1 in Figure 10; after some simulations it was thus concluded that this under peak could be represented by adding series capacitance.
From the differences shown in Figure 9 and the under peak in the current waveforms, it was concluded that ionisation could be modelled by means of capacitance Cp. The circuit used for computing polarisation and sand parameters is shown in Figure 10. It is very important that capacitance Cp is computed to calculate the correct sand impedance. This model was similar to that presented in Nor, Haddad and Griffiths (Nor et al., 2006).
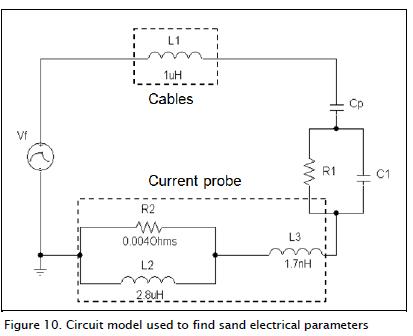
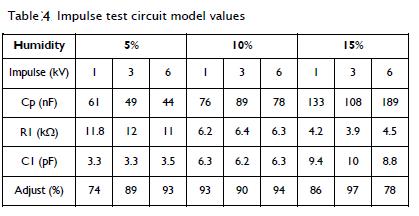
Matlab toolbox system identification was used to find a transfer function F(s) for each voltage (V) and current (I) couple to com-pute R1, C1 and Cp parameters. Table 2 presents the results for three peak voltage values and three humidity values. The item "Adjust" in this table means how transfer function response fit experimental result in terms of percentage.
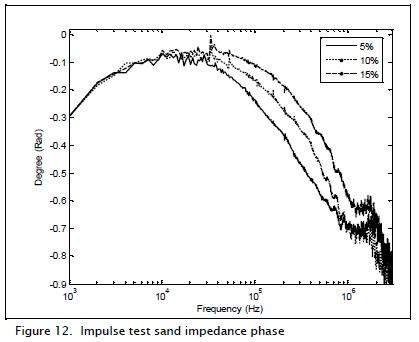
Once the Cp vales had been found, voltage over this capacitance was computed to subtract it from the measured voltage. Polarisation was eliminated from the measurements to compute sand impedance and thus resistivity and permittivity values. Sand impedance magnitude without polarisation is shown in Figure 11 and the phase in Figure 12.

Resistivity and permittivity values
Sand electrical parameters were computed from the results of Figures 11 and 12. Impedance was represented as Re+jIm and the equivalent resistance and capacitance were calculated using (1) and (2):
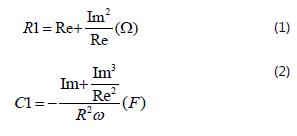
Electrical parameters for sphere-sphere setup were computed using (3) and (4):
where ri and re were the inner and outer radius, respectively.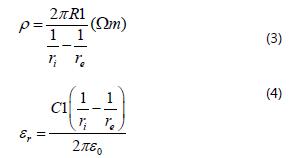
Figures 13 and 14 show impulse test resistivity and permittivity variation, respectively.
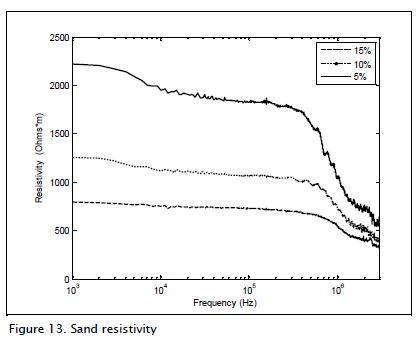

Figures 13 and 14 show sand frequency variation; variations in resistivity values took place for frequencies higher than 100 kHz. The higher the frequency, the lower the resistivity whereas permittivity behaved differently because it became reduced constantly with frequency. Figure 14 shows that permittivity values at low frequency (1 kHz) were higher than values reported in previous work by Grcev (Grcev, 1993) (up to 80) and high frequency (3 MHz) values (around 10).
Although polarisation results have not been presented, it was found that permittivity values for low frequencies were 10 times higher and resistivity values twice higher when polarisation was not eliminated.
AC frequency test permittivity and resistivity values have not been presented because polarisation effects could be eliminated in that experiment. This task is thus proposed for future work.
Conclusion
Recent work has demonstrated that soils' electrical parameters have large variations regarding frequency. This paper has shown the results of two tests for computing resistivity and permittivity values for one type of sand.
Non-linear impedance of sand was found due to ionic polarisation on the surface of test electrodes. This conclusion was reached due to the differences between results from wave generator and impulse generator tests.
Nonlinearity was modelled by means of series capacitance. Ca-pacitance values representing polarisation phenomenon were found for one kind of sand, voltage ranging from 1kV to 6 kV for 5%, 10% and 15% humidity values. Such values have not been presented in previous work and thus represent a contribution to this topic.
After computing capacitance values Cp, the effect of polarisation (voltage over Cp) was eliminated from impedance and resistivity and permittivity were computed. The results showed that resis-tivity and permittivity depended strongly on frequency and humidity.
Future work can use the methodology proposed by Montaña et al., (Montaña et al., 2005), (Montaña, 2006) and Nor, Haddad and Griffiths (Nor et al., 2006) for studying others types of soil and other voltage levels.
References
Grcev L., "More Accurate Modeling of Earthing Systems Transient Behavior," Telecommunication Energy Conference, Intelec'93. 15th, vol. 2, pp. 167-173, 1993. [ Links ]
He J., Gao Y., Zeng R., Zou J., Liang X., Zhang B., Lee J., and Chang S. "Effective length of counterpoise wire under lightning current," IEEE. Trans. Power Del., vol. 20, no. 2, pp. 1585-1591, Apr. 2005. [ Links ]
Liu Y., Theethayi N., Gonzalez R. M., Thottappillil R.. "The residual resistivity in Soil Ionization Region Around grounding System for Different Experimental Results". International Symposium on Electromagnetic Compatibility. IEEE 2003. [ Links ]
Montaña J. "Recommendations for grounding systems in lightning protection systems". Revista Ingeniería e Investigación. Vol 31, No. 2, pp. 5-10, October 2011. [ Links ]
Montaña J., "Grounding system, soil electric parameters variation with frequency and software for computing transient voltages," (in Spanish), PhD. thesis, Universidad Nacional de Colombia, Jun. 2006. [ Links ]
Montaña J.H., Duarte O.G., et al, "Grounding System Modeling in EMTP/ATP. Based on its Frequency Response," IEEE Conference proceedings St. Petersburg Power Tech, Jun. 2005. [ Links ]
Nor N.M., Haddad A., Griffiths H.. "Characterization of Ionization Phenomena in Soil Under fast Impulses". IEEE Transactions on Power Delivery, Vol. 21, No. 1, January 2006. [ Links ]
Portela C., "Frequency and Transient Behavior of Grounding Systems I - Physical and Methodological Aspects" International Symposium on Electromagnetic Compatibility. IEEE 1997. [ Links ]
Portela C., "Frequency and Transient Behavior of Grounding Systems II - Practical Aplication Examples". International Symposium on Electromagnetic Compatibility. IEEE 1997. [ Links ]
Scott J.H. and Carroll R.D., "Dielectric Constant and Electrical Conductivity Measurements of Moist Rock: A New Laboratory Method," Journal of Geophysical Research, vol. 72, no. 20, pp. 5101- 5115, Oct. 1967. [ Links ]
Scott W. R., Smith G. S.. "Measured Electrical Constitutive Parame-ters of Soil as Function of Frequency and Moisture Content". IEEE Transaction on Geoscience and Remote Sensing. Vol. 30, No. 3, May 1992. [ Links ]
Visacro S. and Alipio R., "Frequency dependence of soil parameters: Experimental results, predicting formula and influence on the lightning response of grounding electrodes," IEEE Trans. Power Delivery DOI: 10.1109/TPWRD.2011.2179070 accepted for publication. [ Links ]
Visacro S. and Rosado G., "Response of grounding electrodes to impulsive currents: An experimental evaluation," IEEE Trans. Electromagnetic Compatibility, vol. 51, pp. 161-164, Feb. 2009. [ Links ]
Visacro S., "A comprehensive approach to the grounding response to lightning currents," IEEE Trans. Power Del., vol. 22, no. 1, pp. 381-386, Jan. 2007. [ Links ]
Visacro S., Alipio R., Murta M. Vale H., and Pereira C., "The response of grounding electrodes to lightning currents: the effect of frequency-dependent soil resistivity and permittivity," IEEE Trans. Electromagnetic Compatibility, vol. 53, no. 2, pp. 401-406, May 2011. [ Links ]
Visacro S., Hermoso B., Almeida M. T., Torres H., Loboda M., and Sekioka S., "Final Report of CIGREWGC4.406: The response of grounding electrodes to lightning currents," Electra, no. 246, pp. 18-21, Oct.2009. [ Links ]
Visacro S.F. and Portela C.M., "Investigation of Soil as a Losy Dielectric," ICPADM-8 IEEE International Conference on Properties and Applications of Dielectric Materials Proceedings, Pequin - China, pp. 515-518, Sep. 1988. [ Links ]
Visacro S.F., "Modelagem de Aterramentos Eléctricos," (in Portuguese). Ph.D. Thesys, Federal University of Rio de Janeiro -Brazil, Jul. 1992. [ Links ]

