


Services on Demand
Journal
Article
 English (pdf)
 Article in xml format
 Article references
 Send this article by e-mail
Indicators
-
 Cited by SciELO
 -
 Access statistics
Related links
-
 Cited by Google
 -
 Similars in
SciELO
Similars in
SciELO -
 Similars in Google
Share

 Permalink
Ingeniería e Investigación
Print version ISSN 0120-5609
Ing. Investig. vol.32 no.2 Bogotá May/Aug. 2012
An analysis of distribution transformer failure using the statistical package for the social sciences (SPSS) software
Análisis de fallas en transformadores de distribución utilizando el software estadístico SPSS (Statistical Package for the Social Sciences)
M. G. Mago1, L.Valles2, J. J.Olaya3
1 María Gabriela Mago Ramos. Affiliation: Universidad de Carabobo, Venezuela. Electrical Engineer. MSc Industrial Engineering, MSc Electrical Engineering, E-mail: sremaria@gmail.com
2 Luis Valles Defendine. Affiliation: Universidad de Carabobo, Venezuela. Mechanical engineer. MSc Mechanical Engineering, PhD Engineering, E-mail: le.vallesd@gmail.com
3 Jhon Jairo Olaya Florez. Affiliation: Universidad Nacional de Colombia. Metallurgical Engineer. PhD Engineering, Universidad Nacional Autónoma de México. E-mail: jjolaya@unal.edu.co
ABSTRACT
A methodology was developed for analysing faults in distribution transformers using the statistical package for social sciences (SPSS); it consisted of organising and creating of database regarding failed equipment, incorporating such data into the processing programme and converting all the information into numerical variables to be processed, thereby obtaining descriptive statistics and enabling factor and discriminant analysis. The research was based on information provided by companies in areas served by Corpoelec (Valencia, Venezuela) and Codensa (Bogotá, Colombia).
Keywords: single-phase transformer, descriptive statistics, factor analysis, discriminant analysis.
RESUMEN
Se ha desarrollado una metodología que comprende análisis de fallas en los transformadores de distribución, utilizando el programa estadístico para ciencias sociales (SPSS), para lo cual debe llevarse a cabo lo siguiente: organización y conformación de base de datos de equipos fallados, incorporación de estos datos al programa para su procesamiento y conversión de toda la información adquirida en variables numéricas para que sean procesadas y se obtengan así los resultados de la estadística descriptiva, del análisis factorial y del análisis discriminante. El trabajo se apoyó en información suministrada por empresas cuyas áreas servidas pertenecen a Corpoelec (Valencia-Venezuela) y Codensa (Bogotá).
Palabras clave: transformador monofásico, estadística descriptiva, análisis factorial, análisis discriminante.
Received: June 30th 2011 Accepted: May 11th 2012
Introduction
This paper provides an objective analysis of single-phase trans-former (single-phase oil-immersed distribution transformers) failure using statistical package for social sciences (SPSS) statistical software to sample failed equipment (Tapia 2003) and assess the causes of events originating in industrial sector operations and maintenance areas. Diagnostic tools were used for matching experience and numerical calculations (simplifying complexity to simplicity), representing continuous improvement thereby ena-bling progress in other areas to develop technology delaying probable failure. This research contributes to estimating failed equipment in Venezuela and Colombia, using data-collection instruments used in electricity-gernerating companies to validate this study (Hernández Sampieri et al., 1999).
These types of fault suffered by these transformers can be classi-fied as shown below (Normas para Transformadores de Distribuciòn, CADAFE, 1979):
Thermal occuring when the operating temperature exceeds that set by the manufacturer, causing gradual dielectric oil degrada-tion resulting in medium-term damage to equipment due to an overload;
Arcing occurs when transformer protection fails, resulting in an external short-circuit internally damaging equipment, thereby leaving part of an electric grid unexpectedly out of service; and
Partial discharge involving small electric shocks occuring within gas cavities in a solid or liquid insulating medium. In distribution transformers they are associated with damaging surges in equip-ment isolation.
Statistical concepts
Statistics are not an end but a tool for analysing data; the present study adopted a statistical approach involving, "frequency calculations, fashion, means, standard deviation, variance, maximum and minimum values for each variable" (Mago and Monagas 2004). Statistical analysis of data comprised factor analysis, "to construct hypothetical scenarios or dimensions," and discriminant analysis, "to investigate the differences between individual groups" (Mago and Monagas 2004).
These techniques led to establishing whether a distribution trans-former's geographical location and the climactic conditions in a particular area served would affect probable failure. This would support developing stochastic models reliably endorsing diagnostic expertise (Hoel et al., 1972). The following were thus considered:
Factor analysis for identifying the lowest number of possible factors, a set of variables used to represent the relationship between intercorrelated variables (Mago 2011) as follows:
- The relationship between fault distribution and equipment capability;
- The relationship between fault distribution and year of manufacture, and
- The relationship between failures and the environment or geographical location housing a transformer.
Discriminant analysis for determining which variables best explain group membership (Mago 2011), identifying the purpose of analysis, criteria and independent variables:
- Differentiating characteristics concerning types of distribu-tion transformer failure and peak month of occurrence; and
- Features differentiating types of distribution transformer failure and manufacturers.
Determining failure indices in single-phase distribution transformers
Data-collection instrument
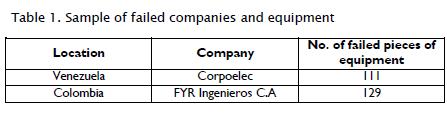
A data-collection instrument was designed for a Venezuelan company that sought general information about failed units such as brand, capacity, voltage level, date of manufacture, reason for replacement, external appearance, description of possible causes of failures, etc. (Mendenhall and Sincich 1997). A Colombian company which provided the information used a similar instrument in its standards and quality procedures which served to collect data in this investigation. Table 1 shows the companies providing information for this study.
Organising and processing information and incorpo-rating data into the statistical program (Venezuela)
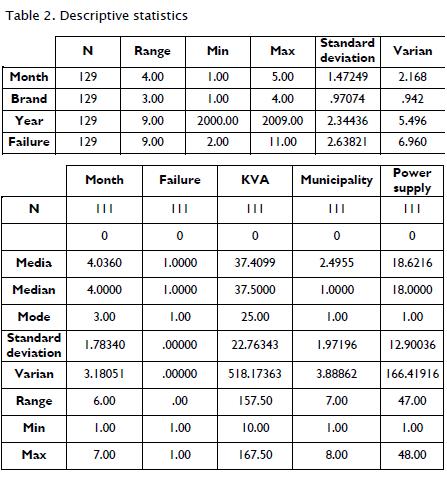
When the database of failed transformers was incorporated into SPSS (version 11.0) for processing, all the information so gath-ered was converted into numerical variables to be processed by the software. Table 2 gives descriptive statistics regarding failed transformer data, showing the number of items of data analysed, valid minimum, maximum, mean, standard deviation, variance, mean, median and mode range of values for each item of infor-mation. The items shown were date of failure occurrence, non-specified equipment failure, capacity, municipality and feed (Miller et al., 1992).
Organising and processing Colombian information and incorporating data into SPSS
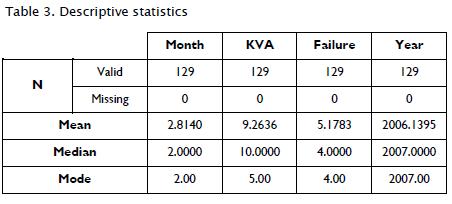
As with Venezuela, once data regarding failed processors had been incorporated, descriptive statistics were used to present the results shown in Table 3 (Mage and Monagas 2004), i.e. the number of items of data analysed, valid, minimums, maximums, averages, standard deviation, variance, mean, median, and mode range of values for each item of information relating to month or date the fault occurred, failed transformer capacity, year of man-ufacture and type of failure.
Results and Discussion
Venezuela
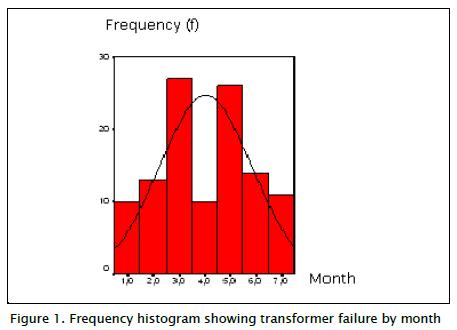
5.1.1. Table 4 shows that the peak month for failure was March (24.3%) followed by May in 2012 (23.4%).

Figure 1 presents a frequency histogram showing that there was a higher failure rate in March and May.
The data collection instruments provided only an indication that a transformer had burned, without specifying any cause of failure.
Table 5 shows the frequencies and percentages reflecting a higher failed transformer rate regarding 25 KVA (27%) and 50 KVA transformers (26.1%).
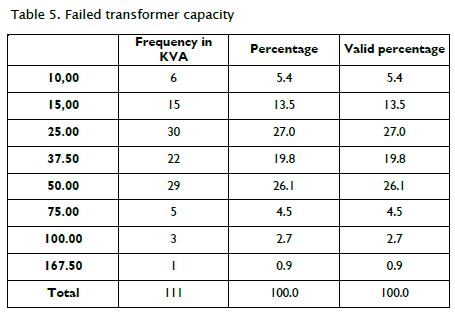
Figure 2 shows checking the frequency histogram and validating the above.
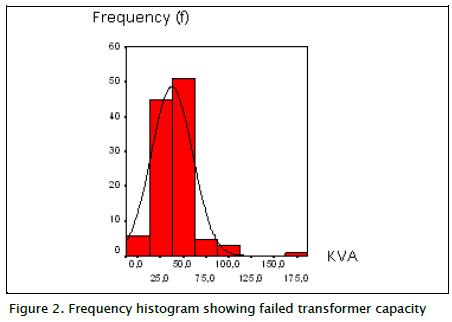
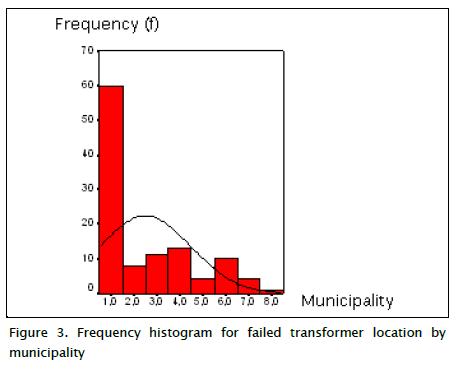
Table 6 shows that Valencia (54.1%) and San Diego (11.7%) had the highest transformer failure rates.
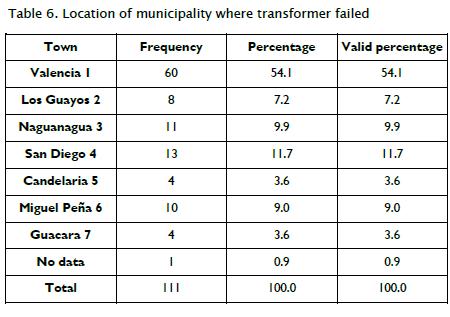
Figure 3 gives a frequency histogram showing greater failure rate in Valencia (54.1%), followed by San Diego (11.7%).
According to the frequency histogram (Figure 4), Cardenera 1 had the highest power supply failure rate (I8.1%), followed by Cardenera II ( 16% not 6.3%).
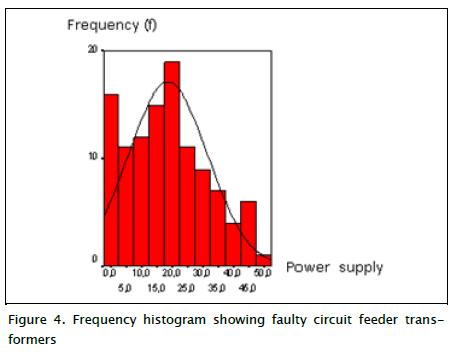
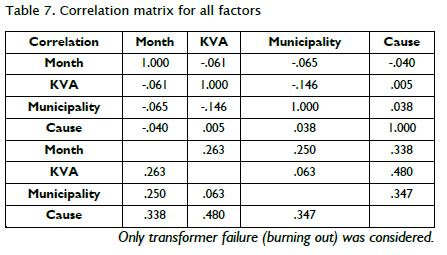
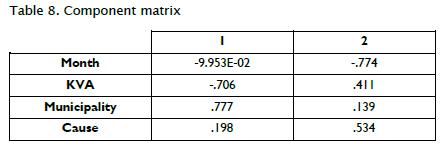
Table 7 gives a correlation matrix for all variables (Miller et al., 1992). Only "municipality" had a greater than 0.70 correlation coefficient (using SPSS for validation) using the extraction meth-od with principal components analysis (other important features could not be correlated).
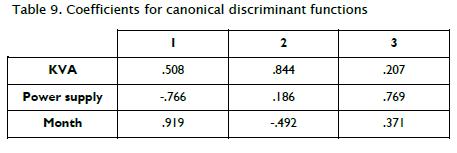
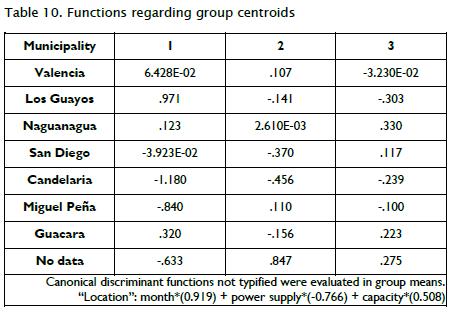
This obtained a function based on all information for predicting the cause of transformer failure according to geographical location. Table 9 shows three discriminant functions identifying the failed transformers and Table 10 shows the functions by i group centroid (Montgomery and Runger 1996, Spiegel et al., 2001).
Colombia
Table 11 shows that May 2010 was the peak month for failures (35.7%).
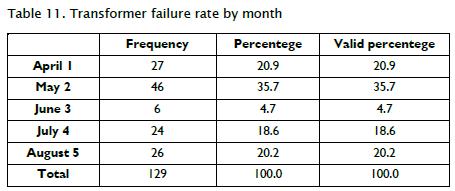
Figure 5 gives a frequency histogram showing greater failure rate in May and quite similar rates for April and August.
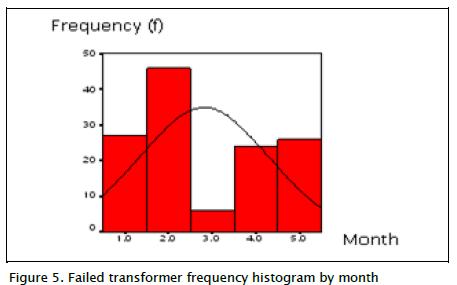
Table 12 shows the highest fault rate occurred in 5 KVA (49.6%) and 10 KVA transformers (26.4%).
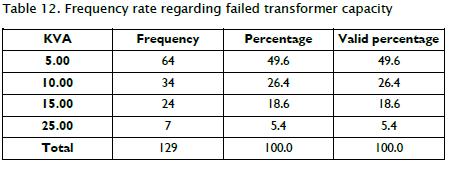
Figure 6 gives a frequency histogram showing a high 5 kVA trans-former failure rate (49.6%), followed by 10 KVA (26.4%) and 15 kVA (18.6%).
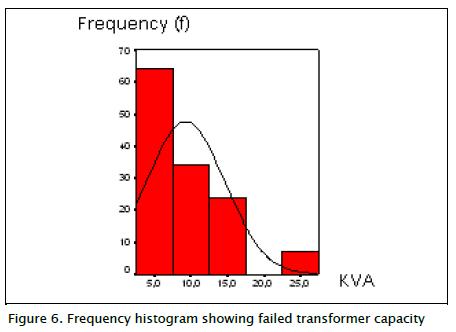
Table 13 shows that the highest failure rate concerned external circuit shorting (72.1%).
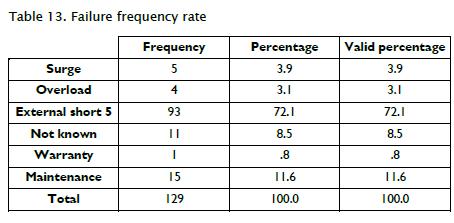
Figure 7 shows a histogram describing failure frequency, external short circuits (72.1%) accounting for most failures.

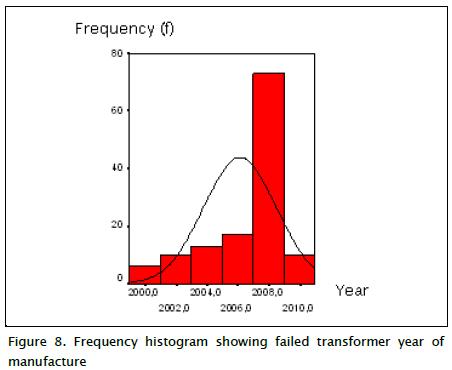
Table 14 shows that 2007 was the year of manufacture having the highest failure rate (36.4%), followed by 2008 (20.2%) and 2006 (10.9%).
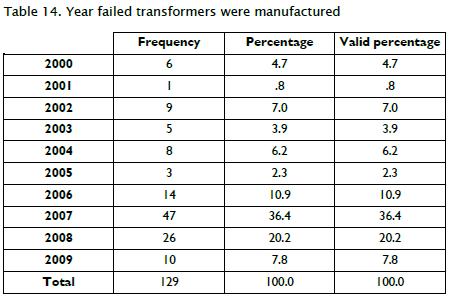
Figure 8 gives a frequency histogram showing that most failures were related to equipment made in 2007.
Factor and discriminant analysis
Table 15 shows the correlation matrix for all variables having coefficients greater than 0.70, using SPSS for validation; principal components analysis extraction method was used (i.e. for "fail-ure"). Table 16 shows this matrix's components.
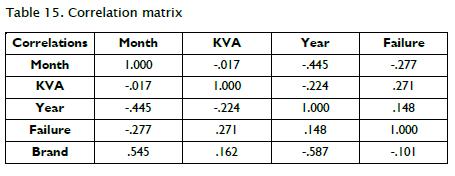
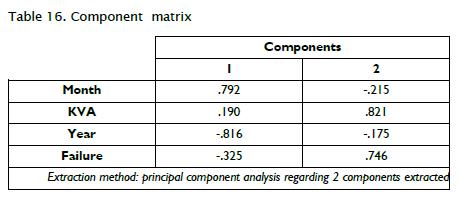
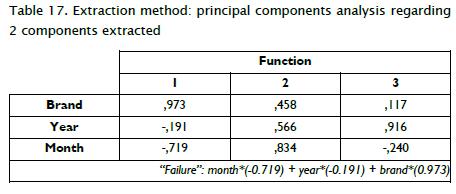
Table 17 shows that three discriminant functions identified a failed transformer.
Conclusions
Venezuela
- Regarding factor analysis: no correlations were statistically significant, except that most burned-out transformers were in Valencia (even though it was not possible to identify transformer capacity, estimated cause, brand or other conditions enabling a statistical evaluation of other elements and correlating variables).
- Regarding discriminant analysis: three discriminant functions identified failed transformers; however, function 1 provided better variance and correlation function (see Table 9), also pre-dicting fault type according to the equipment's geographical location.
Colombia
- Regarding factor analysis:
Peak month for occurrence and year of manufacture for failed transformer correlated
Transformer capacity and type of failure correlated - Regarding discriminant analysis: Three discriminant functions identified failed transformers. However, the feature giving the best variance and correlation function was No. 1 (see Table 17), which also led to predicting equipment failure.
If the variables had had greater discriminating power, one could have accurately determined distribution transformer geographical area and this would have enabled assessing environmental conditions affecting their operation and increasing the probability of failure.
References
Bausela, E. SPSS Un Instrumento de Análisis de Datos Cuantitativas". Universidad de León, España. Revista de Informática Educativa y Medios Audiovisuales. Vol 2 (4). 2005, pp 62-69. [ Links ]
Castañeda, M; Cabrera, A; Navarro, Y; De Vries, W. "Procesamiento de Datos y Análisis Estadísticos Utilizando SPSS". Pontificia Universidade Catolica do Rio Grande do Sul. Brasil. 2010, pp 81-95 [ Links ]
Díaz, C; Batanero, C; Cobo B. "Fiabilidad y Generalizabilidad. Aplicaciones en Evaluación Educativa". Universidad de Granada, Revista del Instituto de Enseñanza Secuandaria de Huétor Vega. Granada, España, 2002, Nro. 54, pp 3-21. [ Links ]
Hernandez Sampieri; Fernández Baptista. "Metodología de la Investigación". 1ª edición. Editorial Mc. Graw- Hills. DF, Mexico, 1999, pp 52 [ Links ]
Hoel, P; Port, S; Stone, C. "Introduction to Stochastic Processes". Universidad de California, Los Angeles. USA,1972, pp 152 [ Links ]
Mago, M. "Análisis de Fallas en Transformadores de Distribución Utilizando Métodos No Convencionales". Area de Estudios de Postgrado. Facultad de Ingeniería. Universidad de Carabobo. Valencia, Venezuela, 2011, pp 126 [ Links ]
Mago, M; MONAGAS E."Fallas Mas Comunes en Los Motores de Inducción de Empresas del Sector Industrial del Edo. Carabobo". Trabajo de ascenso. Escuela de Eléctrica. Facultad de Ingeniería. Universidad de Carabobo. Valencia, Venezuela, 2004, pp 44 [ Links ]
Mago, M. "Casos de Aplicación de Métodos Numéricos en Con-veyor de una Planta Ensambladora de Vehículos". VI Encuentro Colombia Venezuela de Estadística. Facultad Experimental de Ciencia y Tecnología. Universidad de Carabobo. Valencia, Venezuela, 2010, [ Links ]
Mago, M. "Aplicación del Software SPSS para una Caso de Regresión Lineal Simple y Múltiple en una Planta Ensambladora de Vehículos". VII Jornadas de Aplicaciones Matemáticas. Facultad Experimental de Ciencia y Tecnología. Universidad de Carabobo. Valencia, Venezuela, 2008, [ Links ]
Mendenhall W; Sincich T."Probabilidad y Estadística para Ingeniería y Ciencias". 4ta edición. Editorial Prentice Hall. México, 1997, pp 337 [ Links ]
Millar; I- Freud; J-Johnson, R. "Probabilidad y Estadistica para Ingenieros". 4ta edición. Editorial Prentice-Hall Hispanoamericana, S.A. Naucaplan de Juarez, México, 1992, pp 87 [ Links ]
Montgomery; D-Runger, G. "Probabilidad y Estadistica Aplicadas a la Ingenieria". 1ª edición. Editorial Mc Graw-Hill, Interamericana. Mexico, 1996, pp 16 [ Links ]
Normas Para Transformadores de Distribuciòn. CADAFE. Caracas, Venezuela, 1979, pp 12 [ Links ]
Spiegel, M; Schiller,J; Srinivasan, R. "Probabilidad y Estadistica". 2da edición. Editorial Mc Graw-Hill. Bogotá, Colombia, 2001, pp 45 [ Links ]
Tapia, J. "Introducción al Analisis de datos con SPSS para Windows. Colección Docencia Universitaria. Ediciones de la Universidad Ezequiel Zamora, Barinas, Venezuela, 2003, pp 127 [ Links ]
Tinoco, O. "Una aplicación de la prueba chi cuadrado con SPSS". Ind. data. [online]. ene./jun. 2008, vol.11, no.1 [citado 29 Mayo 2012], p.73-77. Disponible en la World Wide Web: <http://www.scielo.org.pe/scielo.php?script=sci_arttext&pid=S1810-99932008000100011&lng=es&nrm=iso>.ISSN1810-9993., 2000. [ Links ]

