


Serviços Personalizados
Journal
Artigo
 Inglês (pdf)
 Artigo em XML
 Referências do artigo
 Enviar este artigo por email
Indicadores
-
 Citado por SciELO
 -
 Acessos
Links relacionados
-
 Citado por Google
 -
 Similares em
SciELO
Similares em
SciELO -
 Similares em Google
Compartilhar

 Permalink
Ingeniería e Investigación
versão impressa ISSN 0120-5609
Ing. Investig. vol.32 no.3 Bogotá dez. 2012
Neyman-Scott-based water distribution network modelling
Modelación de redes de agua potable basado en el proceso de Neyman-Scott
V. H. Alcocer1, V. G. Tzatchkov2
1 Victor Hugo Alcocer Yamanaka. Affiliation: Instituto Mexicano de Tecnología del Agua, México. PhD in Hydraulic Engineering. Universidad Nacional Autónoma de México. E-mail: yamanaka@tlaloc.imta.mx
2 Velitchko G. Tzatchkov. Affiliation: Instituto Mexicano de Tecnología del Agua, México. PhD in Hydraulics, University of Architecture, Civil Engineering and Geo-desy, Sofia, Bulgary. E-mail: velitchk@tlaloc.imta.mx
How to cite: V. H. Alcocer, V. G. Tzatchkov. (2012). Neyman-Scott-based water distribution network modelling. Ingeniería e Investigación. Vol. 32, No. 3. December 2012, pp. 32-36.
ABSTRACT
Residential water demand is one of the most difficult parameters to determine when modelling drinking water distribution networks. It has been proven to be a stochastic process which can be characterised as a series of rectangular pulses having set intensity, duration and frequency. Such parameters can be determined using stochastic models such as the Neyman-Scott rectangular pulse model (NSRPM). NSRPM is based on resolving a non-linear optimisation problem involving theoretical moments of the synthetic demand series (equiprobable) and of the observed moments (field measurements) statistically establishing the measured demand series. NSRPM has been applied to generating local residential demand. However, this model has not been validated for a real distribution network with residential demand aggregation, or compared to traditional methods (which is dealt with here). This paper compares the results of synthetic stochastic demand series (calculated using NSRPM applied to determining pressure and flow rate) to results obtained using traditional simulation methods using the curve of hourly variation in demand and to actual pressure and flow rate measurements. The Humaya sector of Culiacan, Sinaloa, Mexico, was used as study area.
Keywords: Residential water demand, network modeling, Neyman-Scott, Rectangular Pulse (NSRP) model.
RESUMEN
Uno de los parámetros más difíciles de estimar al modelar las redes de distribución de agua potable es el del consumo doméstico. Se ha demostrado que este sigue un proceso estocástico posible de caracterizar a través de pulsos rectangulares, con ciertas intensidad, duración y frecuencia de arribo, por medio de esquemas estocásticos como el modelo de pulsos rectangulares de Neyman-Scott (Neyman-Scott Rectangular Pulses Model, NSRPM. El esquema NSRPM se basa en la solución de un problema de optimización no lineal que involucra momentos teóricos de las series sintéticas (equiprobables) y los momentos observados (mediciones de campo). Se ha publicado la metodología, así como trabajos orientados a la generación de la demanda en los domicilios, sin embargo no su validación en una red de distribución real, con la conjunción y agregación de las demandas de los domicilios, y su comparación con los métodos tradicionales. En el presente artículo se comparan resultados obtenidos empleando series sintéticas con carácter estocástico, producto del esquema NSRPM aplicado a la determinación de presiones y caudales, con los obtenidos por el método tradicional que utiliza curva de variación horaria de la demanda, y con mediciones de presión y caudal hechas en el sector Humaya, en Culiacán, Sinaloa, México.
Palabras clave: Demanda doméstica de agua potable, modelación de redes, método de pulsos rectangulares de Neyman-Scott.
Received: December 6th 2010 Accepted: September 5th 2012
Introduction
Software programs have been developed recently for the de-tailed modelling of drinking water distribution systems' hydraulic behaviour. Residential water demand is one of the hydraulic variables used in such models; it has been idealised as a variable that varies hourly using a smooth hourly demand variation curve (HDVC). The HDVC is used in practically all known public do-main and commercially-available drinking water distribution network modelling software programs (i.e. EPANET, InfoWorks, ScadRED). However, this curve does not accurately reflect reality at residential service level. Residential demand is sporadic, characterised by sudden demand pulses, and tends to have a stochastic nature (Buchberger et al., 2003; Alvisi et al., 2003; Alcocer-Yamanaka, 2007), especially when considering time scales in the order of seconds. Models involving a stochastic focus have thus been recently developed to represent residential water demand, such as the Poisson rectangular pulse (PRP) (Buchberger and Wu 1995; Buchberger et al., 2003) and the Neyman-Scott rectangular pulse models (NSRPM) (Alvisi et al., 2003; Alcocer-Yamanaka et al., 2008). To be applied, the PRP model requires directly registering the instantaneous water demand (with a one-second time interval), whilst the NSRPM considers temporal disaggregation of demand so that different registration time intervals can be used.
These models were primarily applied in the hydrology field to generate synthetic series, representing rainfall or storm events. The demand series so enerated have statistical parameters, such as mean, variance, covariance and probability distribution, which are similar or identical to those of the observed demand series. NSRPM's main advantage is that it can work with different registering time intervals. Estimating parameters and generating synthetic demand series enable minimising the amount of information necessary to model residential water demand.
Application site
Deterministic and stochastic models were applied to the drinking water network in the Humaya sector of the city of Culiacan, Sinaloa, in this study due to the large amount of field data available (Alcocer et al. 2008a; Tzatchkov et al. 2005). The available data included pressure, flow rate and water quality measurement at the supply sources and internal points in the water distribution network, as well as regulation tank water heights. The area has two supply sources; one consists of a single well, yielding an average 51 L/s flow rate, and a group of eight wells having 200 L/s maximum capacity. There are two regulation tanks, one having with a 3,000 m3 capacity (82.63 m above sea level) and the other 2,000 m3 (80.00 m above sea level). The study area's population was estimated to be 85,483 in 2005 at the time the field measurements were made. This figure was based on the number of service connections (20,353) in each suburb and subdivision and the crowding index (4.20 inhabitants/service connection), according to information from the Culiacan Municipal Sewer and Drinking Water Authority. According to local water utility reports, the physical leaks primarily occur at household connections and account for around 30% water loss.
Residential demand measurements were available for 69 homes, having a one-minute time step and three day average period. According to such statistics, this number of homes was equal to the representative sample size for the 20,353 service connections, 95% of them being residential (95% confidence interval, 5% margin of error).
Model used
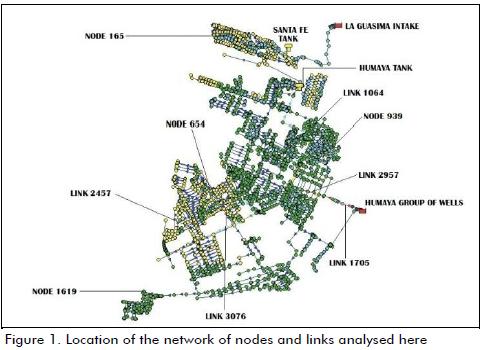
The geometric data for the drinking water supply network, including the diameters of all the pipes (2 to 18 in), were fed into an EPANET programme. The stochastic model used covered one week (168 hours). The results obtained using deterministic and stochastic models were compared to field measurements. Figure 1 shows the location of the nodes and links analysed within the Humaya sector of Culiacan, Sinaloa; however, due to space and time constraints, this work only discusses a few nodes and links.
Deterministic focus: traditional water demand curve
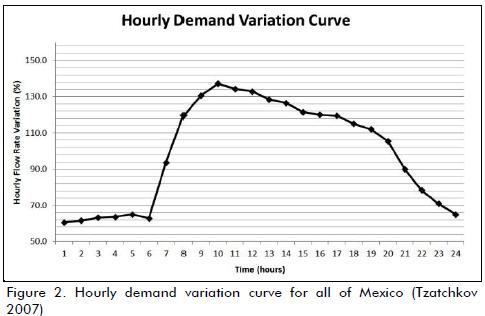
An hourly variation curve is an idealised model of water demand. It was generated by the National Water Commission (Mexico) using measurements of water demand in residential and commercial areas in hydraulically-isolated sectors of some distribution networks called hydrometric districts or district metering areas (DMA) (Figure 2). It should be noted that the methodology used for constructing this curve included users' water demand and leaks within the networks being analysed. The curve was smooth; however, when comparing this curve to continuous measurement of household demand, it was found that the smooth form of this curve did not represent the real situation.
Stochastic focus
Recognising that demand is random has led some researchers (Buchberger and Wu 1995) to propose that demand follows a Poisson process as time elapses; Buchberger et al., (2003) veri-fied this hypothesis. It is not homogeneous because demand varies considerably throughout the day. Each water demand event can be represented as a rectangular pulse whose height represents its intensity and whose width represents its duration. Demand simulation models have been developed recently, allow-ing water demand series to be generated using certain stochastic criteria, i.e. the PRP model (Buchberger et al., 2003). These have been based on the following basic parameters: arrival rate λ (representing individual pulses' mean frequency), the mean intensity of the pulses μx, intensity variance Var(μx), mean pulse duration η and variance of such duration Var(η). Although an PRP model is not limited to one-second time intervals, the parameters needed were obtained by using demand measurements having a one-second time step. One-second time step measurements have the advantage of directly monitoring residential demand's realtime evolution but require the use of sophisticated measurement and data storage equipment. Analysing the data involves a high computational demand (Buchberger et al., 2003). Techniques developed in recent years have been geared towards indirectly estimating parameters λ, μx, Var(μx), η and Var(η) for demand data spanning longer intervals, especially when space and time disaggregation is required (Alcocer-Yamanaka et al., 2008a, 2008b; Alcocer-Yamanaka and Tzatchkov 2009; Guercio et al., 2001; Rodríguez-Iturbe et al., 1984, 1987). Estimating parameters was based on establishing an objective function expressing the relationship between statistical moments in observed data series and the model's theoretical moments. This objective function was minimised through non-linear programming techniques, yielding the desired parameters.
NSRPM has been used to model water demand by Alvisi et al., (2003) and Alcocer-Yamanaka et al., (2008a). A certain number C of internal pulses characterises each event where C is a random number having mean μC . The second-order moments of aggre-gated process Yi(h) were as follows (Entekhabi and Brass, 1990):
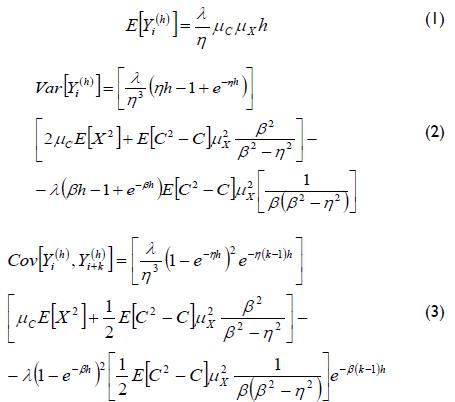
where λ-1 represented the mean time between two events, β-1 was the mean time between each individual pulse and the start of the event, η-1
was mean pulse duration, μx the pulses' mean intensity and h was the analysed aggregation/disaggregation interval.Once the expressions of NSRPM have been defined, the objective function is formulated as:
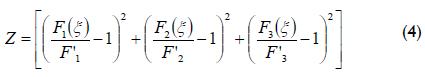
where F1, F2 and F3 were the mean, variance and covariance of the observed values, respectively, being functions of parameter vector ξ = (λ, η, β). These observed moments were directly obtained from the registered field data in their tabular and graphical form (Figure 3).
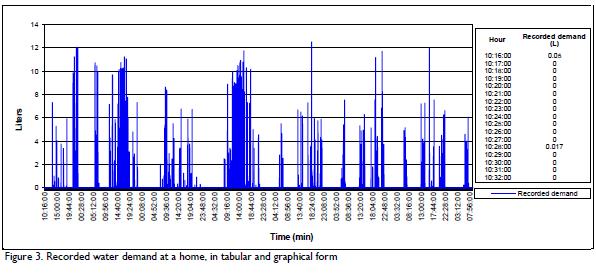
The analysis interval had to be established when formulating NSRPM to implement the optimisation scheme (the time interval was one minute in this study). Next, the objective function was minimised through non-linear mathematical programming. Such minimisation yielded values for each of the model's parameters ( decision variables in the optimisation).
The stochastic patterns so generated had to be randomly assigned to demand at each of the model's node (each node has a different number of houses) to apply NSRPM to a drinking water distribution network. This resulted in introducing demand patterns consisting of 10,080 data points, corresponding to each minute which elapsed during one week. Assigning stochastic patterns must also consider the households' socioeconomic level; households were divided into three groups: lower socioeconomic, middle socioeconomic and upper socioeconomic levels. A separate set of stochastic patterns were generated for each group. The necessary parameters for generating synthetic series for the 69 households was initially determined in which the temporal variation of demand was recorded; 50 synthetic series were subsequently generated for assembling and validation. Assembling meant generating 50 series and calculating the aver-age values for the data's statistical moments. By comparing the observed moments and assembled series' moments for each hourly block, it was determined whether the corresponding synthetic series should be accepted and used in the stochastic simulation model. This established that in cases where the difference between the moments' values (observed and assembled) was large, the synthetic series would not be considered as valid for the analysed pattern, would be discarded, and new series generated. However, when the difference between moments was close to zero, both the process and generated synthetic series were considered valid.
Following this analysis, 69 curves of simulated weeklong (Monday to Sunday) demand patterns were generated and randomly distributed to each household regarding their socioeconomic level. Average demand values were obtained by dividing the records into hourly blocks for the days of the week regarding typical water demand pattern. The records were also divided into business day, weekend and holiday groups.
Generating synthetic series
The statistical parameters {λ, x, μ, C, η, β} involved in the theoretical moments represented in equation 4 (objective function) were determined after observing moments for the households where the measurements had been obtained from field data. These parameters were then introduced into NSRPM.
The series was generated from the public domain model found in the Rainfall Data Modeling Portal (RDMP) (Mellor, 2007). As generating these series was a stochastic event, then a certain number of simulations had to be performed within NSRPM, each using different random number generation seed. The synthetic series obtained with NSRPM were compared to the series obtained in the field for verification purposes.
The calculated parameters were used to generate 50 synthetic series with data every minute, for each eight-hourly block and each of the 69 households. Thus, 27,600 synthetic series were created covering one week's worth of water demand and represented demand patterns for the 69 households analysed. The results obtained from the optimisation, and required by the Neyman-Scott model, have been presented by Hernández (2009). Each of the model's nodes had a number of assigned houses; each house was assigned a stochastic pattern and a mean level of demand based on the number of houses at the node. The demand levels were assigned to the nodes regarding the areas being covered. The assigned demands were obtained from the previously-generated 69 simulated demand patterns. It should be mentioned that the synthetic patterns corresponded to house-hold demand and each simulated pattern corresponding to a particular household provided EPANET input. The 69 synthetic demand patterns were classified into three socioeconomic levels and households within each socioeconomic level were assigned randomly selected demand patterns. Each pattern contained 10,080 pieces of data, representing demand with a one-minute time step and seven-day duration.
Comparing results from the models to field measurements
Pressure and flow rate measurements were taken in the field at various nodes and pipes in the system where the deterministic and stochastic models were applied. Due to space constraints, a limited amount of data is presented in this paper. Figure 4 shows the comparison between measured pressures and those obtained with both models at node 165. The pressure variation in the deterministic model was strictly cyclic, as expected given that base demand was fixed and its pattern was introduced by the HDVC, having 26.00 maximum and 22.00 minimum head meter pressure. Pressure variation was abrupt and high in the field measurements, contrary to the smooth pressure variation predicted by the HDVC model in the stochastic model; however, some values obtained by the stochastic model were much lower than the observed field values.
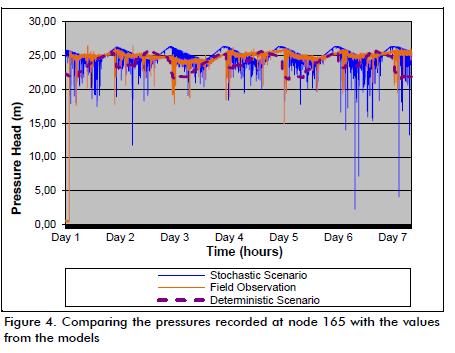
One possible explanation for the abnormally low pressures obtained by the stochastic model was that being an extended period (quasi-dynamic) model, the EPANET model was insufficient to represent highly variable water demand so that a truly dynamic model would have been needed. Such analysis was beyond the scope of this paper, however.
Figure 5 shows the flow rate in link 2957 (supply to a zone in the analysed area) having a 12-inch diameter where one-way flow rates were obtained. Similar to the pressure variation explained before, flow variation in this link was abrupt and high in both the field measurements and the stochastic model. Flow rate and pressure patterns were quite variable in this model. Sudden changes were caused by the random generation of demand patterns. This caused certain instants (in the order of minutes) to have high demand followed by near zero demand in the next minute.
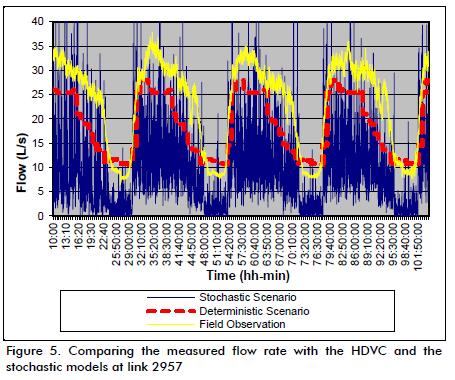
Another advantage of the stochastic model was that it allowed estimating leakage in the network. The HDVC included physical loss and, when compared to direct measurements, it was possible to observe leakage when the HDVC and the mean flow rate were above the curve representing the real level of user water demand.
Conclusions
This paper has demonstrated the application of stochastic concepts to modelling residential water demand patterns. NSRPM was applied to a hydraulic simulation model resembling the measured pressure and flow pattern for a drinking water distribution network, compared to a traditional HDVC approach. The results of this work lay the foundations for a new, simple and practical tool for engineers and researchers designing and maintaining drinking water distribution systems. This model could be implemented by incorporating these methods into a module within commercial and public domain computer programmes such as EPANET.
References
Alcocer, V., Flujo estocástico y transporte en redes de distribución de agua potable, PhD thesis, Universidad Nacional Autónoma de México, 2007, 240 pp. [ Links ]
Alcocer, V., Tzatchkov, V., García, R., Buchberger, S., Arreguín, F., León, T., Modelación estocástica del consumo doméstico empleando el esquema de Neyman-Scott. Ingeniería Hidráulica en México, Vol. XXIII, No. 3, 2008a, pp. 105-121. [ Links ]
Alcocer, V., Tzatchkov, V., Bourguett, V., Desagregación temporal de lecturas acumuladas de consumo de agua potable por medio de métodos estocásticos. INTERCIENCIA, Vol. 33, No. 10, 2008b, pp. 725 - 732. [ Links ]
Alcocer, V., Tzatchkov, V., Estimación de parámetros del consumo doméstico de agua potable de lecturas acumuladas. Ingeniería - Investigación y Desarrollo, Vol. X, No. 3, 2009, pp. 239-248. [ Links ]
Alvisi, S., Franchini, M., and Marinelli, A., A stochastic model for representing drinking water demand at residential level. Water Resources Management, Vol. 17, num 3, 2003, pp. 197-222. [ Links ]
Buchberger, S. and Wu, L., A model for instantaneous residential water demands. Journal of Hydraulics Engineering, ASCE, Vol. 121, No. 3, 1995, pp. 232-246. [ Links ]
Buchberger, S.G. Carter, J.T., Y. Lee and Schade. T.G., Random demands, travel times, and water quality in deadends. AWWA Research Foundation. 2003 [ Links ]
Guercio, R., Magini, R. and Pallavicini, I., Instantaneous residential water demand as stochastic point process. Water Resources Management, Eds. Brebbia et al., WIT Press, 2001, pp. 129-138 [ Links ]
Hernández, D., Pronóstico de la demanda de agua potable, empleando Neyman-Scott, MS Thesis, Universidad Nacional Autónoma de México, 2009, 281 pp. [ Links ]
Entekhabi, D., Bras, R., Parameter estimation and sensitivity analysis for the modified Barlett-Lewis rectangular pulses model of rainfall. Journal of Geophysical Research, Vol. 95, No. D3, 1990, 2093-2100. [ Links ]
Neyman, J. and Scott, E. L., A statistical approach to problems of cosmology. J. Royal Stat. Soc., Ser. B., Vol. 20, 1958, pp. 1-43. [ Links ]
Mellor, D., Generalized Neyman-Scott Model, Version 3.3.1 beta. GNU (General Public License), Free Software Foundation Inc, Cambridge, MA, USA, 2007 [ Links ]
Rodríguez-Iturbe, I., Gupta, V. and Waymire, E., Scale considera-tions in the modeling of temporal rainfall. Water Resources Research, Vol. 20, No. 11, 1984, pp. 1611-1619. [ Links ]
Rodríguez-Iturbe, I., Cox, D. and Isham, V., Some models for rain-fall based on stochastic point process. Proc. R. Soc. London, A 410, 1987, pp. 269-288. [ Links ]
Tzatchkov, V., Alcocer, V., Arreguín, C. F. and Feliciano, G., Medición y caracterización estocástica de la demanda instantánea de agua potable. Ingeniería Hidráulica en México, Vol. XX, No. 1, 2005, pp. 67-76. [ Links ]
Tzatchkov, V., Datos Básicos. Manual de diseño de agua potable, alcantarillado y saneamiento. Comisión Nacional del Agua, Tercera edición, 2007, pp 89. [ Links ]
