


Services on Demand
Journal
Article
 English (pdf)
 Article in xml format
 Article references
 Send this article by e-mail
Indicators
-
 Cited by SciELO
 -
 Access statistics
Related links
-
 Cited by Google
 -
 Similars in
SciELO
Similars in
SciELO -
 Similars in Google
Share

 Permalink
Ingeniería e Investigación
Print version ISSN 0120-5609
Ing. Investig. vol.33 no.1 Bogotá Jan./Apr. 2013
A. Medina-Palomera1, J. M. Montalvá-Subirats2 and A. Hospitaler-Pérez3
1 Amalia Medina Palomera. Ms.C. Sistemas de Procesos de Manufactura, Centro de Enseñanza Técnica y Superior, Mexicali, México. PhD. Engineering and Industrial Innovation Projects, Universidad Politécnica de Valencia, España. Affiliation: Instituto Tecnológico de Mexicali, México. E-mail: amedinapalomera@gmail.com
2 José Miguel Montalvá Subirats. PhD. Industrial Engineer, Construction Engineering and Civil Engineering projects Department, Universitat Politècnica de València, Spain. Affiliation: Dpto. Ingeniería de la Construcción y Proyectos de Ingeniería Civil, Universitat Politécnica de Valencia, Spain. E-mail: jmonsu@cst.upv.es
3 Antonio Hospitaler Pérez. PhD. Industrial Engineer, Universitat Politécnica de Valencia, España. Affiliation: ICITECH Instituto de Ciencia y Tecnología
del Hormigón, Universitat Politècnica de València, Spain. E-mail: ahospitaler@cst.upv.es
How to cite: Medina-Palomera, A., Montalvá-Subirats, J. M. and Hospitaler-Pérez, A., A descriptive analysis of quantitative indices for multi-objective block layout, Ingeniería e Investigación. Vol. 33, No. 1. April 2013, pp. 71 - 75.
ABSTRACT
Layout generation methods provide alternative solutions whose feasibility and quality must be evaluated. Indices must be used to distinguish the feasible solutions (involving different criteria) obtained for block layout to identify s solution's suitability, according to set objectives. This paper provides an accurate and descriptive analysis of the geometric indices used in designing facility layout (during block layout phase). The indices studied here have advantages and disadvantages which should be considered by an analyst before attempting to resolve the facility layout problem. New equations are proposed for measuring geometric indices. The analysis revealed redundant indices and that a minimum number of indices covering overall quality criteria may be used when selecting alternative solutions.
Keywords: Plant layout index, quantitative index, block layout, multi-objective evaluation.
RESUMEN
Los métodos de generación de layouts proporcionan soluciones alternativas que deben ser evaluadas para verificar su factibilidad y calidad. Para poder tomar decisiones sobre su idoneidad, atendiendo a diferentes objetivos, se hace necesario el uso de indicadores que permitan distinguir, las mejores soluciones obtenidas en la fase de diagrama de bloques. En la presente contribución, se realiza una labor de síntesis y análisis descriptivo de los diferentes indicadores aportados por numerosos autores. El análisis deja en evidencia las ventajas y desventajas de cada uno de los indicadores, que deben ser consideradas por el analista antes de la aplicación. Adicionalmente se plantean nuevas formas de cálculo para indicadores de configuración de tipo geométrico. Los resultados del análisis muestran que existen indicadores redundantes y es posible seleccionar un conjunto de indicadores independientes y suficientes, de tal forma que se cumpla con los criterios generales de calidad para la selección de alternativas de solución.
Palabras clave: Indicadores de distribución en planta, indicadores cualitativos, layout de bloques, evaluación multiobjetivo.
Received: July 5th 2011 Accepted: March 6th 2012
Introduction
The facility layout problem (FLP) represents a current issue from the multi-objective point of view for some researchers around the world. This perspective includes fresh solutions which must be compared to obtain the optimum one; such indices should thus be considered in the objective function to be used in optimisation.
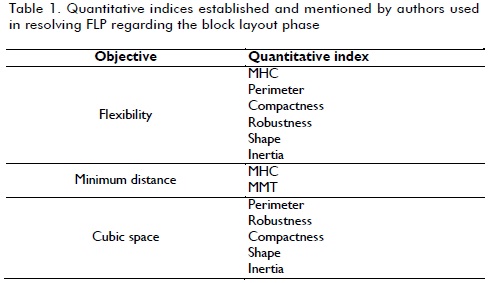
Muther (1968) set out systematic layout planning objectives for good industrial plant layout design covering seven principles: overall integration, minimum distance moved, minimum flow, satisfaction and safety, cubic space and flexibility. These principles have been generally accepted and have been reiterated by Apple (1968), Moore (1971) and Francis and White (1974). Some quantitative indices can be found in the literature for each principle (except movement, safety and satisfaction) (Table 1). Redundancy must thus be detected and the range of options must be analysed for suitable indices to become selected.
The indices used by authors for block layout can be classified into qualitative (obtained through expert judgment) and quantitative (measured physically or geometrically).
Although qualitative indices are relevant, this article focuses on quantitative indices as these can be directly obtained from alternative solutions' spatial characteristics, thereby allowing a solution's quality to become known and current solutions improved through heuristics.
The material handling cost (MHC - a flow index) has been most used in FLP optimisation; it provides a measure of solution quality in terms of cost and is obtained through flow and distance matrices. Such cost may vary when placing great emphasis on activities or if a plant's environmental issues are considered, such as lighting and ventilation, thereby including an additional term (bi) to consider each activity's installation cost. Other authors have resorted to less-used flow indices such as material movement time (MMT) reflecting plant productivity resulting from the speed at which material moves and is calculated as time per unit distance travelled between activities. Lin and Sharp (1999) considered an extensive classification of flow indices, including clearness, space sufficiency, aisle, distance, robustness of equipment and building expansion; however, this is mostly applied to layout analysis regarding specific projects.
Geometrical measurement is important in assessing solution quality as it must be verified whether a solution is really feasible, even if it has shown excellent flow indices; such deviations have been described by Contero (1995), having "sandwich" and "target" settings. Solutions involving some regular shaped (square) activities are those having greater geometrical flexibility as they allow better two dimensional distribution.
Geometrical index analysis
The indices involving geometrical formulation shown in Table 2 are an essential tool for providing efficient solutions; some of the most relevant indices for a discrete domain, with n cells, are listed. Index scope covers activity indices (A) describing a value representing a specific activity's individual quality and configuration indices (C) representing a distribution function's quality regarding all its component activities.
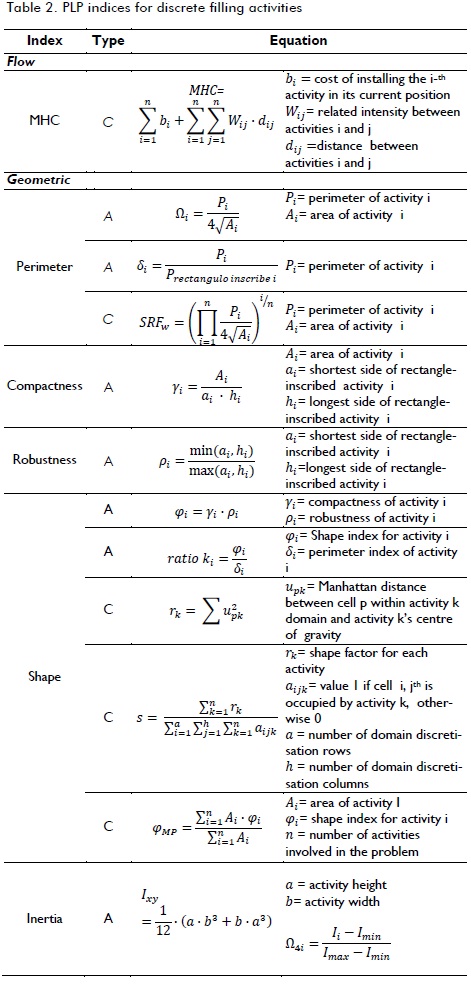
A perimeter index for an activity applied to a plant layout problem (PLP) appeared for the first time in Bozer and Meller (1994); they expressed it as Wi, and it was based on the fact that the larger an activity's perimeter, the less formal quality it would have. This index appeared later on called shape ratio (SR) in Wang, Hu and Ku's work (2005) as a basic part of an overall configuration index. An d index appeared in Lin and Sharp (1999) and was formulated as the ratio between activity perimeter and the perimeter of a boundary rectangle covering it completely. Some C indices have been documented. The shape ratio factor index (SRFwhole) appeared as an overall C index in Wang, Hu and Ku (2005); this is actually the geometric al mean of Wi indices for each activity.
The activity C index has been defined and used in many forms: in Liggett and Mitchell (1981) as coherence ratio, in Moon and McRoberts (1989) as shape rate, in Raoot and Rakshit (1993) as shape ratio, in Contero (1995) as Ω2, in Lin and Sharp (1999) as area ratio and in Gonzalez (2005) as compactness γi. Compactness suggested that the more compact an activity were, the easier would its practical implementation be.
The robust (R) activity index has been defined and used in Liggett and Mitchell (1981) as proportion ratio, in Contero (1995) as Ω3, in Gonzalez (2005) as robustness (ρi) and in Aiello, Enea and Galante (2006) as aspect ratio (γi).
Neither compactness or robustness separately guarantee a solution having high formal quality as some solutions may have good index values but which are not really so. Gonzalez (2005) expressed this by defining a new index combining C and R to maximise the benefits of both, called form of activity (φi), resulting in a measurement overcoming some of the disadvantages of the separate indices. Another form index is the k ratio proposed by Lin and Sharp (1999) combining form index and perimeter index. An original contribution was made by Islier (1998) for whom the configuration form/shape factor was obtained from each activity's rk value. Some form/shape.
C indices have been documented, such as the s factor introduced by Islier (1998) (Table 1) and φMP proposed by Gonzalez (2005) measuring overall C, this being the weighted sum of all forms/shapes of a configuration's activities.
Contero (1995) proposed the inertia index based on an activity's polar moment of inertia as a measurement of the dispersion of the area associated with it. He used the expression polar moment of inertia regarding the centre of gravity for activity Ixy, the normalised value then being calculated to give the geometric quality of activity Ω4.
Development
The large variety of indices mentioned above led to them being studied to identify which were significant, self-sufficient and independent. An analysis was thus made of each index's geometrical characteristics regarding a discrete domain to determine their applicability, alternative ways of calculating some indices being proposed.
Index pattern regarding different scenarios
This study focused on discrete domains involving different activities in several shapes/forms. Table 3 shows each index's current effect for varying the shape of an activity involving nine cells; it shows that perimeter index δi had very low reliability, although solutions to the right of the table were better (δ=1). It would thus be useful in cases of highly degenerate forms of activity. The index was not able to determine whether an activity was accidentally unconnected (Figure 1).
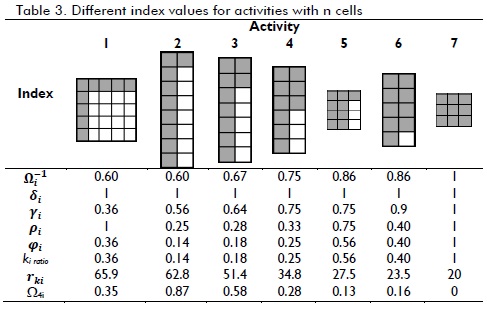
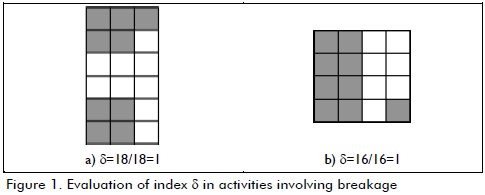
Table 3 shows that the best C index values were those giving γ=1; however, activity involving maximum C value may have had an undesirable shape, i.e. fully-elongated. Bozer and Meller (1994) found the C index less effective than the perimeter index in cases of degenerated geometries obtained by complicated filling curves.
R ρi gave results equal to the optimal index for disrupted distribution (Table 3), suggesting special care when using filling techniques to form complex shapes. Table 3 shows an incongruity; the φ1 and φ6 values were very close; however, their geometrical figures were significantly different. To avoid this, the index was reformulated, penalising configurations in which C was significantly negative by using the following expression: φi(k)=ρ·γk where k was the penalty value. For example, if k = 2, then index values for φ1 and φ6 would have been 0.13 and 0.36, respectively.
k ratio index values were identical to those of the φ index, as a result of dividing the latter by the δ perimeter measurement, which is why the index was significant only for situations where the space filling system led to the formation of extremely degenerated activities.
Index area-dependence
Analysis was aimed at detecting dependence regarding an index and an activity area (number of cells) when a discrete domain was completely filled. The minimum and maximum measurement obtained by an index for activities different to n number of cells (up to 500 cells) had to be met for this study. The minimum value concerned the configuration of an activity having a single column of length equal to the total number (n) of the activity cells. The maximum value of the index due to the number of cells would have been the one coming closest to the square of such activity.
A change in the minimum and maximum limit values, based on the area of activity (n cells), was perceived for perimeter Ωi. It could thus be said that Ωi was an area-dependent index, and its values were not comparable between activities. Given the above, an index independent of activity area was proposed by equation 1, using inverse Ω-1 to maximise the index, 1 being the optimum value:
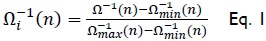
where:
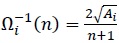
 index value for the best square shape of an activity having n cells
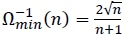 = index value for the most elongated of the activi ties involving n cells
The C index γ was also dependent on activity area and thus indices φ and rk; this pattern would be considered if such indices were selected for a multi-objective study, as activities needing to be located in an enclosure may have different areas.
After examining the activity indices of interest to identify additional configuration indices which could be used to measure solution quality, an additional option for measuring perimeter configuration involved taking an activity index's minimum value in the configuration as its value-index, and thus consider a worst-case scenario Ω-1mini (n) from Ω-1i (n) so obtained. This meas-urement would thus have indicated that any other perimeter regarding said configuration would have been better; the quality of a configuration being evaluated would thereby be determined by a representative value. This logic may be used with other indices: the smaller Cγi, the smaller Rρi, the smaller φi and maximum inertia Ω4iof a particular configuration.
No information was found in the pertinent literature regarding a C, R and inertia configuration index; accordingly, compound configuration indices for the aforementioned ones and the rest of the activity indices (i.e. γMP, ρMP, φMP, ΩMP) were proposed (Table 4), representing activity indices' weighted average value.

Analysis of dependence between indices
Whereas Muther's concept of integration (1968) clearly showed the multi-objective nature of the problem to be solved, it has been represented here by a set of quantitative indices. It was thus evaluated by two or more of the indices listed in Table 2 and 4.
The setting indices were analysed to test each one's self-sufficiency, identifying redundant ones by evaluating different accommodations for different scenarios. A comparative analysis was made between indices resulting from random walking of 25,000 runs for the FW13 benchmark problem in Francis and White (1974). Pairwise comparison of the run results was made using the indices obtained from the 20-activity benchmark problem in Armour and Buffa (1963) for the same number of interactions. The problems mentioned above provided limited information about the issues and only the indices available for calculation were considered.
The FW13 problem involved a problem of locating 13 activities in a 2D space where one of the activities had to remain fixed. Whereas the fixed position of such activity could have been in two preset positions, the results were available for comparing the indices. Pearson's product moment correlation was used to quantify the degree to which to indices were related, i.e. how much one index tended to change when the other one also did so. The following comparative results between indices were obtained. The first one between kmin and φmin had r2=0.997 (Figure 2) and p=0, the second one between KMP and φMP had r2=0.999 and p=0, the third one between ρMP and φMP gave r2 = 0.916 and p=0 and the fourth between ρMP and KMP gave r2 = 0.914 and p=0. There was high correlation in all cases between each pair of indices. The p-value determined the appropriateness of rejecting the null hypothesis; a p-value of less than 0.05 in this analysis meant that the indices were related.

An additional observation concerns the result of identifying the best solutions for each index. The δmax, Ω-1, SRFw, KMP, kmin, ρMP, φmin and φMP indices had the same plant layout as shown in Table 5 for their first two best solutions.
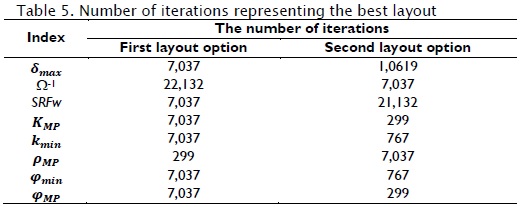
From the foregoing and in view of the high correlation between indices kmin - φmin, KMP - φMP, ρMP - φMP and ρMP - KMP, it would have been excessive to use them all (i.e. many would have been redundant). Therefore, φmin was used in the first pair index because of existing limitations regarding the variable perimeter in index kmin. There was equality amongst the rest of the pairs (KMP, ρMP and φMP). φMP being preferred because it further penalised disintegrated forms.
The measurements representing the weighted average of activity indices concerned an activity's configuration index pattern for maximising the minimum value or vice versa. The difference lay in weighted values involving less dispersion concerning the visual perception of comparisons, thereby making them more suitable.
Additional random walking (again using space filling curves) for the 20-activity PLP proposed by Armour and Buffa agreed with the comments made by Francis and White; it would thus seem probable that such remarks might be generalised.
Conclusions
A great deal of independence or self-sufficiency was found between most indices, including all those proposed here; however, each has its own advantages and disadvantages as outlined in this document. They can guide an analyst in selecting appropriate indices for resolving PLP. An analyst must consider index aspects when selecting them, such as a standardised index's requirements, index variation regarding the size of the areas of the activities to be located, index sensitivity in detecting disjointed or very degenerated areas regarding their shape, besides reliability in detecting unsuitable shapes.
Significant correlation was found for geometrical indices, leading to the reduction of options for indices to determine solution quality from a geometrical perspective.
Acknowledgements
We are indebted to the Mexican Public Education Department's Teacher Improvement Programme (PROMEP) for providing the financial support received for this research.
References
Aiello, G., Enea, M., Galante, G., A multi-objective approach to facility layout problem by genetic search algorithm and Electre method. Robotics and Computer-Integrated Manufacturing, Vol. 22, 2006, pp. 447-455. [ Links ]
Apple, J. M., Plant layout and material handling., 1st ed., Krieger Pub.Co., 1968, pp. 6-19. [ Links ]
Armour, G. C., Buffa, E. S., A heuristic algorithm and simulation approach to the relative location of facilities., Management Science, Vol. 9, 1963, pp. 294-309. [ Links ]
Bozer, Y. A., Meller, R. D., Erlebacher, S. J., An improvement-type layout algorithm for single and multiple-floor facilities., Management Science, Vol. 40, No. 7, July, 1994, pp. 918-932. [ Links ]
Contero, G. M., Contribution to the optimization of the geometric design. Facility layout., a PhD thesis presented at the Universidad Politécnica de Valencia, Valencia, 1995. [ Links ]
Francis, R. L., White, J. A., Facility layout and location, an analytical approach., Englewood Cliffs, New Jersey, Prentice-Hall, Inc., 1974, pp. 134-136. [ Links ]
González, J. L., Contribution to the multi-objective optimization of plant design., a PhD thesis presented at the Universidad Politécnica de Valencia, Valencia, 2005. [ Links ]
Islier, A. A., A genetic algorithm for multiple criteria facility layout design., International Journal of Production Research, Vol. 36, No. 6, 1998, pp. 1549-1569. [ Links ]
Liggett, R. S., Mitchell, W. J., Optimal space planning in Department., Computer Aided Design, Vol. 13, 1981, pp. 277-288. [ Links ]
Lin, L. Ch., Sharp, G. P., Application of the integrated framework for the plant layout evaluation problem., European Journal of Operation Research, Vol. 116, 1999, pp. 118-138. [ Links ]
Malakooti, B., Computer-aided facility layout selection (CAFLAS) with applications to multiple criteria manufacturing planning problems., Large Scale Systems: Theory and Applications, Special Issue of complex Systems Issues in Manufacturing, Vol. 12, 1987, pp. 109-123. [ Links ]
Malakooti, B., D'Souza, G. I., Multiple objective programming for the quadratic assignment problem., International Journal of Production Research, Vol. 25, No. 2, 1987, pp. 285-300. [ Links ]
Moon, G., McRoberts, K. L., Combinational optimization in facility layout., Computers in Engineering, Vol. 17, 1989, pp. 43-48. [ Links ]
Moore, J. M., Computer program evaluates plant layout alternatives., Industrial Engineering, Vol. 21, 1971, pp. 19. [ Links ]
Muther, R., Practical plant layout., 1a ed., New York, United States, McGraw-Hill, 1955, pp. 7-9. [ Links ]
Muther, R., Plannning and projection of the industrial enterprise (Method SLP)., New York, Barcelona, Editores Técnicos Asociados, 1968. [ Links ]
Raman, D., Nagalingam, S. V., Lin, G. C. I., Towards measuring the effectiveness of a facilities layout., Robotics and Computer-Integrated Manufacturing, Vol. 25, 2009, pp. 191-203. [ Links ]
Raoot, A. D., Rakshit, A., An experimental comparison of systematic placement procedures for facility layout design., International Journal of Production Research, Vol. 31, No. 7, 1993, pp. 1735-1756. [ Links ]
Wang, M.-J., Hu, M. H., Ku, M.-Y., A solution to the unequal area facilities layout problem by genetic algorithm., Computers in Industry, Vol. 56, 2005, pp. 207-220. [ Links ]
