


Services on Demand
Journal
Article
 English (pdf)
 Article in xml format
 Article references
 Send this article by e-mail
Indicators
-
 Cited by SciELO
 -
 Access statistics
Related links
-
 Cited by Google
 -
 Similars in
SciELO
Similars in
SciELO -
 Similars in Google
Share

 Permalink
Ingeniería e Investigación
Print version ISSN 0120-5609
Ing. Investig. vol.33 no.2 Bogotá May/Aug. 2013
C. Lefort1 and M. Martinez2
1 Cícero Lefort Borges. BSc in Electrical Engineering, Federal University of Itajubá, Brazil. MSc In Electrical Power Systems, Federal University of Itajubá MG, Brazil. Affiliation: High Voltage Laboratory of the Federal University of Itajubá (LAT-EFEI). E-mail: clefort@div.cefetmg.br
2 Manuel Luís Barreira Martinez. BSc in Electrical Engineering, Federal University of Itajubá MG, Brazil. MSc In Electrical Power Systems, Federal University of Itajubá MG, Brazil. PhD In Hight Voltage, Polytechnique University of São Paulo SP, Brazil. Affiliation: High Voltage Laboratory of the Federal University of Itajubá (LAT-EFEI), Brazil. E-mail: martinez@lat-efei.org.br
How to cite: Lefort, C., Barreira, M. L., Using radio frequency and ultrasonic antennas for inspecting pin-type insulators on medium-voltage overhead distribution lines., Ingeniería e Investigación. Vol. 33, No. 2. August 2013, pp. 63 - 69.
ABSTRACT
This paper summarises the activities undertaken when using antennas (ultrasound and radiofrequency) for identifying insulators in pre-failure state by detecting the noise emitted by the distribution line and correlating this with these insulators (porcelain pin type) dielectric breakdown. This has led to developing low-cost maintenance procedures and providing support and criteria for engineering decisions regarding replacing these insulators. The technique used two detectors; a radio frequency detector was used in a first investigation of a particular distribution line, set to 40 MHz and installed on the roof of a moving vehicle. The ultrasound detector was used for inspecting (phases A, B, C) each structure (pole) selected. Atmospheric conditions had no influence on defining pre-failure insulators (pin type) based on the noise detection technique. Pin type insulators emitting noise should be replaced since measurement was made ??from the ground and near the base of the post.
Keywords: distribution line, inspection, insulator, radiofrequency/ultrasound antenna.
RESUMEN
En este trabajo se presenta un resumen de las actividades realizadas durante el uso de antenas (ultrasonido y radiofrecuencia) para identificar los aisladores en el estado de previsión de fallos, a través de la detección del ruido emitido por la línea de distribución y la correlación con la ruptura dieléctrica de estos aisladores de cerámica (tipo pin). Esto permitió el desarrollo de los procedimientos de mantenimiento de bajo costo, el apoyo y los criterios para las decisiones de ingeniería dirigidas a sustituir estos aisladores. La técnica utiliza dos detectores. Un detector (radiofrecuencia) se utiliza en la primera investigación de la línea de distribución; está ajustado a 40 MHz e instalado en el techo de un vehículo que se mueve. El otro detector (ultrasonido) se utiliza para la inspección (fases A, B, C) de cada estructura (polo) seleccionado. Las condiciones atmosféricas no tienen influencia en la definición de los aisladores (tipo pin) en prefallo, sobre la base de las técnicas de detección de ruido. Por último, se recomienda la sustitución de aisladores (tipo pin) que emiten ruido, ya que la medición se hace de la tierra y cerca de la base del poste.
Palabras clave: líneas de distribución, inspecciones, aisladores, radiofrecuencia, ultrasonidos.
Received: September 13th 2012 Accepted: July 16th 2013
Introduction
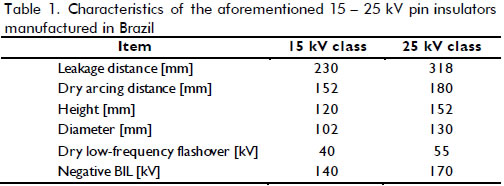
The insulation of medium-voltage distribution lines in Brazil involves the large-scale use of porcelain pin-type insulators, designed for withstanding the voltage stress involved in solid grounded systems. Table 1 shows the main characteristics of the pin-type insulators used in Brazilian medium-voltage lines. The integrity of these insulators is critical for the system's electrical insulation performance and for reducing the system's outage rates. Poor insulation conditions make up 62% of system outages on average, degrading several network performance indexes (e.g. failures/year, mean time between failures, etc.). Due to lengthy construction time, continuous operation and a lack of defined maintenance practices, some utilities often experience a high number of power interruptions, especially during the rainy seasons.
Brazilian utilities tend to substitute standard pin-type insulators for line post-type insulators or a full compact line having covered cables to minimise the possibility of serious accidents and power interruptions occurring (Wareing, 2005). Replacing standard pin-type insulators represents a major technological task involving high costs and, in some cases, difficult implementation. Economically, any maintenance and retrofit policy should calculate the correct number of pin-type insulators prone to failure. This is especially important for adopting resonant grounded systems (Wilheim, Waters and Ruedenber, 1956), a trend considered by some Brazilian utilities to reduce transient fault outages. Low-power frequency withstanding insulators normally fail unnecessarily during rainy seasons (i.e. "Petersen coil" operation) thereby usually increasing the number of line outages. The large amount of overhead distribution lines and pin-type insulators involved in such operation (more than thousands of millions) need field inspection practices based on simple and non-intrusive techniques aimed at reducing utility costs during medium-voltage insulation system retrofit or, more usually, system maintenance.
Current standard periodic inspection uses thermal imaging, but this kind of procedure can only detect heavily damaged insulators, very close to failure, which are often prone to cause accidents, injuring bystanders and maintenance staff. However, a set of phenomena occurring in energised network components, which does not result in a rise in temperature, can indicate the beginning of degradation which may lead to failure. For example, corona and sparking do not cause any substantial temperature rise (Farzaneh and Chisholm, 2009) and so usually cannot be detected by thermal imaging. These phenomena are sources of acoustic and electromagnetic noise which can be detected by acoustic or electromagnetic noise detectors - antennas (Farzaneh and Chisholm, 2009).
Acoustic and electromagnetic noise detectors are simple to use and involve lower cost compared to thermal imaging or mainly corona sets. Nevertheless, as they are normally used for resolving medium-voltage line RI and TVI problems, interference with radio and/or television transmission, there is a strong lack of information correlating field-detected noise level with pin-type insulators' power frequency withstanding capability, this being necessary data for a sound engineering decision during maintenance operations. Therefore, while noise detectors represent an attractive alternative to thermal or corona imaging, their level of effectiveness for large-scale application regarding the inspection of medium-voltage distribution lines had to be investigated in the field and cross-checked in the laboratory. This paper summarises the techniques defined during a four-year research programme carried out by the Federal University of Itajubá and AES Sul (Oliveira et al., 2006; (Oliveira et al., 2008).
Research development
Technology
Pin-type insulators are frequent sources of acoustic and electromagnetic noise (Oliveira et al., 2006; Oliveira et al., 2008). These noise sources can be detected with simple devices designed for inspecting radio and television interference; several field and laboratory tests have shown these devices' potential (Farzaneh and Chisholm, 2009). Noise due to sparking or corona generate ultrasonic and radio waves that propagate along and around the lines and can be detected using properly-tuned antennas. Detection requires a proper technique and an engineering decision criterion needs a good correlation between the noise level threshold and insulator power frequency withstanding capability. The use of ultrasonic and radio frequency sets for inspecting medium-voltage overhead distribution lines is not new (Farzaneh and Chisholm, 2009); however, the efficiency of these devices, acceptable noise levels (threshold limits) and the correlation between medium-voltage insulators' noise and power frequency withstanding capability have not been extensively reported (Farzaneh and Chisholm, 2009).
Sound is a mechanical wave, an oscillation of pressure transmitted through solids, liquids or gases. Insulation sparking results in ultrasonic noise having frequencies higher than the upper limit of human hearing (around 20 kHz). Such noise is attenuated by the distance from a particular source to a detector. Natural ultrasonic noise from a brand new pin-type insulator is not detectable beyond a distance of 8-10 meters, as observed in a set of laboratory experiments (Oliveira et al., 2006). This is a reasonable distance considering the standard medium-voltage pole height, because it enables ground level detection procedures and techniques. A standard ultrasonic noise detector consists of a parabolic antenna and detection electronics converting acoustic noise into an electrical signal or sound within the range of human hearing. These detectors are simple to operate and are highly directional.
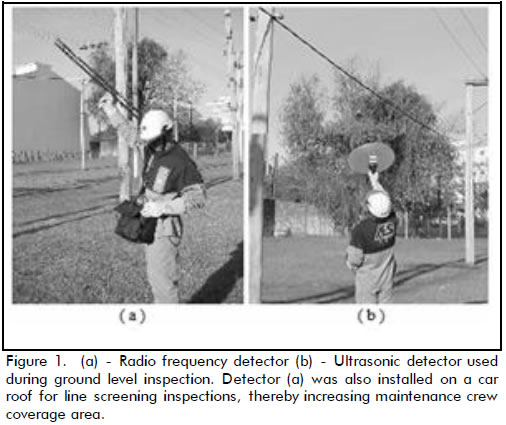
Insulation sparking also results in the emission of electromagnetic waves in the 3 kHz to 300 GHz radio frequency (RF) range. Certain standard RF detectors are tuneable. Field experience has shown that using 40 MHz tuning results in better detection range and efficiency (Oliveira et al., 2006). Using RF detectors is often quite tricky because they usually detect any kind of electromagnetic interference from electromagnetic interference from other sources, such as domestic appliances, motors and the operation of voltage regulators, transformers tap changers, etc. RF detectors are also not directional in the 40 MHz frequency range. Directionality can be improved by increasing the frequency range to 300-350 MHz. Field experience has shown that increasing the frequency range does not increase noise detection efficiency compared to an ultrasonic noise detector, meaning that tuning frequencies above 330 MHz have been avoided.
Figure 1 shows the set of instruments used for field inspection, including RF and ultrasonic noise detectors or antennas.
The research coverage area and methodology
This research was developed jointly by the Federal University of Itajubá's High Voltage Laboratory and AES Sul, Distribuidora Gaúcha de Energia, a power utility in Rio Grande do Sul, Brazil supplying a 99,512 km2 area having 1.146 million customers and a 61,121 km medium-voltage overhead distribution line network.
The research took four years, divided into two field campaigns. The first field campaign (Oliveira et al., 2006) consisted of prospective analysis aimed at verifying inspection antenna efficiency ratio, defining field and laboratory procedures, mainly noise references or threshold levels. In this campaign 6,728 pin-type insulators were analysed: 1,934 units installed on 15 kV voltage systems and 4,794 units on 25 kV voltage systems. The second field campaign (Oliveira et al., 2008) was designed to take into account the influence of weather conditions on results and previously defined procedures; 4,754 pin-type insulators were inspected, 1,129 installed on 15 kV voltage systems and 3,625 units on 25 kV voltage systems. A total of 11,482 units were inspected analysed and removed from the field and replaced by new line post-type insulators during this research.
The line-pole inspections were first based on determining ultrasonic and electromagnetic noise levels from the ground (Oliveira et al., 2006). For aesthetic reasons it was decided to substitute all insulators on a pole presenting a detectable noise; two sets of insulators were thus collected: a noiseless set at first considered to be sound insulators and a noisy set, at first considered prone to failure. Each set was carefully identified, packed in sealed plastic bags to preserve insulator surface condition (some pollutants were probably lost during handling). However, it was observed during handling that the pollution layers were fixed firmly to the insulator surfaces, needing hard work to be removed; pollutant loss was thus not considered a strong drawback regarding the objective of this research.
The electrical laboratory tests were aimed at reproducing some field-operation conditions. The best efforts were thus made during sample handling to preserve insulator surface conditions, as previously commented. However, an engineering decision first assumed that surface pollutants could have a slight impact on the final recommendations, mainly concerning the skills of the maintenance staff dealing with and managing final inspection recommendations and policy.
Laboratory tests started with a visual inspection, since severely damaged, visually punctured or cracked insulators could not be tested (Oliveira et al., 2006). Two voltage withstanding tests (a dry step impulse test and artificial rain power frequency withstanding test) were used on visually undamaged insulators. Both tests intended to simulate normal voltage stress during operation in rainy seasons. Failing in these tests resulted in the set being rejected during type or acceptance tests; this was thus considered proper criterion for classifying sound and prone to failure pin-type insulators.
Several laboratory noise measurements having 10 to 20 µV background noise level were recorded. The goal was to define a correlation between the noise level measured during field inspections and the real noise level in µV or dB (1 µV). The measured noises during inspection and the real noise level was very difficult to correlate during initial field inspections. This procedure was thus abandoned after some partially successful trials. The notation for noise level records - dB (1 µV), used by maintenance staff during the initial field procedures and trials was maintained during the entire research and used to define "noise level". Any correlation concerning real noise value in µV was missed. However, the impact of the absence of such correlation considering the technique used by maintenance staff was not important, as can be observed by inspecting the antenna efficiency ratios.
The distribution feeders to be inspected were selected based on network-feeder low operational performance (i.e. a high number of outages) and surveyed using ultrasonic and electromagnetic antennas. The field inspections also took into account some previously-developed techniques (Oliveira et al., 2006) to increase area coverage. The field inspections were first carried out with a tuneable radio interference detector tuned to 40 MHz - a screening and search operation. The radio interference detector was installed on the roof of a car travelling on roads parallel to the medium-voltage lines. Once an RF noise source had been detected, the car stopped or the location was recorded for further field work. Due to the nature of the noises and their sources, the recorded and adjacent two poles were closely inspected using a hand-operated radio interference antenna or an ultrasonic antenna (Oliveira et al., 2006; Oliveira et al., 2008).
The ultrasonic antenna was preferred by the maintenance crews for close inspection because it was highly directional, providing a clear noise signature. Any necessary confirmation regarding the noise source component was made using a short range antenna detector connected to the end of a reinforced fibreglass rod able to reach every energised part of the pole, i.e. a final and decisive hot line inspection (Oliveira et al., 2006; Oliveira et al., 2008). The inclusion of a screening and search inspection with a tuneable antenna did not increase maintenance operation costs because it could be incorporated into standard field routines, e.g. during crew travelling to replace a blown fuse.
Every detected insulator was sent to the Federal University of Itajubá's High Voltage Laboratory for testing and cross-checking (Oliveira et al., 2006; Oliveira et al., 2008). The pin-type insulators' manufacturer, their year of manufacture, main design characteristics and position in the feeder and on the pole were also recorded for further analysis. No noise was detected by any of the antennas in all further field inspections on the same pole after a noisy pin-type insulator had been replaced, as expected and previously determined during laboratory tests on post line-type insulators.
The last two years of the research considered ground level measurement of relative air humidity, local temperature and wind speed taken at ground level, without any pole height correction factor. Although correction factors for these parameters could have been applied, they were not considered because field procedures are usually carried out by medium-qualified personnel; this was the most practical solution due to its simplicity. The research procedure was mainly designed for determining the noise level limit, defining boundaries between sound and prone to failure insulators, without ignoring the economic and operational impact on utility continuity indexes. More rigorous procedures would not have substantially changed the results reported here.
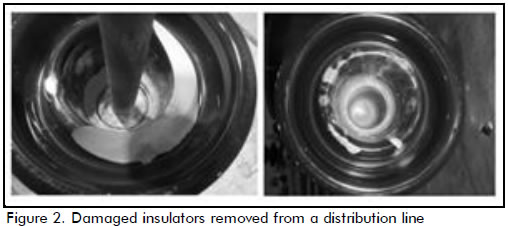
The insulators were submitted to tests in a laboratory, according to NBR 5032 (ABNT, 2004). The first test consisted of screening and classification by visual inspection considering bulk analysis of the samples, checking for imperfections or damage. Units falling outside the visual inspection criteria, like those shown in Figure 2, were not submitted to other tests and discarded.
Step impulse tests were used for verifying whether the insulators were still able to withstand severe electrical impulse stress from lightning; however, they were only used during the early phase of the research (Oliveira et al., 2006). This test was discontinued because a complete absence of standard puncture failure was observed, associated with possible manufacturing improvement. Puncture failure on pin-type insulators was common during step impulse tests in Brazil in the recent past. Much research work had been carried out during the last two decades to resolve puncture failures and it was believed that this was responsible for the observed results. The laboratory high voltage generator specifications limited impulse voltage rise to 1,000 kV/µs; this rate of rise represented low stress for pin-type insulators and was not representative of natural lightning.
The artificial rain power frequency withstanding test was aimed at determining leakage current and verifying the probability of a power frequency flashover, i.e., a power outage during normal operation, combined with poor isolation. Water conductivity of artificial rain was around 100 +/- 15 Wm and rainfall rate was 1 to 2 mm/min for vertical and horizontal components, according to NBR 6936 (ABNT, 1992). Partial flashover may occur during testing when a sample is bridged by a low energy power arc; dielectric strength can be recovered depending on the test circuit and sample condition. Partial flashover was not considered a failure.
The insulators were also tested without removing possible existing pollutants. Although artificial rain withstanding tests are normally used on new and clean samples (ABNT, 1992; ABNT, 2004; IEEE, 1995; Oliveira et al., 2009), the insulators were not cleaned so as to reproduce field operation conditions as close as possible (Oliveira et al., 2006).
Pollution and local weather conditions affected noise measurements in the field, usually increasing recorded noise levels. Their impact, and that of other field influences, was covered by the antenna efficiency ratio. Higher antenna efficiency ratios represented the weak influence of some parameters not considered in the proposed evaluation, such as those related to differences between surface pollution conditions in the field and the laboratory. Such assumption certainly arose from an engineering approach; however, it was extremely useful for maintenance objectives.
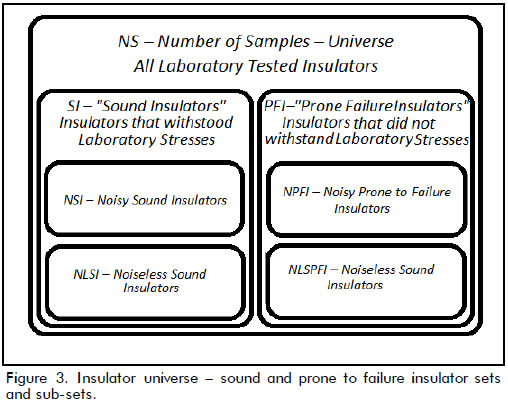
The approach adopted in this research was a very simple statistical and engineering one. The sample universe was populated by all insulators tested in the laboratory. After testing, this set was divided into two sub-sets, one including insulators which withstood the stresses (the sound sample sub-set) the second covered insulators which did not withstand the stresses (the prone to failure insulator sub-set). There were noisy and noiseless insulators in these two sub-sets, where noisy insulator meant a noise recorded during field inspection equal to or higher than a pre-assumed threshold limiting value.
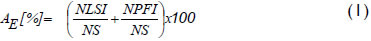
The number of noiseless, sound insulators, divided by the number of insulators withstanding the laboratory stresses added to the number of noisy, prone to failure insulators, divided by the number of insulators that did not withstand laboratory stress gave the antenna efficiency ratio - AE (Oliveira et al., 2006). The complement to 100% was the antenna error ratio. Figure 3 and (1) give a visual sketch of the analysis.
The relationship between antenna efficiency ratio and the number of prone to failure insulators remaining in operation was also used for defining an engineering threshold noise limit between a noisy, prone to failure insulator and a noiseless, sound insulator (Oliveira et al., 2006). The decision criteria for defining the threshold limit in this research considered the association of the highest antenna efficiency ratio and the lowest possible number of prone to failure insulators remaining in operation.
Results and Discussion
Table 2 shows the efficiency ratio of the ultrasonic antenna and inspection procedure during the first two years of this research (Oliveira et al., 2006), where the efficiency of the field inspection techniques and proposed methodology were determined and verified without considering any influence from the weather. There was an antenna efficiency ratio for every noise level which decreased with increased noise level. Tables 2 to 5 address discussion regarding the efficiency ratio for the ultrasonic antenna and the proposed inspection procedure.
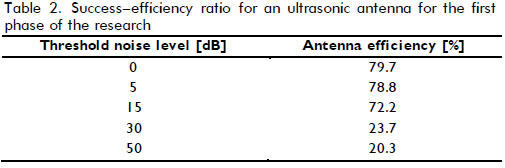
Table 3 gives partial composition of antenna efficiency ratio through positive and negative indications. A positive indication meant the detection of a sound pin-type insulator in the set formed by sound insulators, or a prone to failure pin-type insulator in the set of prone to failure insulators. A negative indication represented an undetected sound pin-type insulator in the set formed by sound insulators, or an undetected prone to failure pin-type insulator in the corresponding set of insulators.
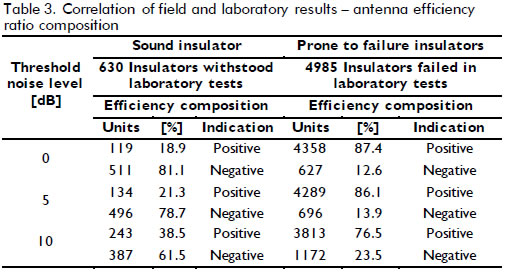
For threshold noise levels from 0 to 10 dB (1 µV), prone to failure insulators had a high positive indication ratio ranging from 90% to 75% which decreased drastically for noise levels above 15 dB (1 µV). The positive indication ratio for sound insulators showed no similar correlation, reaching a maximum 40%. At first sight, a possible source for this discrepancy could have been the influence of weather conditions, suggesting that further work and analysis is necessary. This was dealt with during the last two years of this research.
To verify the influence of the weather, the last two years of the research focused on getting extra data regarding temperature, humidity and wind speed. All rural medium-voltage distribution lines were considered to further expand the area of influence of this research, meaning a coverage area of roughly 90,000 km2.
Maintenance staff also reported that if at least one insulator on one of the distribution feeder poles had any detectable noise then an increase in mean outage frequency during rainy days was verified. This provided good confirmation for the proposed decision criteria. A noisy insulator must be removed from operation once it has been detected; however, this was normally done for RIV or TVI reasons, not poor dielectric performance, as shown in this research.
Every field inspection during the last two years of the field inspection campaign was carried out jointly recording temperature, humidity and wind speed at ground level. For different inspection periods (winter or summer) and the surveyed lines' geographical location, the weather parameters were considered sufficiently random (Oliveira et al., 2008), resulting in a proper evaluation of the influence of seasonal weather variations on field inspection of ceramic pin-type insulators.
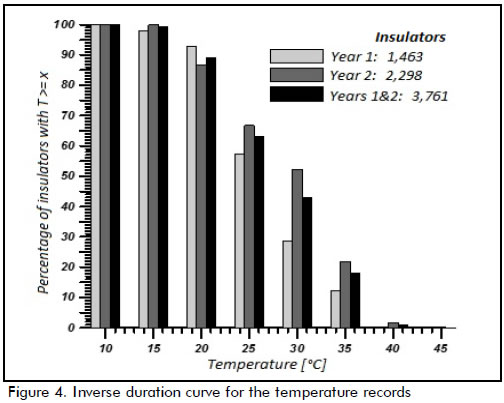
As may be observed in Figure 4, 80% of the field work was carried out within a 20ºC to 35ºC temperature range during the first year of the second field inspection campaign; the temperature ranged from 25ºC to 40ºC during the second year of the second field inspection campaign (i.e. the last year of the research) (Oliveira et al., 2008).
Taking an 80% statistical limit for temperature (ranging from 15ºC to 40ºC), relative humidity (ranging from 20% to 75%) and wind speed (ranging from 0 km/h to 15 km/h) and rejecting any value recorded outside these limits, no apparent influence of the weather was observed on ultrasonic antenna efficiency ratio. Assuming the aforementioned limits for weather conditions adopted in this research, antenna efficiency ratio was 69% for a 0 dB (1µV) noise limit level and only 18% for 50 dB (1µV), such values being close to those shown in Table 4, disregarding the effects of weather.
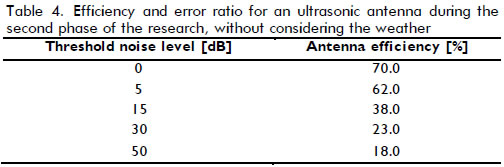
Tables 2 and 4 show that ultrasonic antenna efficiency ratio decreased from 80% to 70% for 0 dB (1µV); this may have reflected on the proposed detection and inspection procedure's efficiency. The antenna efficiency ratios found during the two field inspection campaigns were computed with different quantities of prone to failure and sound insulators which were further weighted by the respective percentages of positive and negative indications. As shown in Table 3, poor performance on detecting sound insulators reduced the antenna efficiency ratio; a larger number of sound insulators in one of the field samples thus resulted in a high impact on the antenna efficiency ratio once sound insulator positive indication was very low. Considering the effect of different numbers of sound insulators between both field campaigns on the antenna efficiency ratio, the differences between Tables 2 and 4 were no more than 5%.
The relative number of insulators with respect to their voltage class may have also explained the differences observed in Tables 2 and 4. The number of 15 kV voltage insulators in the second (last) part of the research was only 58.4% of the previous first set of insulators (Oliveira et al., 2008).
The goal of any line field inspection is to detect prone to failure insulators; by engineering decision, all sound insulators were removed from operation for aesthetic reasons. Therefore, following engineering criterion, it could be assumed that only the prone to failure insulator set should - could be analysed. An analysis of the prone to failure insulator set and ultrasonic antenna efficiency ratio with and without considering the influence of weather conditions is shown in Table 5.
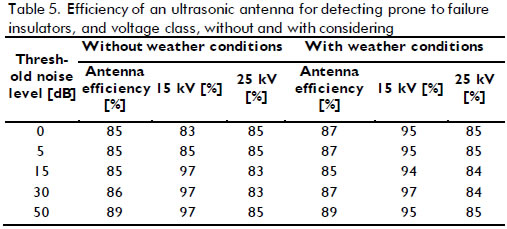
Table 5 clearly shows that weather conditions did not have any meaningful influence on the detection of prone to failure ceramic pin-type insulators. Nevertheless, an analysis considering insulator voltage class showed that weather conditions appeared to play an important role in detecting 15 kV prone to failure insulators. Efficiency ratio increased from 83% to 85% for the 0 dB (1µV) noise level and 95% for the 5 dB (1µV) noise level. The number of 15 kV insulators was very low during the last year of the second field inspection campaign; the reduced number of 15 kV insulators probably accounted for increased efficiency compared to 25 kV insulators. This was attributed to the ratio between increased positive indication and reduced number of samples in the sound insulator set. Background noise also increased with voltage level, which could have further reduced positive indication, as observed for 25 kV voltage insulators (insulator noise is usually well-defined and clearly-detected at lower voltage levels).
Although individual noise measurement of pin-type insulators is affected by weather conditions (as verified by laboratory experiments), the conclusions, obtained from cross-checking noise levels and insulator power frequency withstanding capability in a large insulator data set, suggested that they were not affected by the weather.
The decision for assuming 0 dB (1µV) as the threshold limit for sound compared to prone to failure pin-type insulators was based on three assumptions. Firstly, pin-type insulators are natural noise sources. Normal noise levels are attenuated by distance; therefore, noise levels high enough to be detected at ground level usually means a failure has developed. Secondly, based on performance observations in the field, distribution lines having noise pin-type insulators suffer at least one power outage during rainy days. Thirdly, replacing noisy insulators reduces RF interference, as often observed by people having small AM radio sets.
This research's main conclusion was that any noise detected during a ground inspection by an ultrasonic antenna close to the pole, pointing to a pin-type insulator, was a strong indication of a prone to failure insulator.
Conclusions
The performance of the antennas used in this research could be considered satisfactory for maintenance engineering. Applying this technique to hundreds of thousands of medium-voltage ceramic pin-type insulators improves a utility's costs, reduces system outages and unnecessary investment in system upgrades.
The main contribution of this research has been to correlate noise levels and power frequency withstanding capacity. For practical reasons (and as shown by Tables 2 to 5), the threshold limit for ground level measurement of noise for detecting prone to failure pin-type insulators was between 0 dB (1 µV) and 5 dB (1 µV).
The recommendation for removing any insulator presenting noise measurable from the ground (above 0 dB (1µV)) considered that an increase in threshold limit increased the number of prone to failure insulators remaining in operation, thereby increasing the possibility of system outages or even accidents, involving bystanders or even maintenance staff.
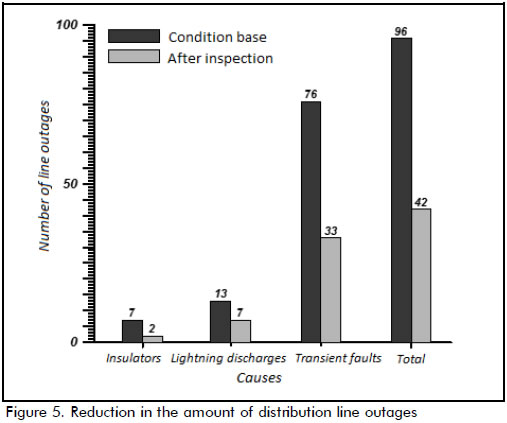
A careful initial analysis indicated a mean reduction of about 50% for line outages due to insulator failure when using this procedure (Figure 5) (Oliveira et al., 2009).
South Brazil's yearly weather conditions, defined within 80% of all temperature measurements (15ºC to 40ºC), relative air humidity (20% to 75%) and wind speed (0 km/h to 15 km/h) did not affect field inspection results regarding using ultrasonic antennas to detect porcelain pin-type insulator failure.
Considering only prone to failure insulators and a 0 dB (1 µV) noise limit level, 85% efficiency was expected regardless of insulator voltage class (i.e. 15 kV or 25 kV).
Using the aforementioned technique and investing US$ 50,000.00 in monitoring equipment, AES Sul equipped 5 local teams to inspect a 99,512 km2 area and a network having 61,121 km of medium-voltage overhead distribution lines, introducing a novel low-cost predictive maintenance technique regarding their medium-voltage networks.
This procedure is also being successfully applied to distribution line inspection, aiming at removing prone to failure pin-type-insulators, to reduce dielectric failures during Petersen coil application start-up - resonant grounding. All these systems are being successful installed in systems initially designed to operate with solid grounded neutrals in Brazil. This new approach has resulted in power frequency over-voltages associated with Petersen coil operation during any phase to ground faults usually resulting in a phase to phase or cross-country fault of a prone to failure insulator which must be avoided to keep network power quality indexes within acceptable limits.
References
ABNT Brazilian National Standard., High-Voltage Testing Techniques, NBR 6936., 1992. [ Links ]
ABNT Brazilian National Standard., Insulators for Overhead Lines with Voltage Levels Higher than 1.000 V - Glass and Porcelain Insulators for AC Systems, NBR 5032., 2004. [ Links ]
Farzaneh, M., Chisholm, W. A., Insulators for Iced and Polluted Environments., Wiley - IEEE Press Series, Chp 6, 2009. [ Links ]
IEEE Standard Techniques for High-Voltage Testing., Std. 4., 1995. [ Links ]
Oliveira, H. R. P., Batista, E. L., Lefort, C., De Salles, C., Martinez, M. L. B., Inspection of Pin Insulators in Distribution Medium Voltage Lines & Outage Reductions., In Proc. 2008 IEEE International Symposium on Electrical Insulation, 2008. [ Links ]
Oliveira, H. R. P., Batista, E. L., Lefort, C., De Salles, C., Martinez, M. L. B., Inspection of Pin Insulators in Medium Voltage Distribution Lines and Outage Reduction., In Proc. 2009 CIRED - 20th International Electricity Conference & Exhibition on Electricity Distribution, 2009. [ Links ]
Oliveira, H. R. P., Pelizan, F., Campos, I. G., Lefort, C., De Salles, C., Martinez, M. L. B., De Oliveira, R. G., Evaluation of the Insulation of 15 kV-25 kV Feeders and Procedures for Substitution of Damaged Units., In Proc. 2006 IEEE International Symposium on Electrical Insulation, 2006. [ Links ]
Wareing, B., Wood Pole Overhead Lines., IEE Power & Energy Series, 48, Chp 9, 2005. [ Links ]
Willheim, R., Waters, M., Ruedenberg, R., Neutral Grounding in High-Voltage Transmission., Elsevier Publishing Company, 1956. [ Links ]
