Services on Demand
Journal
Article
Indicators
-
 Cited by SciELO
 -
 Access statistics
Related links
-
 Cited by Google
 -
 Similars in
SciELO
 -
 Similars in Google
Share
Ingeniería e Investigación
Print version ISSN 0120-5609
Ing. Investig. vol.33 no.2 Bogotá May/Aug. 2013
J. D. Bogoya1 and J. M. Bogoya2
1 José Daniel Bogoya. Ingeniero Químico and Magister en Ingeniería de Sistemas, Universidad Nacional de Colombia, Colombia. Affiliation: Universidad Jorge Tadeo Lozano, Colombia. E-mail: daniel.bogoya@utadeo.edu.co
2 Johan Manuel Bogoya Ramírez. Ingeniería Mecánica and Matemáticas Puras, Universidad de los Andes, Colombia. M.Sc. y Ph.D. en Matemáticas puras, CINVESTAV, México. Affiliation: Pontificia Universidad Javeriana, Colombia. E-mail: jbogoya@javeriana.edu.co
How to cite: Bogoya, J. D., Bogoya, J. M., An academic value-added mathematical model for higher education in Colombia., Ingeniería e Investigación. Vol. 33, No. 2. August 2013, pp. 76 - 81.
ABSTRACT
The concept of academic added-value can be associated with a variation in the cognitive development of students who complete an educational cycle at a given institution belonging to a reference universe, related to the tendency shown by all students in the aforementioned universe. Certain knowledge at the beginning and end of the cycle must be evaluated to estimate such variation. The pertinent literature states that learning is the result of students, teachers, and classmates' intellectual capacity, mainly within the family and an institution. This article proposes an academic value-added linear mathematical model representing a single student and sets of students in Colombia, grouped by institution, in terms of two vectors: learning outcome, regarding standardised national exams at the beginning and end of higher education programmes, and context, estimated as socioeconomic strata.
Keywords: Mathematical model, academic value added effectiveness, higher education, evaluation.
RESUMEN
El concepto de valor académico agregado puede ser asociado con la variación en el desarrollo cognitivo de estudiantes que completaron un ciclo educativo en una institución perteneciente a un universo de referencia, con relación a la tendencia mostrada por todos los individuos del mencionado universo. Para estimar tal variación es necesario evaluar cierto conocimiento al comienzo y final del ciclo. La literatura existente dice que el conocimiento es el resultado de las capacidades intelectuales del estudiante, profesores y compañeros de clase, principalmente en el contexto familiar e institucional. Este trabajo propone un modelo matemático lineal que representa el valor académico agregado en Colombia para el nivel de un estudiante o de un grupo de estudiantes en una institución, en términos de dos vectores: los resultados de exámenes estandarizados a nivel nacional aplicados al comienzo y final de un programa de educación superior, y el contexto estimado como el estrato socioeconómico.
Palabras clave: Modelo Matemático, Valor académico agregado, educación superior, evaluación.
Received: October 22th 2012 Accepted: July 16th 2013
Introduction
The learning outcome of higher education programmes being offered by Colombian universities, involving varied starting conditions and different processes taking place, raises the need for proposing and exploring relationships amongst some variables enabling educational project effectiveness and significance to be identified. These variables represent the influence of the socioeconomic and cultural environment, the students' level of learning at the beginning of their studies and a wide variety of such projects' academic value added elements (Bogoya, 2006, p. N18).
Some such conditions are worth highlighting. The performance of students entering universities is observable in their results in the Colombian standardised exam for senior high school students. The methods and types of classroom practice based on a variety of pedagogical models whose objective is an academic exercise going beyond the classroom. Higher education timetables seek to reduce face-to-face classes and increase autonomous work supported by tutors or academic advisors. Curriculum plans tend to optimise the scope of conceptual and cognitive domain development, including content enabling the foundations of higher education programmes. Evaluation systems enable students' level of learning to be determined at different times regarding educational effectiveness, make necessary adjustments, verify the degree of accomplishment regarding established standards and map students' achievements.
This article proposes a mathematical model representing higher education overall effectiveness in Colombia, viewed as academic added-value. Variables such as input, context, academic added-value and output are defined. Input variable has been estimated using the score obtained by students on the Colombian Higher Education Admission Exam (Saber 11). Students' socioeconomic strata at the end of their university studies was assigned to context, their scores on the Colombian Higher Education Exit Exam (Saber Pro) was assigned to output and the difference between scores on the Saber Pro exam and the value of the national tendency function defined as academic value added effectivess (Bogoya, 2011, p. 32).
Towards a conceptual model
A model regarding the study and evaluation of educational effectiveness considers information from four entities: context, input, process and product. Evaluating context implies identifying and assessing project framework characteristics regarding either an individual or a group concerning a particular programme or institution, anticipating observed strengths and aiming to rectify any detected difficulties. It must be ascertained whether the foreseen goals and priorities are relevant when evaluating context and that they are in accordance with specified needs which must be satisfied. Such evaluation should provide reliable and sufficient information for designing the required adjustments and guaranteeing improvement (Stufflebeam & Shinkfield, 1995, p. 196).
Evaluating input aims at recognising initial conditions, the procedures being used and those which could be used. When evaluating input, every fresh possibility is checked so that it meets established requirements and the most likely paths which would be taken according to a hypothetical benchmarking exercise are defined. The most sensitive differences between the current state of each path and that of a typical one are also outlined (Stufflebeam & Shinkfield, 1995, p. 197).
Verifying the degree of a given plan's fulfilment represents evaluation aimed at providing the main actors and decision-makers with ongoing information in terms of required time, execution opportunities, displayed method quality, the suitability of the people responsible for executing planned activities and the resources used. Evaluation entails structuring arguments for maintaining the initial design or preparing guidelines for making adjustments during such development, whenever corrections of unexpected aspects are necessary, to guarantee that proposed goals are achieved (Stufflebeam & Shinkfield, 1995, p. 199).
Product evaluation consists of interpreting results achieved throughout a project, during different stages of development and the final stage, showing the degree of proposed goal fulfilment and the quality of obtained results. Such evaluation entails comparison with other projects' products in similar contexts and observing project significance. Activity effectiveness can be seen in changes in initial conditions regarding context (Stufflebeam & Shinkfield, 1995, pp. 201-202).
Figure 1 shows the meaning of academic added-value for universities A and B within a set of 116 institutions. It presents the relationship between the students' average scores, grouped by university, on assessment on two different occasions, i.e. at the beginning and end of a higher education programme. The average result of the first assessment is represented on the horizontal axis and that of the second assessment on the vertical axis.
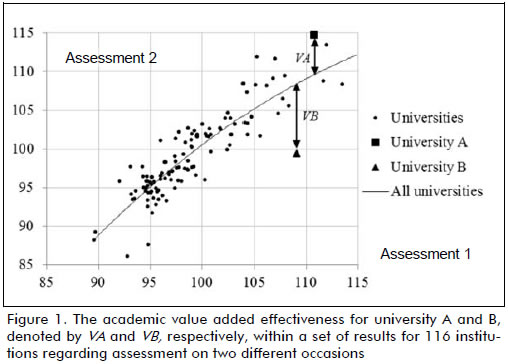
Taking the line of tendency describing average scores for Colombian universities on exams taking place at the beginning and end of a higher education programme as reference, it can be observed that institutions having a low average on the first assessment (Figure 1, left) tended to also have a low average on the second assessment. By contrast, institutions shown on the right maintained high averages on both assessments. Figure 1 also shows that university A was located above the line of tendency, having a higher average score on the second assessment than that traced by the line of tendency and positive academic added-value VA. University B was below the line of tendency because its average result on the second assessment was lower than the value indicated by the reference line, indicating negative academic added-value -VB (Goldstein, 2001, p. 4).
The following relationship for possible aspects intervening in an educational project was proposed for analysing primary schools subsequent to a critical study of the Coleman report (1996):

where Ait was output, i.e. educational performance of student i during time t, Fti individual and family characteristics for student i accumulated during time t, Pti characteristics for the student population (classmate effects) of the institution to which student i belonged, accumulated during time t, Ii initial endowments for student i and Sti school input relevant to student i, accumulated during time t (Hanushek & Kain, 1972, p. 123).
The specified relationship (statistical formulation) allowed estimating explained variance for a response by means of the coefficient value in equation (2), which was found by mathematical regression:

where Ai was output showing the performance of student I, variables Xi1, Xi2,..., Xin estimations of arguments in equation (1) for student I, a1, a2,..., an parameters of educational process, and ei the portion of variance for performance Ai which could not be explained by Xi1 (Hanushek & Kain, 1972, p. 124).
With minor nomenclature modifications, equation (1) was proposed for estimating variation in student performance during a given time, starting at moment t* and ending at t:

where Bi(t-t*) represented change in family influence for student i during period (t-t*), Pi(t-t*) reflected the change in classmate influence for student i during period (t-t*), Pi(t-t*) indicated the change in school input relevant for student i during period (t-t*) and Ii showed natural skills for student i (Hanushek, 1979, pp. 363-364).
Modelling equation (1) by level, academic added-value could be estimated as an indication of teaching quality:

where output value Au indicated educational performance for student i in grade level u, Sφ school factors, Xγ family and context input, θ, φ, and γ unknown parameters, ε a stochastic term expressing unconsidered influences and τj value added for teacher j (Hanushek & Rivkin, 2010, p. 267).
After incorporating fixed and stochastic effects, a general linear mixed model with one association level was proposed,

where output variable γ was observation, γ a known matrix n x p in size, β an unknown fixed-effect vector, Z a known fixed-effect matrix and u and e unobservable random variable vectors (Henderson, 1973, p. 16; Sanders & Horn, 1994, p. 305; Pinheiro & Bates, 2000, p. 58).
An example regarding fixed and stochastic effects on two association levels can be found in an analysis of results in the STAR project (Tennessee Student/Teacher Achievement Ratio experiment) by means of a model summarising kindergarten students' learning in terms of school and family characteristics (see equation 6). If the model were used on two consecutive occasions and a subtraction made, change in output can be found and associated with academic value added effectiveness:

where Yij was output, representing the performance of student i in school j, Sij school characteristics for the school to which student i belonged, Fij family background for student i and εij stochastic error (Krueger, 1997, p. 12).
Another example using initial condition, contributing to discussion of academic added-value models in England aimed at students aged 4 to 16, involved a two-level model (see equation 7):

where Yij was as described in equation (6), xij average score at the beginning of a period as an explanatory variable, u0j the component of unexplained variance corresponding to the school, and e0ij the component of unexplained variance attributed to the student (Ray, 2006, p. 73). In this case, academic value added effectiveness could be estimated by subtraction (Yij - xij).
Mathematical model
Colombia has two mandatory national state examinations; one, called Saber 11, is used on students finishing the high school cycle as a university admission requirement, whereas the second, known as Saber Pro, is used for students finishing the higher education cycle. The results obtained by a student on these two exams enables verifying the validity of an academic value added model.
Students taking a given Saber Pro exam in Colombia were numbered from 1 to n, and the programmes or universities attended by these individuals were numbered from 1 to m; y(i), x1(i) and x2(i) were the results for student i on Saber Pro and Saber 11 exams and his/her socioeconomic stratum, respectively.
The academic value added for a programme was defined as the positive or negative influence of the programme on students' learning when results at two different moments were compared, represented by variables x1 and y, assumed to be related as follows:

where βl, l = 1,2,3 were real constants, v(s) academic value added effectiveness for programme s, f1, f2 continuous functions determining the model's complexity and ε(i) estimated error for student i. For example, the linear model was obtained when f1(x) = x, l= 1,2, i.e.:

Equation (9) was proposed in three steps. The following equation determined the values of βl, l = 1,2,3:

The second step involved defining v(s) as the average of  for the students in each program s, s = 1, ..., m. In the third step, ε was defined as
  (i) - v(s):
x3(i) ≡ 1. Vectors x and β were defined as follows:
The model in equation (10) was thus redefined as:

In an ideal situation ( ≡ 0), the objective would be to calculate vector β, solving n equations in (11). In geometric terms, the problem consisted of calculating the normal for a plane in
  , containing points (x(i), y(i)), i = 1, ..., n.
The real situation would be different: points (x(i), y(i)), i = 1, ..., n were not coplanar. Thus, the objective would be written as an optimisation problem:
||·|| would be the Euclidean norm for  , defined as:

It should be noted that σβ(i) was the distance from point (x(i), y(i)) to the plane passing through the origin determined by normal vector (β,-1).
The function was minimised by following the base of the least square method:

The four partial derivatives of Φ were cancelled to find vector β.
The previous approach involved an algorithm known as multi-lineal regression which can be found as a standard function in most software (Wolfram Mathematica was used here).
Case study
Students' performance on the 2009 Business Administration Saber Pro exam in Colombia was used for evaluating a set of corresponding programmes. Only institutions having 20 or more students were taken into account because of reliability issues. The database used3 reported 120 programmes having these characteristics for a universe of 10,782 students. Equation (9) was used for estimating y.
u(i), i = 1, ..., N was a sample having mean µ and standard deviation σ.

Sample û(i) was thus located on a scale having mean 0 and standard deviation 1; transformation u → û is known as normalisation.
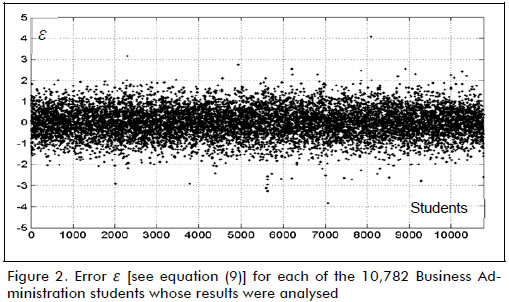
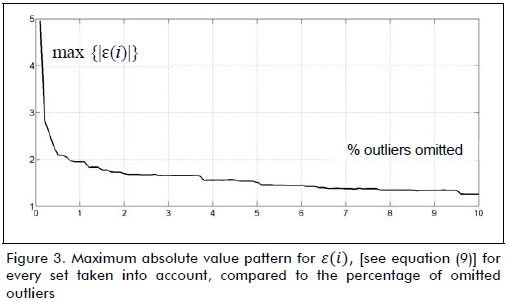
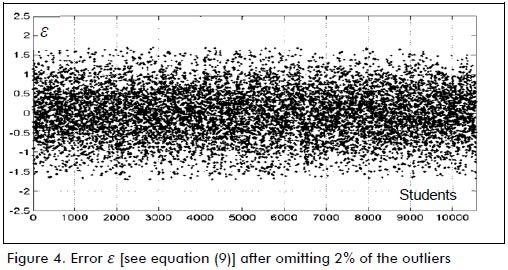
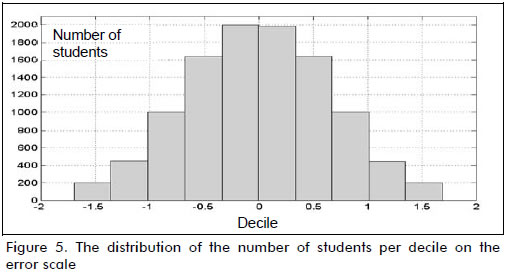
Variables x1, x2 and y were normalised to compare the values of constants βj, j = 1,2,3. Absolute error value ε (see Figure 2) had a maximum of 4.95 and a mean of 0.55 points on a normalised scale. Based on the information in Figure 3, 2% of the data farthest from the line of tendency (equivalent to 216 records) were removed (i.e. the outliers). After data depuration, the absolute error value had a maximum of 1.67 and a mean of 0.52 points (see Figures 4 and 5). The normalised score for 10,566 students on the Saber Pro exam had a minimum of -4.24 and a maximum of 3.68 points; the model in equation (9) predicted the score on this exam having 0.52 mean error, equal to 6.57% of range y. The solution found the following values for the constants:
Quadratic, cubic and exponential models were studied during the course of the investigation, but it was found that these models did not substantially reduce (about a hundredth) lineal model error. Other variables were also included, such as the number of semesters studied, the type of high-school education and the students' gender; however, the results showed these variables to be irrelevant.
Results
Equation w(i) := β1x1(i) + β2x2(i) + β3 was defined [see equation (10)], where w represented the estimated value for variable y (Saber Pro score) according to the model in equation (9). Figure 6 shows the depurated score for the 10,566 students who took the 2009 Business Administration Saber Pro exam (vertical axis) and estimated value w (horizontal axis). The data line of tendency divided the universe of students considered into two sets: individuals whose results were located above the line (having positive academic value added effectiveness because their scores on the Saber Pro were higher than the value estimated by means w) and individuals whose results were below the line (having negative academic value added effectiveness because w estimated a result higher than their actual score). According to the normalised approach, the results for each student were relative to the universe they belonged to.
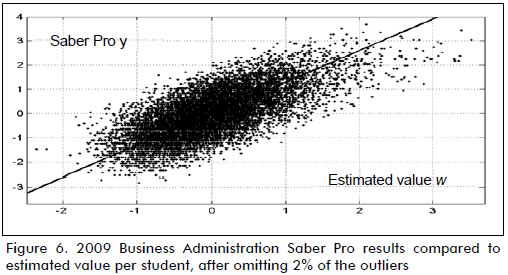
Table 1 shows position and dispersion calculated for y, w and v. Pearson's correlation coefficient between the values for Saber Pro (y) and the corresponding estimated values (w) was 0.71; the line of tendency had a 1.00 slope and 0.00 intercept.

Figure 7 presents the relationship between the average score obtained on the 2009 Business Administration Saber Pro exam by students grouped in each of the 120 considered programmes (vertical axis) and the corresponding average of the values estimated by means of function w (horizontal axis). The line of tendency again divided the universe of programmes into two sets: those above the line were individuals having positive academic value added effectiveness because their actual average was higher than the estimated value and those below the line having negative academic value added effectiveness because their estimated average foresaw a higher value than the average which they actually achieved.
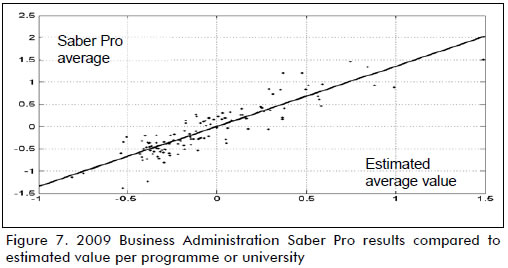
Pearson's correlation coefficient between the average values on the Saber Pro (y) and the corresponding average for the estimated value (w) was 0.90; the line of tendency had a 1.35 slope and 3.24 × 10⁻³ intercept.
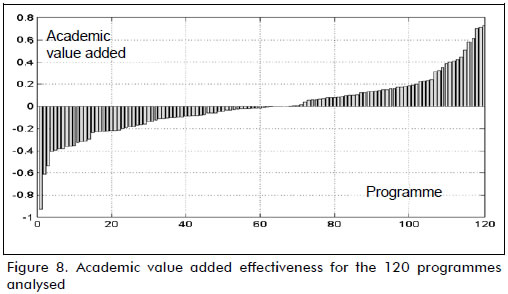
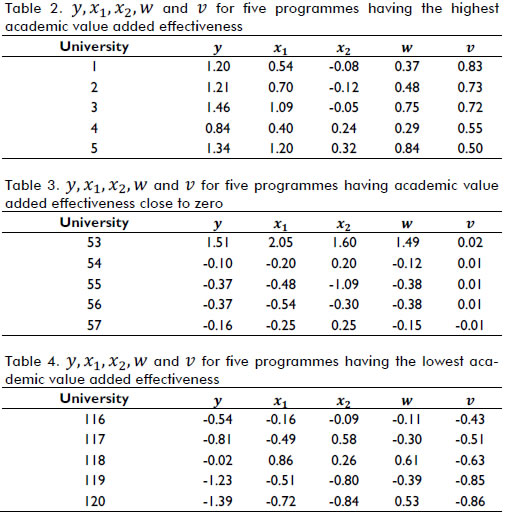
Figure 8 shows the distribution of academic value added effectiveness for the 120 programmes considered in the analysis, arranged in ascending order from left to right, whereas Tables 2, 3 and 4 show the set of values for y, x1,x2,w and v for three groups of five programmes, respectively. The first group had the highest observed value, the second a value close to zero and the third the lowest academic value added effectiveness.
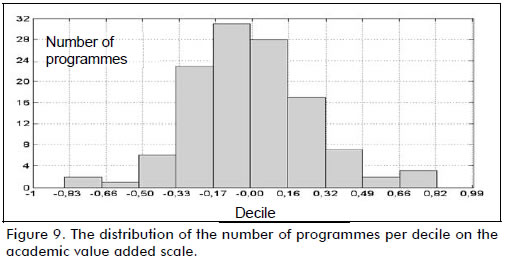
From a different perspective, Figure 9 shows the distribution of the number of programmes per decile on the scale of academic value added effectiveness. Of the 120 Business Administration programmes considered, 99 were located in the middle area, having academic value added effectiveness ranging from -0.33 to 0.32; the programme having the highest academic value added effectiveness ranged from 0.66 to 0.82 and that having the lowest ranged from -0.83 to -0.66 points.
Conclusions
Academic value added effectiveness represents a valuable tool for recognising an educational institution's effectiveness as the students achieve higher average learning results on external standardised exams in relation to the value estimated by the line of tendency describing the universe of institutions considered as reference.
A linear mathematical model involving four variables was developed in the current research for estimating academic value added effectiveness for higher education programmes in Colombia. Two variables established the learning level of students enrolled in a given programme (the first at the beginning and the second at the end of their studies), a third variable incorporated the the students' socioeconomic strata and a fourth covered academic value added effectiveness.
To solve the model and show its application, academic value added effectiveness (v) was calculated for a sample of 10,782 Business Administration students who finished their higher education in Colombia. The data was depurated to 10,566 records; the students were grouped into 120 programmes according to the university they were attending. Student data included score obtained on Saber 11 required for university admission (x1), socioeconomic strata (x1) and score obtained on the 2009 Saber Pro exam (y).
An event's location on a scale was relative to the universe being considered due to the normalised approach adopted in this research. For higher education benchmarking exercises, one programme will be more effective and more significant for student learning than another when the first programme has higher academic value added effectiveness than the second one, provided that identified crucial context variables are controlled.
The values found for constants β1 and β2 were 0.6837 and 0.0526 in the mathematical model. A statistical interpretation based on data from the sample of 10,782 students showed that variable x1 (Saber 11) was more powerful (13 times more) in explaining variance for variable y (Saber Pro) than variable x1 (socioeconomic strata).
3The public database at ftp://ftp.icfes.gov.co was used.
References
Bogoya, D., Evaluación Educativa en Colombia., Seminario Internacional de Evaluación, Cartagena, ICFES, 2006, pp. N1-N27. [ Links ]
Bogoya, D., Impacto académico de la Facultad de Ingeniería de la Universidad Nacional de Colombia - Sede Bogotá., Ingeniería e Investigación, Vol. 31, 2011, pp. 29-39. [ Links ]
Coleman, J. S., Campbell, E. Q., Hobson, C. F., McPartland, J., Mood, A. M., Weinfeld, F. D., York, R. L., Equality of Educational Opportunity., Washington DC, US Government Printing Office, 1996. [ Links ]
Goldstein, H., League Tables and Schooling., Science in Parliament, Vol. 58, No. 2, 2001, pp. 4-5. [ Links ]
Hanushek, E. A., Kain, J. F., On the Value of Equality of Educational Opportunity as a Guide to Public Policy. En: Mosteller, F., Moynihan, D. P., (eds.), On Equality of Educational Opportunity., New York, Random House, 1972. [ Links ]
Hanushek, E. A., Conceptual and Empirical Issues in the Estimation of Educational Production Functions., The Journal of Human Resources, Vol. 14, 1979, pp. 351-388. [ Links ]
Hanushek, E. A., Rivkin, S. G., Generalizations about Using Value-Added Measures of Teacher Quality., American Economics Review: Papers & Proceedings, Vol. 100, 2010, pp. 267-271. [ Links ]
Henderson, C. R., Sire Evaluation and Genetic Trends., Journal of Animal Science, Vol. 10, No. 41, 1973. [ Links ]
Krueger, A. B., Experimental Estimates of Education Production Functions., Industrial Relations Section Working Paper, No. 379, Princeton, Princeton University, 1997. [ Links ]
Pinheiro, J. C., Bates, D. M., Mixed Effects Models in S and S-Plus., Secaucus, Springer, 2000. [ Links ]
Ray, A., School Value Added Measures in England., A paper for the OECD Project on the Development of Value-Added Models in Education Systems. 2006. [ Links ]
Sanders, W. L., Horn, S. P., The Tennessee Value-Added Assessment System (TVAAS): Mixed-Model Methodology in Educational Assessment., Journal of Personnel Evaluation in Education, Vol. 8, 1994, pp. 299-311. [ Links ]
Stufflebeam, D., Shinkfield, A., Evaluación sistemática - Guía teórica y práctica., Barcelona, Ediciones Paidós, 1995. [ Links ]


