


Services on Demand
Journal
Article
 English (pdf)
 Article in xml format
 Article references
 Send this article by e-mail
Indicators
-
 Cited by SciELO
 -
 Access statistics
Related links
-
 Cited by Google
 -
 Similars in
SciELO
Similars in
SciELO -
 Similars in Google
Share

 Permalink
Ingeniería e Investigación
Print version ISSN 0120-5609
Ing. Investig. vol.34 no.3 Bogotá Set./Dec. 2014
https://doi.org/0.15446/ing.investig.v34n3.43245
DOI: http://dx.doi.org/10.15446/ing.investig.v34n3.43245
R. Culagovski1, M. Greene2 and R. Mora3
1 Rodrigo Culagovski. Architect, M. Sc. Arch. PUC, Chile. Affilliation: Pontificia Universidad Católica de Chile, Chile. E-mail: rculagovski@uc.cl
2 Margarita Greene. Affilliation: Pontificia Universidad Católica de Chile, Chile. E-mail: mgreenez@uc.cl
3 Rodrigo Mora. Affilliation: Universidad Diego Portales, Chile. E-mail: rodrigo.mora@udp.cl
How to cite: Culagovski, R., Greene, M., & Mora, R. (2014). Development of 3D VGA tools: an application in a case of weak heritage in Valparaiso, Chile. Ingeniería e Investigación, 34(3), 31-36.
ABSTRACT
In the last ten years, isovist analysis has emerged as a fundamental method for reflecting a person's visual experience in cities and buildings. However, until now, most studies have used a two-dimensional planar perspective, neglecting the three-dimensional nature of vision. This paper presents a method to construct 3D isovists that give a more realistic account of a person's visual experience in hilly urban scenarios where a person can see places that are not directly accessible. The paper aims to contribute to the construction of objective methods to represent the environment in a more ecological way.
The method was tested in the city of Valparaiso, a heritage city that spreads across thirty hills forming a natural amphitheater and whose charm comes largely from the visual experience that arises from observing distant parts of the city that are not directly accessible. The results show that three-dimensional isovists are capable of capturing the underlying visual properties of ravines and urban viewpoints in Valparaiso.
Keywords: 3D Isovist analysis, visual experience, Valparaiso.
RESUMEN
En los últimos diez años el análisis de campos visuales, también conocido como análisis de isovistas, ha surgido como una herramienta fundamental para representar la experiencia visual de una persona, al moverse en las ciudades y los edificios. Sin embargo, hasta ahora la mayoría de las aproximaciones ocupan un enfoque en el que los campos visuales son mostrados de forma bi-dimensional, soslayando la naturaleza tri-dimensional de la visión. Este escrito, presenta un método para construir isovistas en tres dimensiones; la idea es dar una visión más realista de la experiencia visual de una persona, en entornos urbanos con abruptos cambios de nivel (como las ciudades construidas en colinas, por ejemplo), donde es posible ver lugares difíciles de alcanzar directamente.
El método fue probado en la ciudad de Valparaiso: sitio urbano patromonial, caracterizado por disponerse sobre treinta cerros que forman un anfiteatro natural y cuyo encanto reside, en buena medida, por la experiencia visual que emana al mirar la ciudad desde los cerros. Los resultados muestran que las isovistas en tres dimensiones, son capaces de capturar las propiedades visuales subyacentes de las quebradas y los miradores.
Palabras clave: isovistas 3D, experiencia visual y Valparaiso.
Received: April 30th 2014 Accepted: July 3rd 2014
Introduction
A brief review of isovist analysis.
Although the term isovist was first mentioned in the work of Tandy (1967), the concept has more in common with the work of Gibson (1950; Gibson 1979) and his idea of "visual flows." Gibson, an American psychologist preoccupied with the way in which the environment is visually perceived by people, posed a fundamental question: how do individuals form a unified version of the world if they only see partial images of it?
Gibson responded to this question in an elegant way. He suggested that although people have a partial view of the environment (i.e., what he called "the visual field of the area potentially observable by an individual's eyes"), motion allows them to infer the stability of the external world. As humans move, Gibson said, the visual field constantly shrinks and expands, reflecting the fact that opaque barriers appear and disappear from a person's retinal image. To form a unified and plausible representation of the world, a subject has to make inferences and to imagine the surfaces and objects disappearing from view. This would permit a person to detect "the invariant structure of the house, the town, or the whole habitat" (Gibson 1979:198).
Gibson's ideas were highly influential on the work of Benedikt (1979), who simplified them to construct his conception of an isovist. Defined as the "set of all points visible from a given vantage point in space and with respect to an environment" (Benedikt 1979:47), an isovist can be understood as a planar description of Gibson's idea of field of view without the inclusion of vertical dimension. Figure 1 shows an example of an isovist.
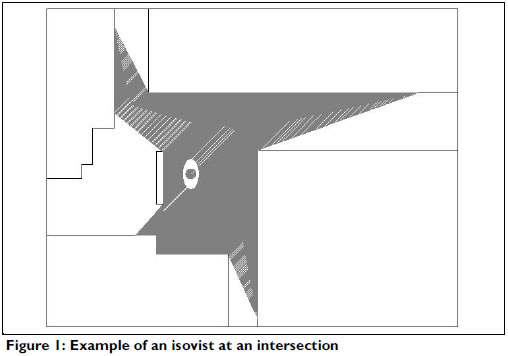
Normally traced at eye-level, isovists were conceived as a way to depict how the world is visually perceived in an objective manner. "An observer's perception is thus circumscribed, if not determined, by the environment-as-presented at the point of observation. A cumulative understanding of the form of the environment is arrived at by perceiving variants and invariants in the transformation of the information available caused by the observer's movement " (Benedikt 1979:48).
During the last twenty years, a growing number of researchers have used this technique to assess the visual properties of spatial layouts. Batty (2001), for example, suggested that isovist analysis sheds light on two of the fundamental aspects of visual perception: how much and how far an individual can see in an environment. He used isovist analysis to study these properties at three scales of the built environment: building, neighborhood and an entire village. Like Benedikt, he discovered that isovist analysis could not only picture the visual affordances of each of these environments, but it could also inform an external viewer on the visual experience of a person navigating. Concordant with Batty, Conroy-Dalton (Conroy-Dalton 2001; 2007) has shown that people tend to intuitively navigate along well-connected routes of ample and extended isovists and that pauses are likely to occur at places with large and "spiky" isovists.
Turner and Penn (2002) showed that isovist analysis can be used to predict people's movement patterns in indoor environments (i.e., Tate Britain in London). Peponis et al. (2004), working on exhibition halls, showed that artifacts more visually connected to other artifacts received more attention (and hence, more visits) than those with lower degrees of visibility. Chang and Penn (1998) conversely found that the length of an isovist was a reliable predictor of people's navigational performances in a multilevel building.
Turner (2003) employed isovist analysis in a popular area of London, revealing that visual properties of space could also predict dynamic occupancy of streets. Similar results have been found byCampos de Arruda (Campos 1997), who observed static occupancy patterns in twelve city blocks in London. She noted that the rate of static occupancy was inversely related to how much these spaces could be seen from different places, meaning that highly exposed places were generally avoided while people tend to choose secluded locations for static use.
In an attempt to explain the role of visual perception on human locomotion, Penn and Turner (2001) have developed virtual agents provided with a simple stochastic architecture whose unique input is to retrieve the visual properties of space. Although virtual agents navigate the environment purely guided by its visual properties and lack any intentionality, they could robustly reflect how people move in real-world scenarios. "The agent can infer the affordances of the environment, or at least information on the global spatial relations visible from their current position in the environment" (Penn and Turner 2001:105).
Two German psychologists (Wiener and Franz 2005; Wiener, Franz et al. 2007) have recently undertaken a set of virtual experiments using isovist analysis as a means to disclose subjective valuation of space. In the first of these experiments, Wiener and Franz (2005) constructed sixteen virtual rooms resembling art galleries. They then asked people to freely explore the environments at their own pace to become accustomed to them. Subjects were then instructed to go to what they thought were the most exposed and concealed places of the rooms. Wiener and Franz then examined people's choices according to their visual characteristics, discovering that individuals were highly effective in detecting both the most exposed and secluded locations of the different layouts.
In another experiment Wiener and Franz (2007) asked subjects to navigate in virtual rooms of different shapes (and hence, of different isovist characteristics) and then to describe these rooms according to a protocol. They found that qualitative valuation of scenes was highly related to certain isovist properties, specifically to what the authors called an isovist "complexity," which was based on an isovist's area and perimeter. Mora et al. (2014), conversely, have shown an isovist measurement such as drift is a predictor of urban flows.
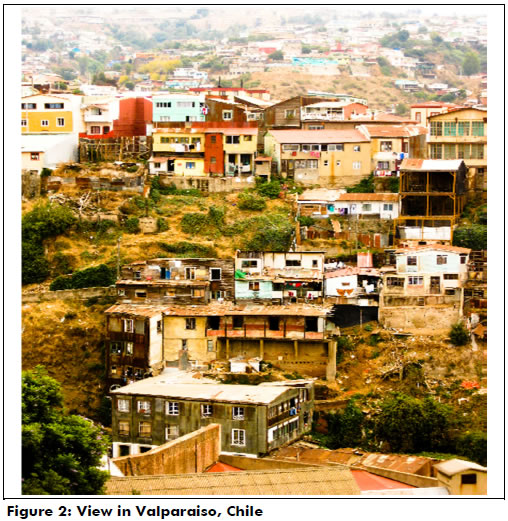
In spite of these results, isovist analysis has been subject to criticisms. Ervin and Steinitz (2003), for example, suggested that this technique is necessary "but not sufficient" as a means to provide a picture of the environment because it does not reflect how people see through soft boundaries, such as foliage, or how lightning condition affect a the visual capacities of the people. However, perhaps the primary criticism regarding isovists analysis is that it cannot provide 3D information about the environment (Taniguchi et al. 2012). This is particularly relevant in hilly cities such as Valparaiso, Chile, where people can normally see places that are inaccessible from the place they are standing. Figure 2 shows a typical view from a mirador in Valparaíso, where you see the next hills across a ravine. These views in fact are what make this type of city special; they could be characterized as special visual experiences.
The focus of this paper is primarily methodological and hopes to contribute to a long-standing problem in isovist theory: its inadequacy to represent a person's visual experiences in uneven terrain. In addition to this objective, this paper aims to contribute to the current debate on weak heritage by developing objective methods to describe a person's visual experience.
3D Configurational Model
The 3D model is based on the theoretical framework proposed by Hillier and colleagues (Hillier and Hanson 1984, Hillier 1996), which analyzes space in a relational (or configurational) way. This three-dimensional visibility model was created by extending the two-dimensional methodology of mutually visible locations developed at University College London (Turner, Doxa, O'Sullivan and Penn, 2001): the "UCL Depthmap" software.
This model implies a change from the two dimensional grid used in Depthmap to a rectangular Digital Elevation Model (DEM), where a three-dimensional input model is represented as a grid of squares with associated elevations. For each square of the grid, a line of sight analysis is performed with each other grid square. By treating each square as a node, and each line of sight as an edge between two nodes, a three-dimensional visibility graph can be constructed.
This graph yields an abstract and relatively compact representation of the visual structure of the spaces or territories under consideration and allows their quantitative analysis. Four measures from graph theory were selected to measure the configurational properties of 3D visual fields in Valparaíso.
- Closeness centrality is the distance between two graph nodes defined as the number of edges (i.e., steps) in the shortest path between the nodes. The closeness centrality of a node is calculated by summing over and normalizing the distances between itself and every other node in the graph. This measure is analogous to Hillier and Hanson's (1984) concept of integration and is a global measurement (i.e., it accounts for the entire graph as observed from each node, not just its local neighborhood). For formula definitions, see Sabidussi (1996).
- Betweenness centrality is the fraction of the shortest paths of the graph (i.e., "geodesics") that pass through each node and can be understood as a measurement of control because nodes with higher values will be more important for communication routes within the graph. It is a global measurement. For formula definitions, see Freemam (1977).
- Degree centrality is defined as the number of edges of a given node and is analogous to Isovist Size (Benedikt, 1979), representing the area visible from a given point. It is a strictly local measurement because it only accounts for the nodes directly visible from each node (i.e., its neighborhood).
- Clustering coefficient represents the number of connections between the nodes of a given node's neighborhood divided by the total number of possible connections within this neighborhood. This measurement was introduced by Watts and Strogatz (1998) in a discussion of the small-world phenomenon (Milgram, 1967: 60-67). Although this is a local measurement, it is a subtle sign of how local or global a certain node is because it represents the extent to which a node (i.e., place) is capable of creating links with unrelated nodes. A node with a clustering coefficient of 1 would only be linked to nodes that are not linked among themselves and would thus be instrumental in the generation of visual relations among areas that would be otherwise cut off from each other. A node with a clustering coefficient of 0 would not create any new visual relations, but rather reinforce existing ones. For formula definitions, see Schank and Wagner (2005).
Testing the software in Valparaiso's weak urban heritage
The idea of weak heritage reflects the change in perspective from traditional monumental heritage that values cathedrals, palaces and monuments (Ruskin, 1925) towards a perspective that focuses on other elements of the man-made landscape that are less evident but contribute significantly to the identity of cities. This weak or modest heritage does not depend on the historical value, aesthetics or symbolic meaning of individual buildings but can come from the addition of small buildings and public spaces that might not have much individual value; however, it is their grouping and agglomeration that create a valuable man-made landscape. These places are frequently associated with the creation and conservation of a particular way of life, attaining an additional value.
The concept of modest cultural heritage is thus considered for the first time as follows: "The concept of an historic monument embraces not only the single architectural work but also the urban or rural setting in which is found the evidence of a particular civilization, a significant development or an historic event. This applies not only to great works of art but also to more modest works of the past, which have acquired cultural significance with the passing of time. (Venice Charter, 1964).
This change of perspective regarding heritage was enlarged and strengthened by the Carta de Quito in 1964 and by the Carta de Veracruz in 1992. Thus, the definition of the heritage concept is redefined from a museum piece, isolated and untouched, as inaugurated by Ruskin, to a social and cultural good that is extensive and imbricated with society itself.
In the case of Valparaíso, after a long and hazardous process, the UNESCO World Heritage Committee incorporated the city into the World Heritage List in 2003. The application document mentions the following attributes (Gobierno de Chile, 2001):
- Exceptional geographical and topographic conditions that impose strong conditionings to its architecture and urban design.
- Spatial and visual integration, given by the natural amphitheater and series of ravines and slopes.
- Vernacular urban grid coherent with the geography and architecture offering various spaces of social encounter and contemplation.
These arguments, which were significantly based on the concept of weak heritage, confirmed this initial intuition (i.e., that non-monumental heritage character depends significantly on configurational aspects of the urban grid) and gave focus to the next steps of research. In the case of Valparaíso, it was clear that the urban grid and particularly the visual fields marked by the geographic conditions gave the city its unique condition. The visual relations allowed by the rugged geography in turn required a 3D model that could capture configurational properties from inhabited spaces at different topographic levels (Hillier 1996).
Application to Valparaiso
General Model
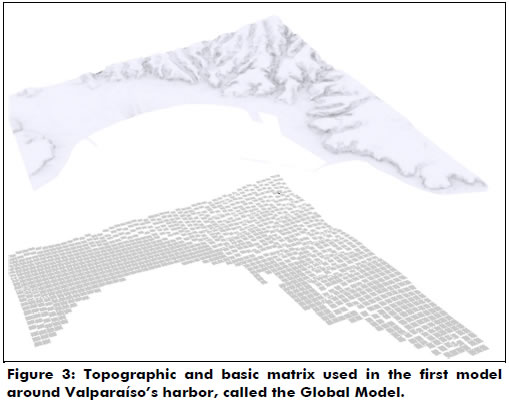
To test the model and its relevance in identifying the weak heritage specificities of Valparaíso, an area of 3.5 km by 3.5 km was chosen, encompassing a large part of the central district developed around the harbor. This area was represented through a digital elevation model of 2500 square cells (50 per side). Each of these cells represented approximately 70 meters by 70 meters, and thus disregarded the heights of individual buildings or streets (i.e., they only considered that of the underlying topography). Figure 3 shows the area topography and this first model.
A three-dimensional visibility graph was generated from this model and analyzed with the measurements of centrality and clustering previously described (Figure 4). Despite the scale chosen, the models allowed the authors to observe structural aspects of the visual relations in Valparaíso. The differentiation in betweenness centrality seems relevant because this measurement can be understood as a control over the visual relations. This together with the lack of contrast in degree centrality, which refers to the size of view fields, leads to the idea that even though many places in Valparaíso, both high and low, have large visual fields, the hillsides can be distinguished because of the level of control they have over visual relationships in terms of seeing and being seen from many different parts of the city. This quality depends on height and topography and not on relationships that can be described in two dimensions.
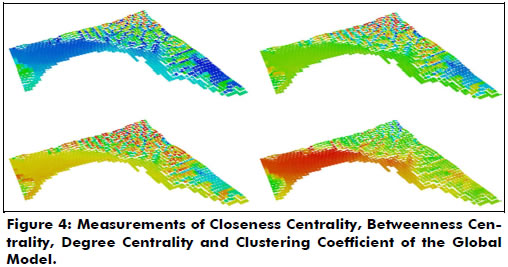
Conversely, closeness centrality, which is related to the concept of integration, varies considerably within the hills and ravines, creating a mix of spaces that are strongly visually integrated into their urban context while others are heavily segregated. This matches the perception on the ground in terms of the quality of public spaces and constructions: the areas located within closed ravines with little or no visual relationships are poorer and in worse conditions than those on more advantageous visual positions.
This first analysis, while fairly low resolution and general in nature, served to describe the underlying characteristics that could help identify and characterize the most valuable and vulnerable areas in a larger study.
Area Model
A second more specific exercise was then performed in a square area of 950 meters per side on Cerro Concepción. This area was chosen because it has been undergoing strong development over the past few decades and has shown rising land prices, new construction, commerce and an emerging touristic interest.
The area was modeled with a grid of 10,000 units (100 ×100) of 9.5 × 9.5 meters, representing only those surfaces where an observer could stand, excluding rooftops and building interiors (Ma). A second matrix (Mb)was generated by representing all surfaces and buildings that could be observed from the units in Ma and that could block the sightlines within the analysis area. The visibility graph C is then generated between every square of Ma, considering the occlusion effect of Mb. Figure 5 shows the results of this operation.
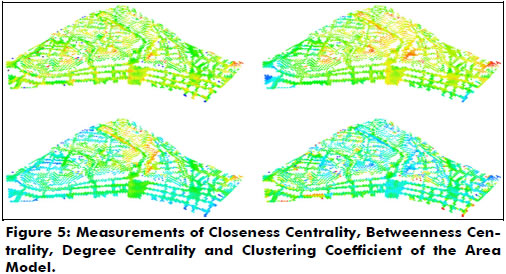
The betweenness centrality analysis of this graph reaches its highest values at the corners of the streets on the elevated part of the hills, particularly those that look out over significant drop-offs. Counterintuitively, primary streets tend to have lower centrality measurements, which are likely caused by the fact that these types of streets tend to follow the bottom of natural ravines and consequently are visually isolated. It follows that the visual structure of the area is not tied to its vehicular pattern, but rather to its pedestrian system. This is coherent with the zone's character, which is composed of highly idiosyncratic paths, stairs and viewpoints.
The closeness centrality shows a different pattern, varying more gradually and reaching its local maximum values at the hills' edges where the slope breaks out onto the low flat area near the water. Two important viewpoints, Gervasoni and Yugoslavo, and the slopes of the hills around an important road called José Tomás Ramos Street, though not the street itself, have particularly high values.
The area's clustering coefficient shows a looser structure. The lower values (i.e., those that refer to more global relationships) are related not only to edges and terraces but also to inner areas, such as Templeman Street, which is an important street in the area, connecting the Gervasoni viewpoint, Concepción and the Alegre Hills. This area of strong global relations between local systems has a high concentration of tourist-oriented restaurants and shops. The importance of this street within the structure of the area can be understood as an in-between location for the two visual systems described. The betweenness centrality analysis of this graph reaches its highest values at the corners of the streets on the elevated part of the hills, particularly those that look out over significant drop-offs. Counterintuitively, primary streets tend to have lower centrality measurements, which are likely caused by the fact that these types of streets tend to follow the bottom of natural ravines and consequently are visually isolated. It follows that the visual structure of the area is not tied to its vehicular pattern, but rather to its pedestrian system. This is coherent with the zone's character, which is composed of highly idiosyncratic paths, stairs and viewpoints.
The closeness centrality shows a different pattern, varying more gradually and reaching its local maximum values at the hills' edges where the slope breaks out onto the low flat area near the water. Two important viewpoints, Gervasoni and Yugoslavo, and the slopes of the hills around an important road called José Tomás Ramos Street, though not the street itself, have particularly high values.
The area's clustering coefficient shows a looser structure. The lower values (i.e., those that refer to more global relationships) are related not only to edges and terraces but also to inner areas, such as Templeman Street, which is an important street in the area, connecting the Gervasoni viewpoint, Concepción and the Alegre Hills. This area of strong global relations between local systems has a high concentration of tourist-oriented restaurants and shops. The importance of this street within the structure of the area can be understood as an in-between location for the two visual systems described.
Correlation with User Data
To test the measurements generated in the previous model, the data were compared to a dataset collected via the Flickr.com photography website.
This site allows registered users to upload pictures to publicly viewable web galleries. Each photograph registers the place, time and date it was taken. The Flickr site has an Application Programming Interface (API) that allows programmers to access its database in a more direct manner. Using this API, 3,453 photographs were identified as having been taken within the general study area before or on August 21st 2007, and their attributes where downloaded into a local database.
These attributes included ID, owner, location (i.e., where the photograph was taken expressed as decimal coordinates in WGS 84), owner location (i.e., declared location of the photograph's uploader), tags (i.e., user created descriptors applied to each photograph) and date. The owner location data were used to differentiate between local and non-local people. Tags do not follow a fixed taxonomy or controlled vocabulary, but are created and used freely, allowing both the description of individual photographs and the creation of relationships between otherwise unrelated images; for instance, two users who have never met but who both tag an image as "tragedy."
This distributed and spontaneous description of urban spaces creates a semantic layer of data that can be superimposed on the syntactic one studied in the previous stage. In this study, a georeferenced tag cloud is generated, where the size of each word relates to its frequency of use in each location. The information used to generate it is freely available online, and the methodology could be replicated by any interested researcher (Figure 6).
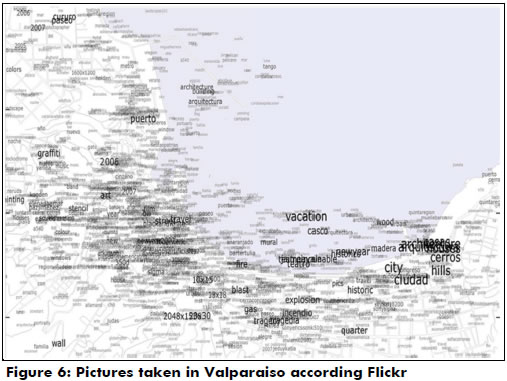
These data allow the measurement of the amount of photographs taken in any square of the analysis grid under consideration and the discrimination of those taken by locals, by non-local Chileans and by foreigners. A series of linear regressions were performed using the different measures of centrality and clustering as independent variables and the frequency of photographs in each location for each owner location group as dependent variables.
A significant correlation was found between foreigners and the measurements of closeness centrality (R2=0.19) and degree centrality (R2=0.21), while no significant correlation was found for those who live in Valparaíso and Chile, nor for foreigners with the other measurements (Figure 6). This can be interpreted as a tendency for foreigners to take pictures at (and thus occupy) places that are highly integrated visually and that have wider view fields.
Conclusions
This research has sought to advance the application of isovist analysis in uneven scenarios. The proposed techniques in this study are thus an attempt to construct objective methods to measure visual experiences in the environment in a more ecological way by considering the effect of 3D dimensional information. 3D information provides the user an invaluable source of information that permits him to grasp the invariable structure of the environment; "when the vistas are put by explanatory locomotion, the invariant structure of the house, the town, or the whole habitat will be apprehended" (Gibson 1979: 198).
The experiment also allowed a better understanding of the concept of "weak heritage" as it applies to the city of Valparaíso. The result allows for a general approach to the visual structure of the city with different levels of resolution according to each iteration's parameters.
It is clear that the general issue of Valparaíso's weak heritage refers to many other aspects beyond visual relations, but the exercises presented show the importance of the special visual relations produced by the rugged geography. These methods were able to identify the famous "miradores" and reached some preliminary conclusions about the articulation of global vs. local visual systems, particularly in terms of the legibility of each neighborhood by visitors.
Acknowledgements
The authors wish to thank the Chilean Fund for the Development of Scientific and Technological Research (FONDECYT Project 1141096), and the Centre for Sustainable Urban Development, CEDEUS (Conicyt/Fondap/15110020) for their support to this project.
References
Batty, M. (2001). Exploring isovists fields: space and shape in architectural and urban morphology. Environment and Planning B: Planning and design, 28, 123-150. [ Links ]
Benedikt, M. (1979). To take hold of space: Isovist and isovist fields. Environment and Planning B, 6, 47-65. [ Links ]
Campos, M. B. (1997). All that meets the eye: Overlapping isovists as a tool for understanding preferable location of static people in public squares. In Proceedings of the First International Space Syntax Symposium, London, University College London. [ Links ]
Conroy-Dalton, R. (2001). Spatial navigation in immersive virtual environments. (Doctoral Dissertation, University of London) Retrieved from http://discovery.ucl.ac.uk/1111/ [ Links ]
Conroy-Dalton, R. (2007). Isovist characteristics of stopping behavior. In S. Winter, M. Duckham, L. Kulik & B. Kuipers (Eds.), Proceedings of the Eighth International Conference, COSIT 2007, Melbourne. [ Links ]
Chang, D., & Penn A., (1998). Integrated multilevel circulation in urban areas: the effect of multiple interacting constrains on the use of complex urban areas. Environment and Planning B: Planning and Design, 25, 507-538. [ Links ]
Ervin, S., & Steinitz, C. (2003). Landscape visibility computation: Necessary, but not sufficient. Environment and Planning B: Planning and Design, 30,757-766. [ Links ]
Freemam, L. C. (1977). A set of measures of centrality based on betweenness. Sociometry, 40, 35-41. [ Links ]
Gibson, J. (1950). The perception of the visual world. New York: Houghton Miffin Co. [ Links ]
Gibson, J. (1979). The ecological approach to visual perception. New York: Houghton Miffin Co. [ Links ]
Gobierno de Chile (2001). Postulación de Valparaíso como Sitio del Patrimonio Mundial, UNESCO. (Retrieved from http://www.monumentos.cl/consejo/606/articles-45668_doc_pdf.pdf) [ Links ]
Gregory, R. L. (1998). Eye and Brain: The psychology of seeing. Oxford: Oxford University Press. [ Links ]
Hillier, B., & Hanson, J. (1984). The Social Logic of Space. Cambridge: Cambridge University Press. [ Links ]
Hillier, B. (1996). Space is the Machine. Cambridge: Cambridge University Press. [ Links ]
MacEachren, A. M. (1995). How maps work: Representation, visualization and Design. New York: The Guilford Press. [ Links ]
Marr, D. (1982). Vision: a computational investigation into the human representation and processing of visual information. New York: W. H. Freeman and Company. [ Links ]
Milgram, S. (1967). The small world problem. Sociometry, 32(4), 425-443. [ Links ]
Mora, R., Astudillo, H., & Bravo, S. (2014). Looking ahead: A vision-based software for predicting pedestrian movement. Revista Ingeniería e Investigación, 34(1), 79-82. [ Links ]
Calin G., & Roda, V. O. (2007). Real-time disparity map extraction in dual head stereo system. American Applied Research, 27(1), 21-24. [ Links ]
Penn, A., & Turner, A. (2001). Space syntax based agent simulation. Retrieved from http://discovery.ucl.ac.uk/2027/ [ Links ]
Peponis, J., Conroy-Dalton, R., Wineman, J., & Dalton, N. (2004). Measuring the effects of layout on visitors' spatial behavior in open exhibition settings. Environment and Planning B: Planning and Design, 31, 453-473. [ Links ]
Ruskin, J. (1925). The Seven Lamps of Architecture. London: George Allan and Unwin Ltd. [ Links ]
Sabidussi, G. (1996). The centrality index of a graph. Psychometrika, 31, 581-603. [ Links ]
Sanchez-Hernampérez, A. (2004). Paradigmas Conceptuales en Conservación. Madrid: Biblioteca Nacional. Retrieved from http://www.cool.conservation-us.org/byauth/hernampez/canarias.html) [ Links ]
Schank, T., & Wagner, D. (2005). Approximating clustering coefficient and transitivity. Journal of Graph Algorithms and Applications, 9, 265-275. [ Links ]
Tandy, C. R. (1967). The isovist method of landscape survey. In Methods of Landscape Analysis. Oxford Clarendon Press. [ Links ]
The Athens Charter (1931). International Charter for the Restoration of Historic Monuments. Retrieved from http://www.icomos.org/en/charters-and-texts/179-articles-en-francais/ ressources/charters-and-standards/167-the-athens-charter-for-the-restoration-of-historic-monuments [ Links ]
The Venice Charter (1964). International Charter for the Conservation and Restoration of Monuments and Sites. Retrieved from http://www.icomos.org/charters/venice_e.pdf [ Links ]
Thompson, E. (2007). Mind in life: biology, phenomenology, and the sciences of Mind. Cambridge, Mass: Harvard University Press. [ Links ]
Taniguchi, T., Takahashi, Y., & Kishimoto, T. (2012). View and Viewed Analysis. In M. Greene, J. Reyes & A. Castro (Eds.), Proceedings of the Eighth International Space Syntax Symposium. Santiago de Chile. [ Links ]
Turner, A. (2003). Analyzing the visual dynamics of spatial morphology. Environmental and Planning B: Planning and Design, 30, 657-676. [ Links ]
Turner, A., Doxa, M., O'Sullivan, D., & Penn, A. (2001). From isovists to visibility graphs: a methodology for the analysis of architectural space. Environment and Planning B: Planning and Design, 28, 103-121. [ Links ]
Turner, A., & Penn, A. (2002). Encoding natural movement as an agent-based system: An investigation into human pedestrian behavior in the built environment. Environment and Planning B, 29, 473-490. [ Links ]
Watts, D., & Strogatz, S. (1998). Collective dynamics of "small world" networks. Nature, 4, 409-410. [ Links ]
Wiener, J. M., Franz, G., Rossmanith, N., Reichelt, A., Mallot, H. A. & Bülthoff, H. H. (2007). Isovist analysis captures properties of space relevant for locomotion and experience. Perception, 36(7), 1063-1083. [ Links ]
