


Servicios Personalizados
Revista
Articulo
 Inglés (pdf)
 Articulo en XML
 Referencias del artículo
 Enviar articulo por email
Indicadores
-
 Citado por SciELO
 -
 Accesos
Links relacionados
-
 Citado por Google
 -
 Similares en
SciELO
Similares en
SciELO -
 Similares en Google
Compartir

 Permalink
Ingeniería e Investigación
versión impresa ISSN 0120-5609
Ing. Investig. vol.34 no.3 Bogotá sep./dic. 2014
https://doi.org/10.15446/ing.investig.v34n3.43002
DOI: http://dx.doi.org/10.15446/ing.investig.v34n3.43002
L. Ramírez-Perodomo1 and A. Lozano2
1Sindy Lorena Ramírez Perdomo. M. Sc. Ingeniería Eléctrica, Universidad del Valle, Colombia. Affiliation: Universidad del Valle, Colombia. E-mail: sindy.lorena.ramirez@correounivalle.edu.co
2Carlos Arturo Lozano Moncada. PhD., Universidad de Strathclyde, Reino Unido. Affiliation: Universidad del Valle, Colombia. E-mail: carlos.a.lozano@correounivalle.edu.co
How to cite: Ramírez-Perdomo, S. L., & Lozano, C. A. (2014). Evaluation of indices for voltage stability monitoring using PMU measurements. Ingeniería e Investigación, 34(3), 44-49.
ABSTRACT
Large disturbances such as voltage collapse and its consequences represent a large challenge to the operational safety of power systems. Therefore, it is important to have indicators of the presence of voltage stability problems in real time. Using phasor measurements of voltage and current that are presented in Phasor Measurement Units (PMU), indices for voltage stability monitoring can be calculated in real time. This paper presents some indices for voltage stability monitoring using PMU measurements. Evaluation of such indices on a simplified system was carried out, and the indices were classified according to their method of calculation. Finally, one of these indices was used with the New England 39-bus system under different operating scenarios, including load increments, line output and generator output, to check the indices' behavior for voltage stability monitoring based on synchronized local measurements.
Keywords: Contingency, Phasor measurement unit (PMU), voltage stability, wide area measurement system (WAMS), power system.
RESUMEN
Las grandes perturbaciones, tales como: el colapso de tensión y sus consecuencias, representan un gran desafío para la seguridad operativa de los sistemas de potencia. Por lo tanto, es importante contar con indicadores para alertar la presencia de problemas de estabilidad de tensión, en tiempo real. A partir de mediciones fasoriales de voltaje y corriente proporcionadas por las unidades de medición fasorial -PMU, se pueden calcular los índices para el monitoreo de la estabilidad de tensión en tiempo real. Así, este articulo presenta algunos índices para el monitoreo de dicha estabilidad, utilizando mediciones PMU.
Se realizó la evaluación de los índices en un sistema simplificado y se clasificaron de acuerdo a su método de cálculo. Finalmente, uno de estos índices fue utilizado con el sistema New England 39-nodos, bajo diferentes escenarios de operación, incluyendo incrementos de carga, salida de línea y salida de generador, para comprobar de esta manera, el comportamiento de los índices de monitoreo de estabilidad de tensión basado en mediciones locales sincronizadas.
Palabras clave: Contingencia, Unidad de Medición Fasorial (PMU), estabilidad de tensión, sistemas de medición de área amplia (WAMS) y sistema de potencia.
Received: April 9th 2014 Accepted: July 21st 2014
Introduction
A system goes into a state of voltage instability when there is a large disturbance or a change in demand or operating conditions, which causes a progressive and uncontrollable voltage drop. The large disturbances in power systems, such as a voltage collapse and its consequences, represent a challenge for the industry. For the latter, the implementation of monitoring technologies and distributed control such as PMU and WAMS are being carried out, which have become available in recent times (Lim; & DeMarco, 2013).
Some indices based on actual data collection have emerged to monitor voltage stability, which allow defining operating states, critical network areas, limits and voltage stability margins. These
indices are used to detect and predict on-line voltage instability. They do not use simulations as the voltage security-oriented methods do; instead, they are based only on the measurements taken from the power system itself.
This paper presents a comparison and evaluation of several voltage-stability monitoring indices using PMU measurements in a simplified 2-Bus system. One of these indices was tested in the New England 39-bus system for evaluation under different operating scenarios and to check its behavior for voltage stability monitoring based on synchronized local measures. The purpose of the article was to review, analyze and evaluate the indices present in the literature for voltage stability monitoring based on PMU measurements.
Indices for monitoring voltage stability
Many indicators have proven to be useful tools for the system operators, who must make decisions about the operating states of the network (Liu & Chu, 2013). However, acquiring such data measurements, which is necessary to calculate the indices, involves delays related to the differences in times at which each measurement was taken. This limits the speed of reaction in case of contingencies and affects the results' reliability for corrective actions to avoid the system outage. Synchrophasors overcome the difficulty faced with time delays in data acquisition for phasor measurements; when smartly located, they can display the system status without involving a heavy data processing load. In addition, the time stamp that a PMU prints on each measurement enables the definition of a temporal pattern for each required index, ensuring that the measurements obtained reflect the same system operating status (Genet, 2009).
Security indices based on voltage synchronized local measurements have been developed for the real-time detection of voltage-stability problems. These methods are based on real-time measurements taken from PMU, which are called local phasors (Dasgupta, Paramasivam, Vaidya & Ajjarapu, 2013).
The premise of these methods is that the measurements taken by the PMU contain sufficient information to determine the dynamic state of the system in real time (Zapata, Rios & Arias, 2010).
ISI Index (Impedance Stability Index)
ISI index is based on two consecutive measurements of the voltage and current that are taken at a substation at two different moments, tk and tk+1. A comparison between the magnitudes of the load impedance at the substation and the Thévenin equivalent impedance of the system, as observed from this substation, is made according to the maximum power theorem. For a substation j, this index is defined in equation (1):
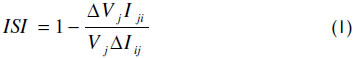
Consecutive measurements are taken by the PMU at the buses, where ΔVj y ΔIij is the difference between two consecutive measurements of voltage and current, respectively, at moments, tk and tk+1 at the load bus. Under normal operating conditions, ISI = 1, and from the point of maximum power transfer, i.e., in voltage instability, ISI = 0 (Smon, Verbic & Gubina, 2006).
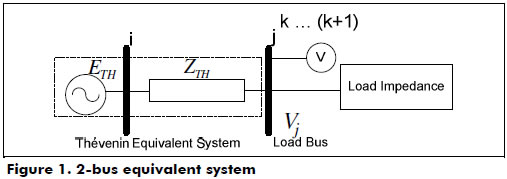
Figure 1 shows the 2-bus equivalent system used in the circuit. From this system, the mathematical analysis of all indices based on PMU measurements is derived.
VSLBI index (Voltage Stability Load Bus Index)
The voltage stability index in the load bus is defined (2), where ΔVZTH is the voltage drop across the transmission impedance, ZTH, and Vj is the voltage of the load bus, as observed in Figure 1.
When the load is of the constant power type, the voltage instability point coincides with the point of maximum power transfer where ΔVZTH= Vj.
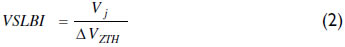
When the system is in a condition of proximity to voltage collapse, then VSLBI≈1; otherwise its value is in the range (1.5 to 5). The index for a system with j load buses is the lowest VSLBI value obtained (Milosevic & Begovic, 2003).
VSI Index (Voltage Stability Index)
Given a model of a simplified power system, as shown in Figure 1, the active power P and the reactive power Q can be expressed by equations (3) and (4):
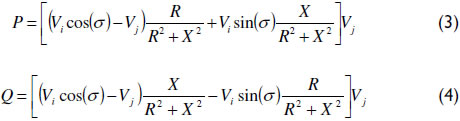
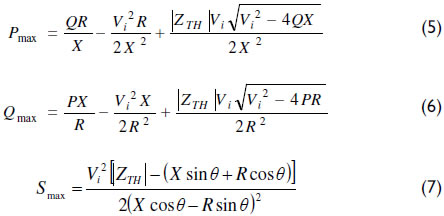
where σ is the angle of the generator bus. The maximum power transfer, Pmax, demanded can be calculated by (5), where ZTH = √(R2+X2), assuming that the reactive power demand, Q, is constant. Similarly, the maximum reactive power, Qmax, transfer and the maximum complex power demand can be calculated by (6) and (7), assuming that the power demand, P, and the power angle, θ=tan-1(Q/P), are constants:
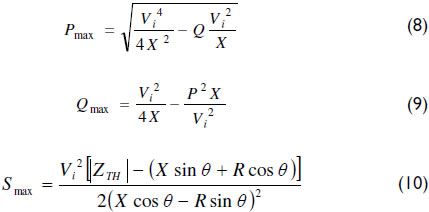
For transmission lines with a high relation of X/R and neglecting the resistance R, the equations are reduced to (8), (9) and (10):
With the prediction of Pmax, Qmax and Smax, the load ranges are calculated using equations (11), (12) and (13):

The VSI index, based on the margin's prediction, is shown in (14):
Smaller VSI values indicate that the load bus is close to the stable marginal voltage. Once the loading bus has reached the point of marginal stable voltage operation, its VSI is zero (Salehi, Mazloomzadeh & Mohammed, 2011).
TPSI Index (Transmission Path Stability Index)
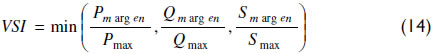
This index is based on an analytical method for determining the proximity to voltage collapse for radial systems. The radial network is transformed into a network of two buses, as in Figure 1, with the corresponding phasors represented in Figure 2.
The maximum power transfer is achieved when (15) is reached. Here, δ is the angle of the load bus:

This expression defines the point of singularity for the Jacobian, which would be the point of voltage collapse of a radial system. Therefore, the line impedance and the load impedance are the same.
Using equation (16), the TPSI index is calculated for the equivalent of the radial transmission network:

For TPSI = 0, the power transfer of the radial network is unstable. The proposed procedure has been tested on real radial networks with inductive and capacitive loads (Gubina & Strmcnik, 1995).
VIP Index (Voltage Index Predictor)
The VIP index analyzes the proximity to the voltage collapse (or instability), expressed in terms of power margins.
The proximity to voltage collapse is calculated using the system shown in Figure 1. The maximum power transfer occurs when |Zload|=|ZTH| (Duong & Uhlen, 2013)|, where the load impedance Zload is the relation between the measurements of both voltage and current phasors at the load bus. When the loadability is normal, the following condition is obtained: |Zload|>ZTH. At the beginning of the voltage instability, the difference between the impedances is close to zero. Therefore, tracking the proximity of voltage instability is performed following the distance between |Zload| and ZTH. This is the essence of the VIP index.
In terms of power, the difference between the maximum power using linear estimation and the actual power observed by the voltage predictor VIP is the margin of power. This can be expressed by (17), where Vj and Iij are the actual measurements of voltage and current in the load, respectively, and ZTH is the actual Thévenin impedance:
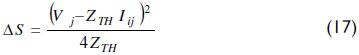
When ΔS is zero, the system is in maximum power transfer, which is the point of voltage collapse (Julian et al., 2000).
PTSI Index (Power Transfer Stability Index)
This index is based on the limit of maximum power transfer. Considering the load to be a constant impedance element thus dynamically predicts the voltage collapse in a power system.
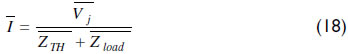
In the circuit of Figure 1, the load current is calculated using (18).
Using equation (19), the apparent load power is calculated:

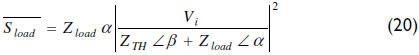
Substituting the above two equations and considering that  and , equation (20) is obtained. Here, is the angle of the load impedance, and is the phase angle of the Thévenin impedance.
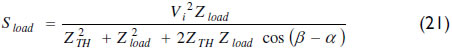
Expanding the above equation, the following equation is obtained:
To evaluate the distance from the load bus to the voltage collapse, a power margin is defined as Sloadmax-Sload. The power range is equal to "0" if Zload=ZTH, and it indicates that the power transfer cannot be transferred to that point and that voltage collapse occurs. Therefore, voltage collapse occurs when (Sload/Sloadmax)=1.
Therefore, by replacing terms with the previous equations, we arrive at the PTSI index in (22):
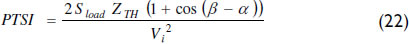
The PTSI index requires information about the involved bus voltage phasors and the admittance matrix of the network. The index value is between zero and one; when the PTSI index reaches one, it means that voltage collapse has occurred (Nizam, Mohamed, & Hussain, 2007).
Indices evaluation
The indices used to evaluate the real-time safe operation based on phasor measurements presented above were classified according to the calculation method shown in Table 1.
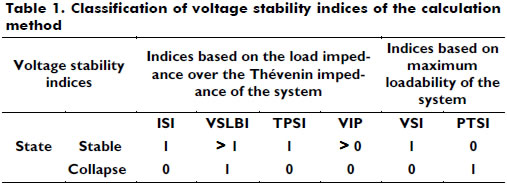
The indices were evaluated using a dynamic simulation in Matlab-Simulink for the system in Figure 1, where ETH=1 pu, ZTH=0.04+0.03i pu, Sload=1+0.33i pu. The load model used was the polynomial ZIP model (constant impedance, constant current and constant power), which expresses both the active and reactive power in the function for the electrical voltage to which the load is subjected. This model is widely used for voltage-stability dynamic analysis. The load was increased, keeping the power factor constant until the system reaches its maximum power transfer, where a voltage collapse occurs. The system considers the load increase to be a disturbance.
Figure 3 presents the evolution of each index for a dynamic simulation with respect to the time axis, "x". In this figure, all of the indices indicate that the system reaches voltage collapse at the same instant, i.e., the same strain stability problems are detected but with different scales of measurement.
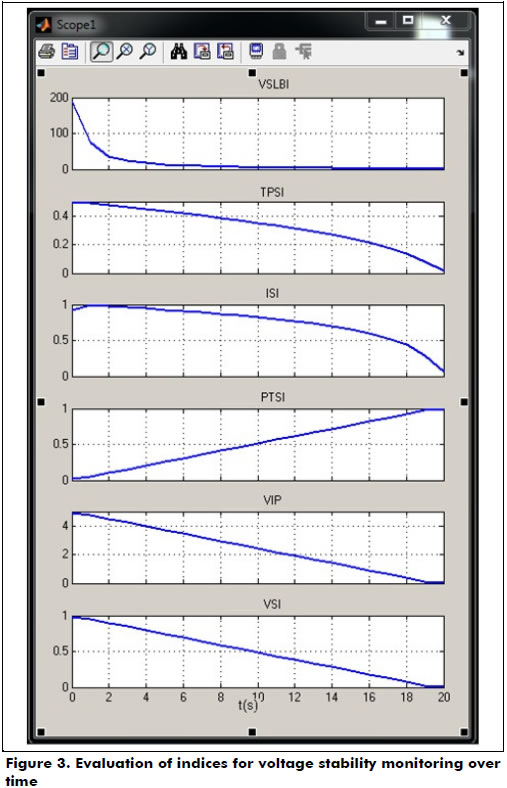
The curves behave with different nonlinearities and features, which occur because indices are based on the same theoretical principle and the same equations, which are treated algebraically differently in each index.
None of the analyzed indices considers the capability constraints for generating reactive power (limited by rotor and stator currents). In both the index-calculating methodologies and the simulations, it was assumed that reactive power would always be available in the source or the system; thus, the maximum power transfer from the network was analyzed. It should be noted that the system can reach voltage collapse due to a deficiency of reactive power in either the generation or static sources; thus, the system has the ability to transport power through the network.
Case study
The results obtained from the index assessments for the simplified 2-bus system indicate that the use of any index is indifferent because they all indicated voltage collapse at the same time. Thus, the index selection for the New England 39-bus system is irrelevant. The New England 39-bus system shown in Figure 4 was used to determine the ISI index in different operation modes.
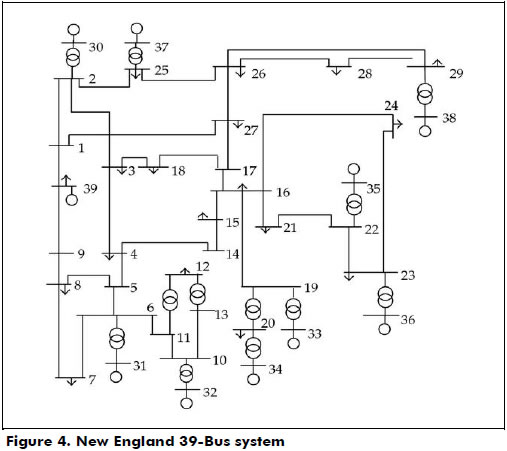
Simulations were performed using power systems analysis software to test the ISI index performance in different operating scenarios. At each load bus with a PMU installed, indices were determined to monitor voltage-stability problems.
Load increments
Figure 5 shows the voltage magnitude for load increments on each monitored bus. Load increments were made in each bus independently for each ISI index calculation. Figure 6 shows the index ISI for the load increments on buses 7, 12 and 23 over time.
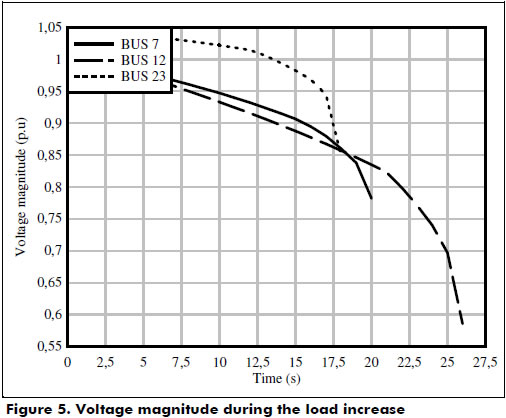
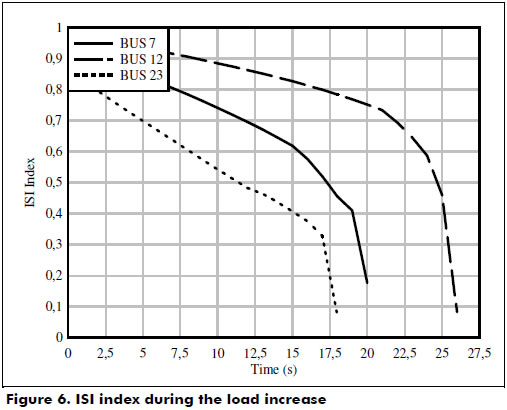
From these results, the indices showed that the stability limits are being reached; however, at the same time, the operating voltage limits have been already violated. An example is bus 12, which, under normal operating conditions, has an ISI index of 0.97 and a voltage of 1 p.u., but at approximately 13 seconds, the voltage reaches the operational lower limit of 0.9 p.u. and the ISI index decreases to 0.85.
If a system operator takes these indices as indicators of stability, it can lead to an inaccurate analysis because the system could reach voltage collapse without being detected.
This happens because the indices' theoretical formulation is based on evaluating the margins over the critical point of the PV curve, regardless of the voltage operational limits.
Scenario: generator output
In this scenario, the output of generator 9 located at bus 38 is simulated using dynamic stability software. The disconnection of the generator is considered 2 seconds after starting the simulation.
In Figure 7, the results of the voltage magnitude at bus 29, which is closer to the contingency, are presented.
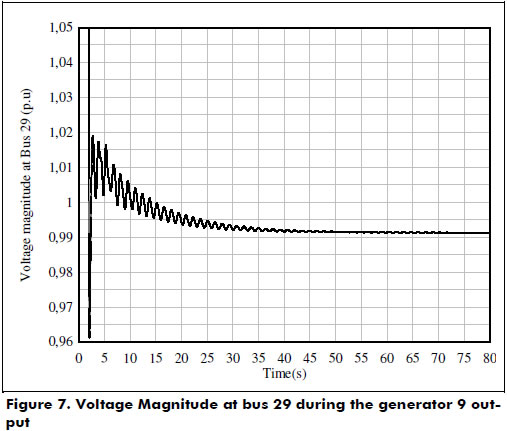
The monitored bus 29 voltage drops quickly due to the disturbance and oscillates at acceptable levels and ranges of operation. Approximately 40 seconds after the start of the contingency, the voltage reaches the balance and is set to a new value of approximately 0.99 p.u.
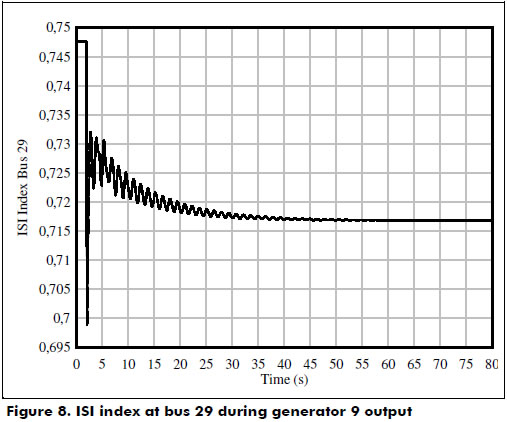
The indices' behavior is similar to the voltage behavior but has a smaller oscillation, as shown in Figure 8.
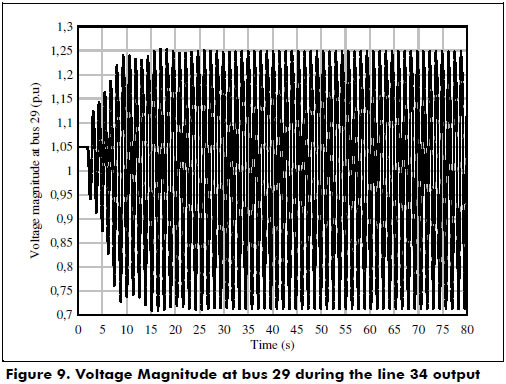
Scenario: line output
Line 34 located between buses 28 and 29 was removed from the system. The output of the network internal components causes a change in its topology. For this contingency, the Thévenin impedance was previously determined. The impedance calculation cannot be performed with the phasors because there is a topology change and using the ISI index method results in a difference between phasors in two different operating points, tk and tk+1. At the instant of the contingency (line output), phasors from two different networks would be compared, i.e., with different topologies.
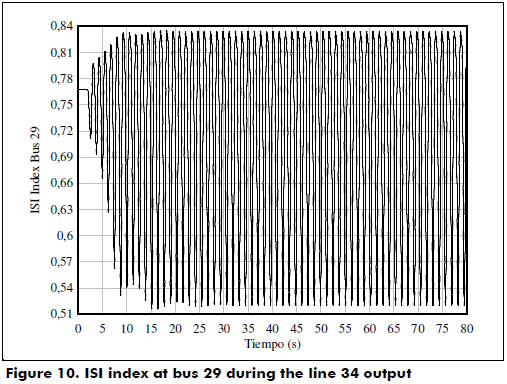
From Figure 9, it can be observed that the voltage at bus 29 fails to stay within the operating range limits after the contingency; such large deviations would increase the low voltage protections, creating islands in the power system and leading progressively to voltage collapse. Figure 10 shows the ISI index of bus 29 during the output of line 34, which also decreases rapidly after the contingency and follows the same trend presented at the voltage buses. In this case, the index does not indicate that the system reaches collapse, i.e., the index does not become zero, which is an indicator that there is a voltage-stability problem in the system. This is not a good indicator for a system operator.
Conclusions
In this article, the online voltage-stability monitoring was conducted using indices based on measurements presented as PMU in a simplified 2-Bus system. After all of these indices were evaluated, one was used in the New England 39-bus system under different operating scenarios. However, some limitations were found in the indices that were analyzed and used as indicators of the system status, such as voltage levels that indicate stability problems well below the operational limits. At the same time, the indices assumed that reactive power is always available at the source or system. Therefore, these indices are not good indicators of the presence of voltage-stability problems.
For our work, it was important to evaluate the performance of the indices on a simplified system and then, based on the results, to choose an index for use in a more complex system. Therefore, because all of the indices indicated the proximity to collapse at the same time, the choice of index was irrelevant to the New England 39-bus system.
The indices used for voltage-stability monitoring with the PMU data are quickly calculated compared with the conventional methods, which are based on power flow simulations. Additionally, the accuracy of the data provided by the PMU that are used as input parameters in the calculations guarantee accurate results.
From the simulations, it can be concluded that all of the indices detect the voltage collapse at the same instant, i.e., they detect the same voltage-stability problems but use different measurement scales, and that the curves behave with different linearity and features. This simultaneity occurs because all are based on the same theoretical principle, although the equations are applied differently.
All of the indices studied are based on evaluating the voltage stability margins at the critical point (at the peak of the PV curve). This critical point is considered the limit of stability in the analysis, which means that the system reaches the maximum power transfer and the voltage levels reach values below the operational limits.
The PTSI and VSI indices do not depend on the voltage of the load bus; instead, they depend on the loadability and maximum power transfer of the system. Conversely, the ISI, VSBLI, TPSI and VIP indices depend on the voltage at the loading bus and the ability to deliver power to the grid.
References
Dasgupta, S., Paramasivam, M., Vaidya, U., & Ajjarapu, V. (2013). Real-Time Monitoring of Short-Term Voltage Stability Using PMU Data. Power Systems, IEEE Transactions on, 28(4), 3702-3711. DOI:10.1109/TPWRS.2013.2258946 [ Links ]
Duong, D. T., & Uhlen, K. (2013). Online voltage stability monitoring based on PMU measurements and system topology. In Electric Power and Energy Conversion Systems (EPECS), 3rd International Conference on, 1-6. DOI:10.1109/EPECS.2013.6713056 [ Links ]
Genet, B. (2009). On monitoring methods and load modeling to improve voltage stability assessment efficiency (Doctoral thesis). Université Libre de Bruxelles (U. L. B.), Brussels, Belgium. [ Links ]
Gubina, F., & Strmcnik, B. (1995). Voltage collapse proximity index determination using voltage phasors approach. IEEE Transactions on Power Systems, 10(2), 788-794. DOI: 10.1109/59.387918 [ Links ]
Julian, D. E., Schulz, R. P., Vu, K. T., Quaintance, W. H., Bhatt, N. B., & Novosel, D. (2000). Quantifying proximity to voltage collapse using the Voltage Instability Predictor (VIP). IEEE Power Engineering Society Summer Meeting, 2, 931-936. DOI: 10.1109/PESS. 2000.867496. [ Links ]
Lim, J. M., & DeMarco, C. L. (2013). Model-free voltage stability assessments via singular value analysis of PMU data. IN Bulk Power System Dynamics and Control - IX Optimization, Security and Control of the Emerging Power Grid (IREP), IREP Symposium, 1-10. DOI:10.1109/IREP.2013.6629399 [ Links ]
Liu, J., & Chu, C. (2014). Wide-Area Measurement-Based Voltage Stability Indicators by Modified Coupled Single-Port Models. Power Systems, IEEE Transactions on, 29(2), 756-764. DOI:10.1109/ TPWRS.2013.2284475. [ Links ]
Milosevic, B., & Begovic, M. (2003). Voltage-Stability Protection and Control Using a Wide-Area Network of Phasor Measurements. IEEE Transactions on Power Systems, 18(1), 121-127. DOI: 10.1109/ TPWRS.2002.805018 [ Links ]
Nizam, M., Mohamed, A., & Hussain, A. (2007). Dynamic Voltage Collapse Prediction on a Practical Power System Using Power Transfer Stability Index. Research and Development, SCOReD 5th Student Conference on, 1-6. DOI:10.1109/SCORED.2007.4451398. [ Links ]
Salehi, V., Mazloomzadeh, A., & Mohammed, O. (2011). Development and Implementation of a Phasor Measurement Unit for Real-Time Monitoring, Control and Protection of Power Systems. IEEE Power and Energy Society General Meeting, 1-7. DOI: 10.1109/PES.2011.6039757 [ Links ]
Smon, I., Verbic, G., & Gubina, F. (2006). Local Voltage-Stability Index Using Tellegen's Theorem. IEEE Transactions on Power Systems, 21(3), 1267-1275. doi:10.1109/TPWRS.2006.876702 [ Links ]
Zapata, C. J., Rios, M., & Arias, J. M. (2010). Índices para detectar en tiempo real problemas de estabilidad de voltaje. Scientia et Technica Año XVI Universidad Tecnológica de Pereira, 1(44), 19-24. [ Links ]
