


Services on Demand
Journal
Article
 English (pdf)
 Article in xml format
 Article references
 Send this article by e-mail
Indicators
-
 Cited by SciELO
 -
 Access statistics
Related links
-
 Cited by Google
 -
 Similars in
SciELO
Similars in
SciELO -
 Similars in Google
Share

 Permalink
Ingeniería e Investigación
Print version ISSN 0120-5609
Ing. Investig. vol.34 no.3 Bogotá Set./Dec. 2014
https://doi.org/10.15446/ing.investig.v34n3.43602
DOI: http://dx.doi.org/10.15446/ing.investig.v34n3.43602
F. Clemente1, M. Santos-Couceiro2, F. Lourenço-Martins3, R. Sousa4 and A. Figueiredo5
1Filipe Manuel Clemente. PhD Student in Sports Sciences, Polytechnic Institute of Coimbra, ESEC, Department of Education, Coimbra, Portugal. Affiliation: Polytechnic Institute of Coimbra, ESEC, Department of Education, Coimbra, Portugal. E-mail: filipe.clemente5@gmail.com
2Micael Santos Couceiro. PhD degree on Electrical and Computer Engineering (Automation and Robotics), University of Coimbra, Portugal. Affiliation: Ingeniarius Lda., Mealhada, Portugal. E-mail: micaelcouceiro@isr.uc.pt
3Fernando Manuel Lourenço Martins. PhD in Mathematics, Universidade da Beira Interior, Portugal. Affiliation: Instituto de Telecomunicações, Delegação da Covilhã, Portugal. E-mail: fmlmartins@esec.pt
4Rui Sousa Mendes. Ph.D. degree at FMH in Human Kinetics Sciences - Motor Control and Learning, Technical University of Lisboa, Portugal. Affiliation: Polytechnic Institute of Coimbra, ESEC, Department of Education. E-mail: rmendes@esec.pt
5António José Figueiredo. PhD degree in Sport Sciences, University of Coimbra, Portugal. Affiliation: CIDAF, Faculty of Sport Sciences and Physical Education, University of Coimbra, Portugal. E-mail: afigueiredo@fcdef.uc.pt
How to cite: Clemente, F. M., Santos-Couceiro, M., Lourenço-Martins, F., Sousa, R., & Figueiredo, A. J. (2014). Intelligent systems for analyzing soccer games: The weighted centroid. Ingeniería e Investigación, 34(3), 70-75.
ABSTRACT
New, intelligent systems have been developed recently to improve the quality of match analysis. These systems analyze the tactical behavior of the teams. However, the existing methods leave room for improvement. Thus, the main goal of this study is to refine the team centroid metric by considering all of the players on the team and the ball position. Furthermore, this study analyzes the relationship between the centroids of the two opposing teams. One 11-on-11 soccer match was analyzed to test the new centroid algorithm. The results provided strong evidence of the positive relation between the centroids of the two teams over time in the x-axis (rs = 0.781) and the y-axis (rs = 0.0707). This study confirmed the results of previous studies that analyzed the relationship between team centroids. Furthermore, it was possible to prove the effectiveness of the new tactical metric and its relevance for adding information during a match.
Keywords: Match Analysis, Soccer, Tactics, Collective Behavior, Centroid.
RESUMEN
Nuevos sistemas inteligentes se han desarrollado recientemente, con el fin de mejorar la calidad de análisis del partido. Estos sistemas basan su análisis en el comportamiento táctico de los equipos, sin embargo, todos los métodos innovadores necesitan algunos cambios para aumentar su potencial en las implicaciones prácticas. Por lo tanto, el objetivo principal de este trabajo es proponer una actualización del centroide y métrica del equipo, teniendo en cuenta a todos los jugadores del equipo y también la posición de la bola, además, tiene como objetivo analizar la relación entre los centroides de los equipos oponentes.
Un partido de fútbol 11, fue analizado con el fin de aplicar el nuevo algoritmo del centroide; los principales resultados mostraron una fuerte evidencia de la relación positiva entre centroides en el eje x (rs = 0.781) y el eje y (rs = 0.0707). Este estudio, confirma trabajos previos que analizaron la relación positiva y fuerte entre equipos centroides. Además, fue posible demostrar la pertinencia de la nueva actualización de métrica táctica y su importancia para el aumento de la información en las aplicaciones prácticas durante el partido.
Palabras clave: análisis del partido de fútbol, táctica, comportamiento colectivo y Centroide.
Received: May 21st 2014 Accepted: August 28th 2014
Introduction
Athletic performance consists of a complex series of interrelationships among a wide variety of performance variables (Borrie, Jonsson and Magnusson, 2002). Therefore, the structures and configurations of play should be considered as a whole rather than analyzed in an individual manner (Clemente, Couceiro, Martins, Dias and Mendes, 2012). Systems with many dynamically interacting elements can produce rich and varied patterns of behavior that are clearly different from the behavior of individual players. Following this line of thought, McGarry et al. (2002) proposed that the rich and varied patterns that arise in team sports are the result of self-organization among many coupled oscillators (e.g., players). Thus, for many team sports specific methods and metrics are required to analyze and evaluate the dynamic collective behavior, i.e., the tactical behavior (Clemente, 2012).
For the game of soccer, several match analysis techniques have been developed to assist coaches in decision making (Carling, Williams and Reilly, 2005). Notational analysis is the most common method for match analysis (Clemente, Couceiro, Martins and Mendes, 2012). However, this method does not make use of intrinsic knowledge of the procedures that lead to the results used in the analysis (Lees, 2002). Recently, intelligent systems have been developed to reach a deeper understanding of team behaviors, i.e., collective tactical behavior (Passos et al., 2011; Frencken et al., 2011). Through automatic tracking of player movements, it is possible to identify with reasonable accuracy the players' positions on the field. The position information can be analyzed to determine the collective behavior during a match. One of the most relevant and most used metrics is the centroid, which represents the team's geometrical center.
Related work: Team Centroid
The first application of the centroid method was presented by Frencken and Lemmink (2008) at the Fifth World Congress on Science and Football. This analysis method was applied to a 4-on-4 soccer game; only 9 offensive plays that resulted in shots on goal (excluding long shots) were recorded and analyzed. The centroid was defined as the average position of all of the players on a team (excluding the goalkeeper). From the centroid, three measures were derived: i) the x-distance (m), representing the longitudinal displacement; ii) the y-distance (m), representing the lateral displacement; and iii) the radial distance (m), comprising both the longitudinal and lateral displacements. For example, for an 11-man team the centroid defined by Frencken and Lemmink (2008) would be as shown in Figure 1.
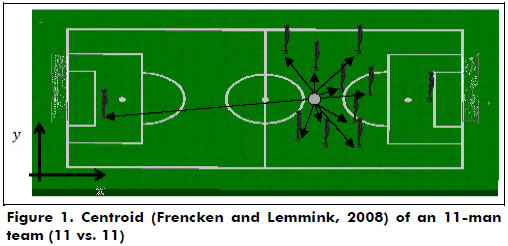
The results suggested an in-phase relationship between the centroids of the two teams; i.e., the motions of the two centroids were coupled. Frencken and Lemmink (2008) also noted that in 7 of 9 goal-scoring opportunities, the distance between the two centroids was nearly zero or the positions of the two centroids reversed; i.e., the attacking team's centroid was between the defending team's goal and its centroid. Nevertheless, these specific situations cannot be generalized. Considering the defensive tactical principles of concentration and unit, it is to be expected that most of the time the centroid of the defending team would be closer to that team's goal to prevent the attacking team from penetrating. Goal-scoring opportunities are generated by defensive imbalances and may not represent the majority of collective behavior, only an occasional situation. Furthermore, a 4-on-4 game may not represent the collective behavior in an 11-on-11 game.
Yue et al. (2008) developed the concept of the geometrical centroid, representing the same analysis of centroid. Its formula was:
Analyzing an 11-on-11 game, Yue et al. (2008) calculated centroids for 92 temporal series. The authors showed that the method can provide useful information for coaching and for predicting match outcomes.
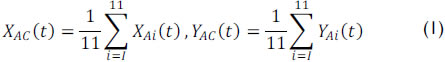
Lames et al. (2010) analyzed the final match of the 2006 FIFA World Cup between Italy and France. The centroid was calculated excluding 9 players and only considering the difference between the maximum and minimum positions of the players except the goalkeeper:

This formulation is substantially different from that of Frencken and Lemmink (2008). At any instant, only two players determine the team's centroid (see Figure 2).
There could be a case where nine players are at the maximum point and only one player is at the minimum point. Thus, this method may be misleading. Nevertheless, using 25 unspecified recordings, the authors presented results that corroborated the tendency of the team centroids to be coupled, as observed by Frencken and Lemmink (2008) in games with fewer players on a side. The in-phase relationship was momentarily absent when possession of the ball was lost or gained.
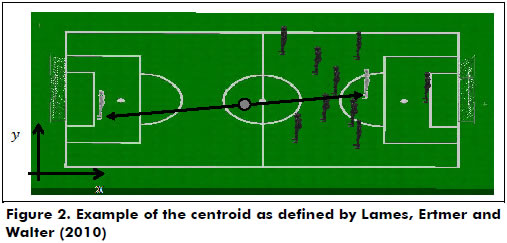
The centroid method was applied to a 5-on-5 basketball game by Bourbousson et al. (2010). The centroid was calculated as in Frencken and Lemmink (2008). Six sequences of play recorded during one professional basketball match and of sufficient duration to include intermittent changes in ball possession were analyzed. The results confirmed those of previous studies (Frencken and Lemmink, 2008; Lames et al, 2010); i.e., an in-phase relationship between the team centroids was observed, except for changes in ball possession and acyclic events. In the longitudinal axis, Bourbousson et al. (2010) showed that the defensive team spent less time changing their positions. The authors found strong evidence of anti-phase behavior in the lateral axis due to contraction or expansion; an example is shown in Figure 3.
Despite the different player positions in the lateral field axis (cf. Figure 3), the position of the centroid is the same in both cases. Thus, the anti-phase relationship may be due to transitions of ball possession followed by a return to the in-phase state rather than to expansion/contraction.
Frencken et al. (2011) analyzed team centroids in 5-on-5 games. Using the formulation used in Frencken and Lemmink (2008), Frencken et al. (2011) analyzed 19 open plays that resulted in goals being scored. Using the Pearson correlation test, the authors (Frencken et al., 2011) showed high and positive correlations between centroids in the longitudinal and lateral axes, suggesting that the two centroids tend to move in the same direction during the game, i.e., predominantly maintaining an in-phase relationship. Similar to the results of Bourbousson, Sève and McGarry (2010), it appeared that there was a higher correlation between centroids in the longitudinal axis, demonstrating their prevalence and association with offensive actions that resulted in scoring a goal (Frencken et al., 2011).
Calculating centroid positions in a manner similar to that of Frencken and Lemmink (2008), Duarte et al. (2012) analyzed 3 vs. 3 sub-phases of play in soccer games and confirmed that the predominant state was in-phase. As in two previous studies (Frencken et al., 2011; Bourbousson et al., 2010), the correlation between centroids was higher in the longitudinal axis. The results from the statistical analysis showed significantly superior centroid mean values at the moment of ball control by the passing player, compared to the moment of assisted pass or the ball crossing the defensive line.
In a study by Bartlett et al. (Bartlett, Button, Robins, Dutt-Mazumder and Kennedy, 2012), 5 soccer games from 11 European championships were analyzed. The sample consisted only of open plays, i.e., excluding set-pieces or interruptions of play. A total of 305 open plays were analyzed. The sample was composed of 4 groups of open attacking plays: i) those leading to goals, ii) those leading to a kick or a header that did not score a goal; iii) those that resulted in an active loss of possession; and iv) other plays in which possession was lost passively. Using calculations of the average player positions (the authors did not specify whether the goalkeeper was included), the authors found that the centroids of the two teams were highly correlated in the longitudinal and lateral axes. The authors (Bartlett et al., 2012) suggested that when comparing groups of plays, the correlation between the centroids is higher in the plays that lead to goals or shots on goal than in those that result in loss of the ball, which was contrary to the authors' expectations. However, it may be speculated that plays with less instability and efficacy showed lower correlation values because of an imbalance, resulting in ineffective attacker actions.
Statement of Contribution
Previous studies presented general results for team centroids that showed a predominantly in-phase relationship. These studies typically analyzed the longitudinal and lateral axes, and the highest values of positive correlation between centroids arose in the longitudinal axis.
It has been widely suggested that in-phase relationships are broken only by particular events such as a loss of ball possession or defense-to-attack or attack-to-defense transitions. However, the analyses of previous studies mostly focused on the centroid, i.e., investigating only the synchronized behavior of teams. A systemic analysis is fundamental and should not be dismissed; however, the centroid method can and should be properly exploited, particularly for an online match analysis. For this purpose, some changes can and should be implemented.
Only three of the studies discussed (Yue et al., 2008; Lames et al., 2010; Bartlett et al., 2012) calculated the centroid of an 11-man soccer team. Furthermore, one of these three studies (Lames et al., 2010) does not satisfy the requirements of observation, as discussed previously. Additionally, the goalkeeper is typically excluded from the centroid calculation (Frencken et al., 2011), and the position of the ball and the influence of the players closest to the ball are ignored.
Thus, the main goal of this study is to revise the centroid methodology to include the positions of the goalkeeper and the ball. Furthermore, this study analyzes the relationship between the centroids of the teams and the movement of the centroids in relation to the state of ball possession.
Methods
Participants
The tactical metrics were evaluated in an 11-on-11 soccer game. The analysis was performed during an official soccer match between two professional teams in the Portuguese premier league.
Material
The actions of both teams were captured using a digital camera (GoPro Hero with 1280 x 960 pixels resolution) with a frame rate of 30 frames per second. The camera was placed at an elevation above the field to capture the entire field.
Procedures
Play was captured using a digital camera (GoPro Hero with 1280 × 960 pixels resolution) with a frame rate of 30 frames per second. The camera was placed 15 meters above the field and 10 meters from the touchline at mid-field to capture the entire field. The field dimensions were in 104×68 meters. The first step in collecting the data was to record the players' movements using the digital camera as previously described. Because the camera had a field of view of 180o, it was not necessary to move the camera, thus ensuring consistent reference points on the images. The field was calibrated using 19 markers positioned on the field lines. After recording the soccer match, the physical space was calibrated using a direct linear transformation (DLT), which measures the positions of the elements (i.e., the players and the ball) in pixels in the metric space (Abdel-Aziz and Karara, 1971).
Following calibration, the positions of the players were tracked, and the virtual coordinates were transformed into physical coordinates at each second, thus providing the Cartesian (x and y) positions of the players during the match. The entire process associated with this approach (i.e., detection and identification of player trajectories, spatial transformations, and computation of the metrics) was performed using the MATLAB (R2013) programming environment. The process of identifying the virtual positions of the players and the ball in each frame was performed manually. For a more detailed description of the process, see Couceiro, Clemente and Martins (2013).
For the sake of efficiency, only the time when the ball was in play was considered, and the periods when the ball was not on the field (i.e., out of bounds) were excluded from the analysis. Because the methodology proposed here has some computational complexity, each second corresponded to an analyzed instant for each player and the ball.
Calculation Procedures: Weighted Centroid
Although the goalkeeper's movements are more limited, they should not be excluded from the centroid calculation; i.e., if the ball is closest to the goalkeeper, he or she will be more relevant than any forward player. Thus, assigning weights to the players' positions in relation to the ball should be considered in the centroid computation (cf. Figure 4).
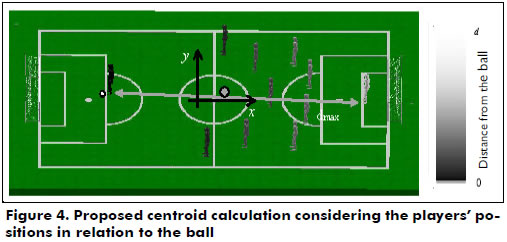
According to Frencken et al. (2011), the centroids of the teams can provide three measures: i) the x-distance (m) representing the lengthwise displacement (i.e., down-field); ii) the y-distance (m) representing the lateral displacement (i.e., across the field); and iii) the radial distance (m) comprising both the lengthwise and lateral displacements. These measures were obtained based on the centroid position relative to the origin 0, i.e., (0,0), which was defined at the center of the field.
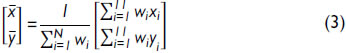
The position of the ith player is defined as (xi,yi). The relevance of each player to the team's centroid, i.e., the weight wi, could be based on the Euclidean distance from each player to the ball (Clemente et al., 2013), i.e.,
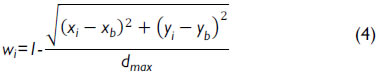
where (xb,yb) corresponds to the position of the ball and dmax is the Euclidean distance of the farthest player from the ball at each iteration (Clemente et al., 2013). Thus, closer players have higher weights than farther players.
Statistical Analysis
To compute the correlations for the tactical metrics and the teams, the Spearman test of positive and negative variables was used. The correlation tests were performed using the software SPSS version 19 (IBM Corp.) with a significance level of 5%.
A one-way ANOVA was performed to determine if there were statistically significant differences between a team's centroid with and without possession of the ball. The assumption of a normal distribution in the one-way ANOVA for the three practice conditions (i.e., conservative, neutral and risky) was investigated using the Kolmogorov-Smirnov test with the Lilliefors correction. It was found that the distributions were not normal in the dependent variable. The distributions were not normal because n = 110, but by the Central Limit Theorem (Maroco and Bispo, 2003; Pedrosa and Gama, 2004) we assumed a normal distribution (Akritas and Papadatos, 2004). The analysis of homogeneity was performed using the Levene test. It was found that there was no uniformity of practice under the previously mentioned conditions. However, despite the lack of homogeneity, the F-test (ANOVA) is robust to homogeneity violations when the number of observations in each group is equal or approximately equal (Vicent, 1999; Pestana and Gageiro, 2010; Maroco, 2010), as in our case. As with the assumption of normality, violating this assumption does not radically change the F-value. A classification of effect size (i.e., the measure of the proportion of the total variation in the dependent variable explained by the independent variable) was performed as in Maroco (2010) and Pallant (2011). This analysis was performed using SPSS with a significance level of 5%.
Results
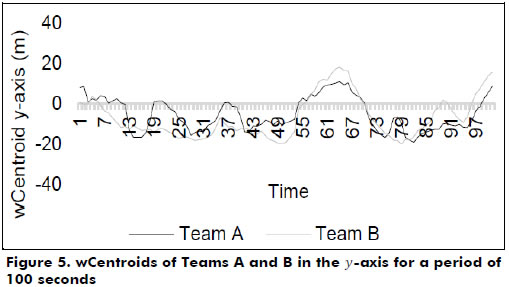
Spearman's correlation test showed strong evidence of the positive relation between the wCentroids of the two teams over time in the y-axis (rs = 0.707). This relationship can be observed in Figure 5, where the oscillations are similar for both teams.
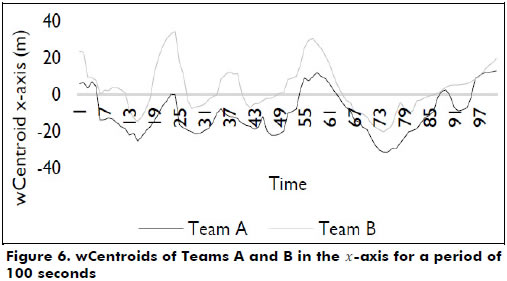
Similarly, the centroids of the teams in the -axis showed a very high positive correlation (rs = 0.781). This relationship can be observed in Figure 6.
The wCentroid positions in the -axis showed statistically significant differences, with a small difference between the moments with and without possession of the ball for Team A (F = 86.171; p-value = 0.001; η2 = 0.052; Power = 1.000; small effect size) and Team B (F = 43.553; p-value ≤ 0.001; η2 = 0.027; Power = 1.000; small effect size). In both cases, the results suggested that when not in possession of the ball, teams move closer to their defensive zone.
The wCentroid positions in the y-axis showed statistically significant differences with a very small difference between the moments with and without possession of the ball for team A (F = 11.545; p-value = 0.001; η2 = 0.007; Power = 0.994; very small effect size); no differences were found for Team B (F = 0.213; p-value = 0.809; η2 = 0.001; Power = 0.083; very small effect size).
Discussion
First, it is important to emphasize the significance of the new method of calculating centroids proposed in this study. Including the position of the ball and all of the team members and their importance in relation to the ball in the calculation of the centroid improves its usefulness. As suggested previously, if the ball is closer to the goalkeeper, his or her influence will be substantially higher than that of the other team members. The following example compares the three methods of calculating centroids (cf. Figure 7).
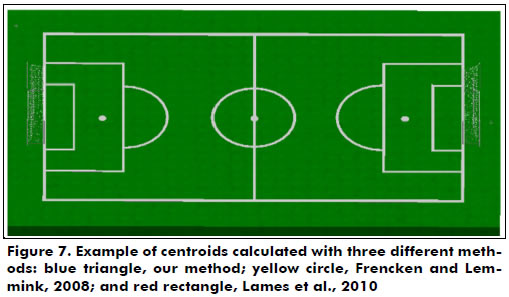
In considering the figure, the watertight nature of the centroid of Lames et al. (2010), where only two players determine the team's centroid, should be noted. This definition is unlikely to fully capture the dynamics of the team. The metric with the highest scientific application (Frencken and Lemmink, 2008) does not include the ball position. Thus, this metric implies that the player farthest from the ball is equally as crucial as the one closest to the ball, thus distorting the influence of the player closest to the ball, i.e., his or her influence in the center of the game (Costa et al., 2010). The proposed metric is more inclusive, considering all members of the team and the ball position, integrating all data as determinants of the centroid and its subsequent interpretation.
Considering Spearman's correlation test, it was possible to observe strong evidence of the positive relation between the centroids of the two teams over time. Additionally, it was possible to verify regular oscillations of the centroids between positive and negative values in the y-axis, a reflection of the attempts by the attacking team to unbalance the defense by moving the centroid away from the center of the field, which the defenders normally maintain to prevent the advance of their opponents. Evidence of the importance of an imbalance can be observed in the sequence that led to the goal by Team A (cf. Figure 6), where the team took possession of the ball on one side of the field, i.e., negative y values of the centroid, subsequently moved to the other side, i.e., positive y values of the centroid, and immediately shifted back to the other side again, thus unbalancing the defensive formation of the opponents. Hence, one can then observe that while on the offensive, lateral attacks are fundamental to overcoming the defense (Lucchesi, 2001).
Similar to the results in the y-axis, a high positive correlation was found between the centroids of the two teams in the x-axis (i.e., lengthwise), confirming the tendency toward an in-phase relation between the teams over time because they try to maintain a defensive balance to protect their goal (Frencken et al., 2011). It is important to note that the positive values in the graph indicate that Team B is on the defensive and the negative values indicate that Team A is on the defensive. Nevertheless, through Figure 7 it is possible to verify that Team A defends by maintaining a larger distance in relation to the opponents and, conversely, Team B allows a greater proximity of Team A.
In the case where Team A is defending, the ability to maintain a greater distance between team centroids may suggest a smaller dispersion of the Team A players or a higher dispersion of the Team B players. This would represent a playing style with fewer players involved on offense and consequently result in a higher dispersion in the x-axis. Thus, it is possible to conclude that the centroid metric should include an indicator of the dispersion of the players.
We next consider the ability to detect defensive imbalances. Whenever the centroid of the attacking team is very close to that of the defending team (the distance is nearly 0), there is a greater chance that the attacking team will score (Frencken and Lemmink, 2008). If this situation occurs frequently during a match, it should be detected and corrected; the players should be repositioned to ensure the in-phase relationship and adjust the distance between the centroids.
The proposed metrics offer more possibilities in the analysis of soccer because it is easy to adjust them with automatic tracking systems. These metrics can provide greater knowledge about tactical behavior and thus measure the accomplishment of playing principles (Costa et al., 2010). It is also possible to measure the distance between centroids and identify the oscillations with various styles of play. This information can be useful for identifying the characteristics of tactical behaviors and collective organization. The relevance of such methods should be understood in the context of the principles of the game and not interpreted without considering the dynamics.
Conclusions
The main goal of this paper was to propose a modification of the centroid metric used in the analysis of soccer games. Including the positions of all team members and the position of the ball allows a greater understanding of team behaviors. Furthermore, this intelligent system improves match analysis, allowing new feedback and understanding during a soccer game. An analysis using the revised definition of the centroid revealed strong correlations between the team centroids in the lateral and longitudinal directions. Additionally, it was concluded that winning teams, when on the defensive, maintained a separation between their own centroid and that of the opposing team, which made the defense more effective.
Acknowledgements
This study was supported by FCT project, PEst-OE/EEI/ LA0008/2013.
References
Abdel-Aziz, Y., & Karara, H. (1971). Direct linear transformation from comparator coordinates into object space coordinates in close-range photogrammetry. In ASP symposium on close-range photogrammetry (pp. 1-18). Falls Church, VA: American Society of Photogrammetry. [ Links ]
Akritas, M. G., & Papadatos, N. (2004). Heteroscedastioc One-Way ANOVA and Lack-of-Fit Tests. Journal of the American Statistical Association, 99(466), 368-390. [ Links ]
Bartlett, R., Button, C., Robins, M., Dutt-Mazumder, A., & Kennedy, G. (2012). Analysing Team Coordination Patterns from Player Movement Trajectories in Soccer: Methodological Considerations. International Journal of Performance Analysis in Sport, 12(2), 398-424. [ Links ]
Borrie, A., Jonsson, G., & Magnusson, M. (2002). Temporal pattern analysis and its applicability in sport: An explanation and exemplar data. Journal of Sports Science, 20(10), 845-852. [ Links ]
Bourbousson, J., Sève, C., & McGarry, T. (2010). Space-time coordination dynamics in basketball: Part 2. The interaction between the two teams. Journal of Sports Sciences, 28(3), 349-358. [ Links ]
Carling, C., Williams, A.M., & Reilly, T. (2005). Handbook of soccer match analysis: A systematic approach to improving performance. Abingdon, UK: Routledge. [ Links ]
Clemente, F. M. (2012). Pedagogical Principles of Teaching Games for Understanding and Nonlinear Pedagogy in the Physical Education Teaching. Movimento, 18(2), 315-335. [ Links ]
Clemente, F., Couceiro, M., Martins, F., Dias, G., & Mendes, R. (2012). The influence of task constraints on attacker trajectories during 1v1 sub-phase in soccer practice. SportLogia, 8(1), 13-20. [ Links ]
Clemente, F., Couceiro, M., Martins, F., & Mendes, R. (2012). Team's Performance on FIFA U17 World Cup 2011: Study based on Notational Analysis. Journal of Physical Education and Sport, 12(1), 13-17. [ Links ]
Clemente, F. M., Couceiro, M. S., Martins, F. M., & Mendes, R. (2013). An online tactical metrics applied to football game. Research Journal of Applied Sciences, Engineering and Technology, 5(5), 1700-1719. [ Links ]
Costa, I. T., Garganta, J., Greco, P. J., Mesquita, I., & Seabra, A. (2010). Influence of Relative Age Effects and Quality of Tactical Behaviour in the Performance of Youth Soccer Players. International Journal of Performance Analysis in Sport, 10(2), 82-97. [ Links ]
Couceiro, M. S., Clemente, F. M., & Martins, F. M. (2013). Analysis of football player's motion in view of fractional calculus. Central European Journal of Physics, 11(6), 714-723. [ Links ]
Duarte, R., Araújo, D., Freire, L., Folgado, H., Fernandes, O., & Davids, K. (2012). Intra- and inter-group coordination patterns reveal collective behaviors of football players near the scoring zone. Human Movement Science, 31(6), 1639-1651. [ Links ]
Frencken, W., & Lemmink, K. (2008). Team kinematics of small-sided soccer games: A systematic approach. In T. Reilly, & F. Korkusuz (Eds.), Science and Football VI (pp. 161-166). Oxon: Routledge Taylor and Francis Group. [ Links ]
Frencken, W., Lemmink, K., Delleman, N., & Visscher, C. (2011). Oscillations of centroid position and surface area of soccer teams in small-sided games. European Journal of Sport Science, 11(4), 215-223. [ Links ]
Lames, M., Erdmann, J., & Walter, F. (2010). Oscillations in football - Order and disorder in spatial interactions between the two teams. International Journal of Sport Psychology, 41(4), 85-86. [ Links ]
Lees, A. (2012). Technique analysis in sports: a critical review. Journal of Sports Sciences, 20(10), 813-828. [ Links ]
Lucchesi, M. (2001). Attacking Soccer: A Tactical Analysis. Auburn, Michigan: Reedswain Publishing. [ Links ]
Maroco, J. (2010). Análise Estatística com o PASW Statistics [Statistical Analysis with PASW Statistics]. Lisboa: Edições Sílabo. [ Links ]
Maroco, J., & Bispo, R. (2003). Estatística Aplicada às Ciências Sociais e Humanas [Applied Statistics at the Social and Human Sciences]. Lisboa: Climepsi Editores. [ Links ]
McGarry, T., Anderson, D., Wallace, S., Hughes, M., & Franks, I. (2002). Sport competition as a dynamical self-organizing system. Journal of Sports Sciences, 20(10), 771-781. [ Links ]
Pallant, J. (2011). SPSS Survival Manual: A step by step guide to data analysis using the SPSS program. Australia: Allen and Unwin. [ Links ]
Passos, P., Davids, K., Araújo, D., Paz, N., Minguéns, J., & Mendes, J. (2011). Networks as a novel tool for studying team ball sports as complex social systems. Journal of Science and Medicine in Sport, 14(2), 170-176. [ Links ]
Pedrosa, A. C., & Gama, S. M. A. (2004). Introdução computacional à probabilidade e estatística [Introduction Computational Probability and Statistics]. Porto: Porto Editora. [ Links ]
Pestana, M. H., & Gageiro, J. N. (2008). Análise de dados para as ciências sociais: A complementaridade do SPSS [Data Analysis for the Social Sciences: The complamentarity of the SPSS] (5th ed.). Lisboa, Portugal: Edições Sílabo. [ Links ]
Vincent, W. J. (1999). Statistics in Kinesiology (2nd ed.). Champaign: Human Kinetics. [ Links ]
Yue, Z., Broich, H., Seifriz, F., & Mester, J. (2008). Mathematical Analysis of a Soccer Game. Part I: Individual and Collective Behaviors. Studies in Applied Mathematics, 121(3), 223-243. [ Links ]
